Intel HD Graphics (Haswell) vs Intel HD Graphics (Braswell) vs Intel HD Graphics (Broadwell)
Intel HD Graphics (Haswell) ► remove from comparison
Die Intel HD Graphics ist eine in den Haswell Prozessoren integrierte Grafikkarte. Sie kommt in den mobilen Celeron- und Pentium-Modellen zu Einsatz. Je nach Prozessormodell kann die HD Graphics (auch GT1 genannt) unterschiedlich getaktet sein (typischerweise 200 MHz Basis- und 1.000 MHz Turbo-Takt). Dies sowie die Geschwindigkeit des angebundenen Arbeitsspeichers beeinflusst die Performance entscheidend.
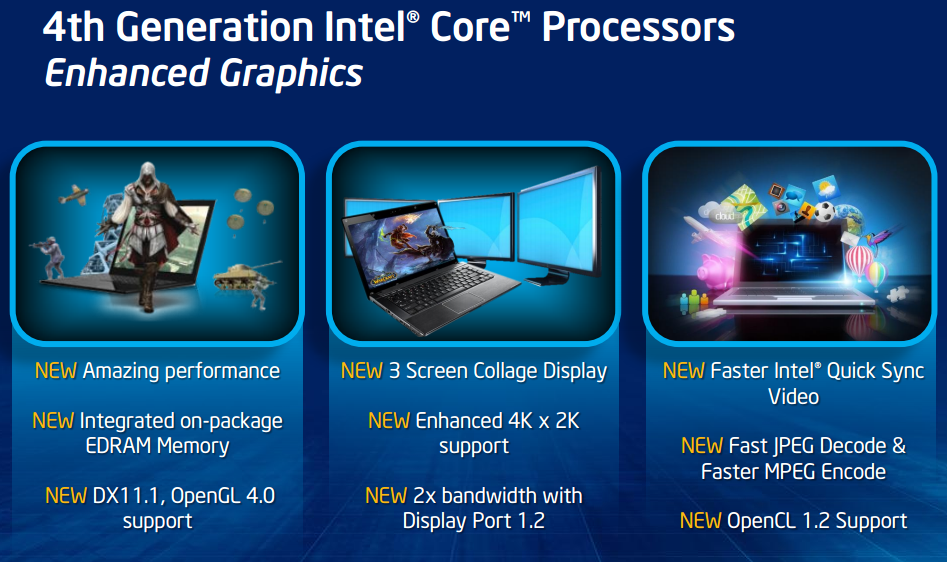
Der Grafikkern wurde im Vergleich zum Intel HD Graphics 4000 der Ivy-Bridge-Generation in verschiedenen Punkten weiterentwickelt. So unterstützt die GPU nun mit DirectX 11.1, OpenCL 1.2 und OpenGL 4.0 alle wichtigen aktuellen Standards. Auch ein verbesserter Decoder für 4K-Videos sowie ein überarbeiteter Quick-Sync-Encoder (bei vielen Einstiegsmodellen deaktiviert) sind mit an Bord.
Die Performance der HD Graphics (Haswell) liegt durch die Beschneidung auf nur noch 10 EUs deutlich unter der HD Graphics 4400 /4600 und etwa auf dem Level der älteren HD Graphics 3000 oder AMDs Radeon HD 8250 . Nur die wenigsten aktuellen Spiele des Jahres 2013, beispielsweise das sehr anspruchslose Dota 2, können mit niedrigsten Details flüssig dargestellt werden.
Der Stromverbrauch ist dank des 22-Nanometer-Prozesses mit Tri-Gate-Transistoren relativ gering und wird dynamisch vom TDP-Budget des gesamten Chips abgezweigt. Die HD Graphics (Haswell) wird in Dual-Core-Prozessoren der ULV- und regulären 37-Watt-Klasse eingesetzt.
Weitere Details zur Grafikkartenarchitektur der Haswell Generation finden Sie in unserem Artikel zur Haswell-Architektur sowie dem Testbericht der HD Graphics 4600 .
Intel HD Graphics (Braswell) ► remove from comparison
Die Intel HD Graphics (Braswell) ist eine in den Low-End-SoCs der Braswell-Serie (z.B. Pentium N3700 ) integrierte Grafikeinheit. Sie basiert auf der gleichen Architektur wie die GPU verschiedener Broadwell-Prozessoren (z.B. HD Graphics 5300 ), bietet allerdings deutlich weniger Shadereinheiten und geringere Taktraten. Die genauen Spezifikationen hängen vom jeweiligen SoC ab: Die schnellste Variante mit 16 EUs und maximal 700 MHz schlägt die ältere HD Graphics (Bay Trail) um etwa Faktor zwei, andere Modelle mit lediglich 12 aktiven EUs schneiden etwas schlechter an. Zum Zeitpunkt der Vorstellung im ersten Quartal 2015 existieren folgende Varianten:
Anfangs wurde die GPU nur Intel HD Graphics benannt, später ab 2016 als Intel HD Graphics 400 (12 EU Version) und Intel HD Graphics 405 (16 EU Version) bezeichnet.
Anwender müssen sich deshalb insbesondere bei den Celeron-Modellen, die zusätzlich durch die Beschneidung auf nur zwei CPU-Kerne ausgebremst werden, auf ältere und anspruchslose Spiele beschränken. Videos werden dagegen auch in 4K/H.265 flüssig wiedergeben.
Intel HD Graphics (Broadwell) ► remove from comparison
Die Intel HD Graphics (Broadwell) (GT1) ist eine Prozessorgrafikkarte in den CPUs der Broadwell- Generation. Die GPU wird in einigen Pentium- und Celeron-Modellen der Serie verbaut und bietet 12 EUs (Execution Units bzw. Ausführungseinheiten). Die maximale Turbo-Taktrate und damit auch die Performance kann sich von Modell zu Modell leicht unterscheiden, insgesamt siedelt sich die Grafikkarte aber nur im Low-End-Segment an und ist für neuere Spiele kaum ausreichend.
Architektur und Features
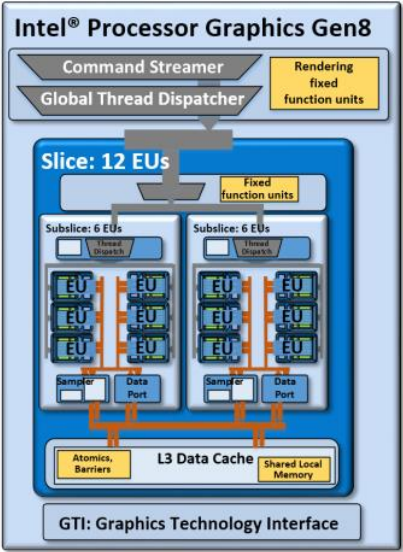
Broadwell integriert eine Grafikeinheit auf Basis der Intel-Gen8-Architektur, die gegenüber dem Vorgänger Intel Gen7.5 (Haswell) in verschiedenen Punkten weiterentwickelt wurde. So hat Intel unter anderem die "Subslice" genannten Shader-Arrays umorganisiert, die bei diesem Modell nun jeweils 6 Execution Units (EUs) beinhalten. Zwei Subslices bilden wiederum einen Slice mit insgesamt 12 EUs. Hinzu kommen größere L1-Caches und Verbesserungen im Front-End, die die Leistung zusätzlich steigern sollen.
Die HD Graphics (Broadwell) repräsentiert die kleinste, auch "GT1" bezeichnete Ausbaustufe mit einem Slice und 12 EUs. Daneben existieren auch schnellere Varianten wie die GT2 (24 EUs) sowie die GT3/GT3e (48 EUs) ohne/mit zusätzlichem eDRAM-Cache.
Alle Broadwell-GPUs unterstützen OpenCL 2.0 sowie DirectX 12 (FL 11_1) . Zudem kann der Videodecoder nun auch den H.265-Codec verarbeiten, greift dafür allerdings nur teilweise auf besonders sparsame Fixed-Function-Einheiten zurück. Die Bildausgabe erfolgt über DP 1.2/eDP 1.3 (max. 3.840 x 2.160 @ 60 Hz) oder HDMI 1.4a (max. 3.840 x 2.160 @ 24 Hz), HDMI 2.0 steht dagegen nicht zur Verfügung. Es können maximal drei Displays parallel angesteuert werden.
Performance
Obwohl der maximale GPU-Takt etwas niedriger ausfällt, dürfte die HD Graphics (Broadwell) die ältere HD Graphics (Haswell) klar übertrumpfen und etwa das Niveau der HD Graphics 4000 erreichen. Nur sehr wenige aktuelle Spiele wie das anspruchslose Dota 2 lassen sich in niedrigen Einstellungen flüssig darstellen.
Leistungsaufnahme
Die bislang vorgestellten Celeron- und Pentium-Prozessoren gehören ausschließlich der sparsamen 15-Watt-Klasse an, später dürften auch weitere Dual-Core-Modelle mit 37 Watt TDP folgen. Abhängig davon ist die HD Graphics (Broadwell) sowohl in kleinen Subnotebooks als auch deutlich größeren Geräten zu finden.
Intel HD Graphics (Haswell) Intel HD Graphics (Braswell) Intel HD Graphics (Broadwell) HD Graphics Serie Codename Haswell GT1 Braswell Broadwell GT1 Architektur Gen. 7.5 Haswell Gen. 8 Gen. 8 Broadwell Pipelines 10 - unified 16 - unified 12 - unified Kerntakt 200 - 1000 (Boost) MHz 320 - 700 (Boost) MHz 100 - 850 (Boost) MHz Speicherbandbreite 64/128 Bit 64/128 Bit 64/128 Bit Shared Memory ja ja ja API DirectX 11.1, Shader 5.0 DirectX 11.2, Shader 5.0 DirectX 12 (FL 11_1), OpenGL 4.3 Herstellungsprozess 22 nm 14 nm 14 nm Erscheinungsdatum 01.10.2012 01.04.2015 05.01.2015 Features QuickSync
CPU in HD Graphics (Haswell) GPU Base Speed GPU Boost / Turbo Intel Pentium 3560M 2 x 2400 MHz, 37 W 400 MHz 1100 MHz Intel Pentium 3550M 2 x 2300 MHz, 37 W 400 MHz 1100 MHz Intel Celeron 2970M 2 x 2200 MHz, 37 W 400 MHz 1100 MHz » show 10 more Intel Celeron 2950M 2 x 2000 MHz, 37 W 400 MHz 1100 MHz Intel Pentium 3558U 2 x 1700 MHz, 15 W 200 MHz 1000 MHz Intel Pentium 3556U 2 x 1700 MHz, 15 W 200 MHz 1000 MHz Intel Celeron 2981U 2 x 1600 MHz, 15 W 200 MHz 1000 MHz Intel Celeron 2980U 2 x 1600 MHz, 15 W 200 MHz 1000 MHz Intel Celeron 2957U 2 x 1400 MHz, 15 W 200 MHz 1000 MHz Intel Celeron 2955U 2 x 1400 MHz, 15 W 200 MHz 1000 MHz Intel Pentium 3561Y 2 x 1200 MHz, 11.5 W 200 MHz 850 MHz Intel Pentium 3560Y 2 x 1200 MHz, 11.5 W 200 MHz 850 MHz Intel Celeron 2961Y 2 x 1100 MHz, 11.5 W 200 MHz 850 MHz min. - max. 200 - 400 MHz 850 - 1100 MHz
CPU in HD Graphics (Braswell) GPU Base Speed GPU Boost / Turbo Intel Pentium N3700 4 x 1600 MHz, 6 W 400 MHz 700 MHz Intel Celeron N3160 4 x 1600 MHz, 6 W 320 MHz 640 MHz Intel Celeron N3150 4 x 1600 MHz, 6 W 320 MHz 640 MHz » show 2 more Intel Celeron N3050 2 x 1600 MHz, 6 W 320 MHz 600 MHz Intel Celeron N3000 2 x 1040 MHz, 4 W 320 MHz 600 MHz min. - max. 200 - 400 MHz 600 - 1100 MHz
CPU in HD Graphics (Broadwell) GPU Base Speed GPU Boost / Turbo Intel Pentium 3825U 2 x 1900 MHz, 15 W 100 MHz 850 MHz Intel Celeron 3765U 2 x 1900 MHz, 15 W 300 MHz 850 MHz Intel Pentium 3805U 2 x 1900 MHz, 15 W 100 MHz 800 MHz » show 3 more Intel Celeron 3755U 2 x 1700 MHz, 15 W 100 MHz 800 MHz Intel Celeron 3215U 2 x 1700 MHz, 15 W 300 MHz 850 MHz Intel Celeron 3205U 2 x 1500 MHz, 15 W 100 MHz 800 MHz min. - max. 100 - 400 MHz 600 - 1100 MHz
Benchmarks Performance Rating - 3DMark 11 + Fire Strike + Time Spy - HD Graphics (Haswell)
0.2 pt (0%)
...
Intel HD Graphics (Haswell)
...
max:
Performance Rating - 3DMark 11 + Fire Strike + Time Spy - HD Graphics (Braswell)
0.1 pt (0%)
Intel HD Graphics (Braswell)
...
max:
Performance Rating - 3DMark 11 + Fire Strike + Time Spy - HD Graphics (Broadwell)
0.2 pt (1%)
...
Intel HD Graphics (Broadwell)
...
max:
3DMark - 3DMark Ice Storm Unlimited Graphics
43493 Points (5%)
3DMark - 3DMark Cloud Gate Score
min: 2141 avg: 2403 median: 2335.5 (2%) max: 3011 Points
min: 1327 avg: 1595 median: 1529 (2%) max: 2134 Points
3398 Points (4%)
3DMark - 3DMark Cloud Gate Graphics
min: 3111 avg: 3415 median: 3278 (1%) max: 4199 Points
min: 1950 avg: 2187 median: 2193 (1%) max: 2457 Points
4015 Points (1%)
3DMark - 3DMark Fire Strike Standard Score
min: 300 avg: 323.8 median: 314 (1%) max: 383 Points
min: 204 avg: 235.2 median: 238 (0%) max: 256 Points
428 Points (1%)
3DMark - 3DMark Fire Strike Standard Graphics
min: 340 avg: 370.8 median: 362.5 (0%) max: 433 Points
min: 218 avg: 256.5 median: 261 (0%) max: 299 Points
463 Points (1%)
3DMark - 3DMark Ice Storm Graphics
min: 29291 avg: 34138 median: 34675 (4%) max: 40515 Points
min: 20067 avg: 24121 median: 24638 (3%) max: 26079 Points
45539 Points (5%)
3DMark 11 - 3DM11 Performance Score
min: 435 avg: 543 median: 544 (1%) max: 688 Points
min: 310 avg: 434.8 median: 436 (1%) max: 518 Points
729 Points (1%)
3DMark 11 - 3DM11 Performance GPU
min: 384 avg: 479.6 median: 484 (0%) max: 602 Points
min: 275 avg: 389.9 median: 395 (0%) max: 468 Points
641 Points (1%)
3DMark Vantage + Intel HD Graphics (Haswell) 3DMark Vantage - 3DM Vant. Perf. total
min: 2146 avg: 2163 median: 2163 (1%) max: 2180 Points
3DM Vant. Perf. total + Intel HD Graphics (Braswell) 1479 Points (0%)
3DM Vant. Perf. total + Intel HD Graphics (Broadwell)
2651 Points (1%)
3DM Vant. Perf. GPU no PhysX + Intel HD Graphics (Haswell) 3DMark Vantage - 3DM Vant. Perf. GPU no PhysX
min: 1848 avg: 1859 median: 1859 (1%) max: 1870 Points
3DM Vant. Perf. GPU no PhysX + Intel HD Graphics (Braswell)
1328 Points (1%)
3DM Vant. Perf. GPU no PhysX + Intel HD Graphics (Broadwell)
2196 Points (1%)
3DMark 06 3DMark 06 - Standard 1280x1024 + Intel HD Graphics (Haswell)
min: 2917 avg: 3274 median: 3357.5 (4%) max: 3463 Points
3DMark 06 - Standard 1280x1024 + Intel HD Graphics (Braswell)
1311 Points (2%)
3DMark 06 - Standard 1280x1024 + Intel HD Graphics (Broadwell)
5077 Points (7%)
Unigine Heaven 2.1 - Heaven 2.1 high
min: 3.2 avg: 4.9 median: 4.9 (1%) max: 6.6 fps
10.9 fps (2%)
Windows 7 Experience Index - Win7 Gaming graphics
6.3 Points (80%)
Windows 7 Experience Index - Win7 Graphics
4.7 Points (59%)
Cinebench R10 Cinebench R10 Shading (32bit) + Intel HD Graphics (Haswell) Cinebench R10 - Cinebench R10 Shading (32bit)
min: 3867 avg: 4235 median: 4215.5 (3%) max: 4642 Points
Cinebench R10 Shading (32bit) + Intel HD Graphics (Braswell)
min: 1788 avg: 2276 median: 2284 (2%) max: 2747 Points
Cinebench R10 Shading (32bit) + Intel HD Graphics (Broadwell)
4886 Points (3%)
Cinebench R11.5 Cinebench R11.5 OpenGL 64 Bit + Intel HD Graphics (Haswell) Cinebench R11.5 - Cinebench R11.5 OpenGL 64 Bit
min: 9.38 avg: 11.4 median: 11.6 (4%) max: 12.78 fps
Cinebench R11.5 OpenGL 64 Bit + Intel HD Graphics (Braswell)
min: 6.89 avg: 9.1 median: 9.5 (3%) max: 9.86 fps
Cinebench R11.5 OpenGL 64 Bit + Intel HD Graphics (Broadwell)
12.8 fps (4%)
Cinebench R15 + Intel HD Graphics (Haswell) Cinebench R15 - Cinebench R15 OpenGL 64 Bit
min: 10.28 avg: 13.2 median: 13.9 (1%) max: 14.59 fps
Cinebench R15 OpenGL 64 Bit + Intel HD Graphics (Braswell)
min: 11.13 avg: 12.4 median: 12.3 (1%) max: 13.82 fps
Cinebench R15 OpenGL 64 Bit + Intel HD Graphics (Broadwell)
17.8 fps (1%)
Cinebench R15 OpenGL Ref. Match 64 Bit + Intel HD Graphics (Haswell) Cinebench R15 - Cinebench R15 OpenGL Ref. Match 64 Bit
98 % (98%)
Cinebench R15 OpenGL Ref. Match 64 Bit + Intel HD Graphics (Braswell)
98 % (98%)
Cinebench R15 OpenGL Ref. Match 64 Bit + Intel HD Graphics (Broadwell)
98 % (98%)
GFXBench - GFXBench Car Chase Offscreen
11.6 fps (1%)
GFXBench 3.1 - GFXBench Manhattan ES 3.1 Offscreen
20.1 fps (0%)
12.5 fps (0%)
17.4 fps (0%)
GFXBench 3.0 - GFXBench 3.0 Manhattan Offscreen
28.7 fps (2%)
16.1 fps (1%)
21.5 fps (1%)
GFXBench (DX / GLBenchmark) 2.7 + Intel HD Graphics (Haswell) GFXBench (DX / GLBenchmark) 2.7 - GFXBench T-Rex HD Offscreen C24Z16
53.5 fps (0%)
GFXBench T-Rex HD Offscreen C24Z16 + Intel HD Graphics (Braswell) 33 fps (0%)
GFXBench T-Rex HD Offscreen C24Z16 + Intel HD Graphics (Broadwell) 47.1 fps (0%)
LuxMark v2.0 64Bit - LuxMark v2.0 Room GPU
min: 77 avg: 93 median: 93 (0%) max: 109 Samples/s
min: 54 avg: 54.5 median: 54.5 (0%) max: 55 Samples/s
86 Samples/s (0%)
LuxMark v2.0 64Bit - LuxMark v2.0 Sala GPU
min: 115 avg: 140 median: 140 (0%) max: 165 Samples/s
min: 76 avg: 80.5 median: 80.5 (0%) max: 85 Samples/s
182 Samples/s (0%)
ComputeMark v2.1 - ComputeMark v2.1 Result
min: 355 avg: 370 median: 370 (0%) max: 385 Points
306 Points (0%)
374 Points (0%)
Power Consumption - Furmark Stress Test Power Consumption - external Monitor *
43.7 Watt (6%)
Power Consumption - The Witcher 3 Power Consumption - external Monitor *
30.5 Watt (4%)
Average Benchmarks Intel HD Graphics (Haswell) → 100% n=20 Average Benchmarks Intel HD Graphics (Braswell) → 70% n=20 Average Benchmarks Intel HD Graphics (Broadwell) → 117% n=20
- Bereich der Benchmarkergebnisse für diese Grafikkarte
- Durchschnittliche Benchmarkergebnisse für diese Grafikkarte
* Smaller numbers mean a higher performance
1 This benchmark is not used for the average calculation
Spiele-Benchmarks Die folgenden Benchmarks basieren auf unseren Spieletests mit Testnotebooks. Die Performance dieser Grafikkarte bei den gelisteten Spielen ist abhängig von der verwendeten CPU, Speicherausstattung, Treiber und auch Betriebssystem. Dadurch müssen die untenstehenden Werte nicht repräsentativ sein. Detaillierte Informationen über das verwendete System sehen Sie nach einem Klick auf den fps-Wert.
HD Graphics (Haswell):
0 (!) [X] MSI CX61 2QC 2970M MS-16GD Intel Celeron 2970M 2.2GHz
HD Graphics (Haswell)
fps
100%
HD Graphics (Haswell):
4.9 (!) [X] MSI CX61 2QC 2970M MS-16GD Intel Celeron 2970M 2.2GHz
HD Graphics (Haswell)
min:
1 fps, max:
7 fps
fps
100%
HD Graphics (Haswell):
14.3 [X] MSI CX61 2QC 2970M MS-16GD Intel Celeron 2970M 2.2GHz
HD Graphics (Haswell)
fps
100%
HD Graphics (Haswell):
8 [X] MSI CX61 2QC 2970M MS-16GD Intel Celeron 2970M 2.2GHz
HD Graphics (Haswell)
fps
100%
HD Graphics (Haswell):
5.9 [X] MSI CX61 2QC 2970M MS-16GD Intel Celeron 2970M 2.2GHz
HD Graphics (Haswell)
min:
5 fps, max:
7 fps
fps
100%
HD Graphics (Haswell):
13 [X] MSI CX61 2QC 2970M MS-16GD Intel Celeron 2970M 2.2GHz
HD Graphics (Haswell)
min:
7 fps, max:
13 fps
fps
100%
HD Graphics (Haswell):
62 [X] MSI CX61 2QC 2970M MS-16GD Intel Celeron 2970M 2.2GHz
HD Graphics (Haswell)
min:
54 fps
fps
100%
HD Graphics (Haswell):
28.6 [X] MSI CX61 2QC 2970M MS-16GD Intel Celeron 2970M 2.2GHz
HD Graphics (Haswell)
min:
19 fps
fps
100%
HD Graphics (Haswell):
16.4 [X] MSI CX61 2QC 2970M MS-16GD Intel Celeron 2970M 2.2GHz
HD Graphics (Haswell)
min:
14 fps, max:
19 fps
fps
100%
HD Graphics (Haswell):
45.1 [X] MSI CX61 2QC 2970M MS-16GD Intel Celeron 2970M 2.2GHz
HD Graphics (Haswell)
min:
37 fps, max:
54 fps
fps
100%
HD Graphics (Haswell):
15.9 [X] MSI CX61 2QC 2970M MS-16GD Intel Celeron 2970M 2.2GHz
HD Graphics (Haswell)
min:
13 fps, max:
19 fps
fps
HD Graphics (Haswell):
0 (!) [X] MSI CX61 2QC 2970M MS-16GD Intel Celeron 2970M 2.2GHz
HD Graphics (Haswell)
fps
100%
HD Graphics (Haswell):
17.8 [X] MSI CX61 2QC 2970M MS-16GD Intel Celeron 2970M 2.2GHz
HD Graphics (Haswell)
min:
15 fps, max:
21 fps
fps
100%
HD Graphics (Haswell):
38.6 [X] MSI CX61 2QC 2970M MS-16GD Intel Celeron 2970M 2.2GHz
HD Graphics (Haswell)
min:
35 fps, max:
52 fps
fps
100%
HD Graphics (Haswell):
21.6 [X] MSI CX61 2QC 2970M MS-16GD Intel Celeron 2970M 2.2GHz
HD Graphics (Haswell)
min:
19 fps, max:
28 fps
fps
100%
HD Graphics (Haswell):
6.3 [X] MSI CX61 2QC 2970M MS-16GD Intel Celeron 2970M 2.2GHz
HD Graphics (Haswell)
min:
5 fps, max:
8 fps
fps
100%
HD Graphics (Haswell):
14.1 [X] MSI CX61 2QC 2970M MS-16GD Intel Celeron 2970M 2.2GHz
HD Graphics (Haswell)
min:
12 fps, max:
15 fps
fps
100%
HD Graphics (Haswell):
12.4 [X] MSI CX61 2QC 2970M MS-16GD Intel Celeron 2970M 2.2GHz
HD Graphics (Haswell)
min:
11 fps, max:
14 fps
fps
100%
HD Graphics (Haswell):
7.1 [X] MSI CX61 2QC 2970M MS-16GD Intel Celeron 2970M 2.2GHz
HD Graphics (Haswell)
min:
6 fps, max:
8 fps
fps
100%
HD Graphics (Haswell):
26.1 [X] MSI CX61 2QC 2970M MS-16GD Intel Celeron 2970M 2.2GHz
HD Graphics (Haswell)
min:
19 fps, max:
33 fps
fps
100%
HD Graphics (Haswell):
16.3 [X] MSI CX61 2QC 2970M MS-16GD Intel Celeron 2970M 2.2GHz
HD Graphics (Haswell)
min:
12 fps, max:
21 fps
fps
HD Graphics (Haswell):
0 (!) [X] MSI CX61 2QC 2970M MS-16GD Intel Celeron 2970M 2.2GHz
HD Graphics (Haswell)
fps
100%
HD Graphics (Haswell):
6 [X] MSI CX61 2QC 2970M MS-16GD Intel Celeron 2970M 2.2GHz
HD Graphics (Haswell)
min:
3 fps, max:
9 fps
fps
100%
HD Graphics (Haswell):
8.5 [X] MSI CX61 2QC 2970M MS-16GD Intel Celeron 2970M 2.2GHz
HD Graphics (Haswell)
min:
6 fps, max:
11 fps
fps
100%
HD Graphics (Haswell):
9 [X] MSI CX61 2QC 2970M MS-16GD Intel Celeron 2970M 2.2GHz
HD Graphics (Haswell)
min:
8 fps, max:
11 fps
fps
100%
HD Graphics (Haswell):
9.4 [X] MSI CX61 2QC 2970M MS-16GD Intel Celeron 2970M 2.2GHz
HD Graphics (Haswell)
min:
8 fps, max:
11 fps
fps
100%
HD Graphics (Haswell):
5.3 [X] MSI CX61 2QC 2970M MS-16GD Intel Celeron 2970M 2.2GHz
HD Graphics (Haswell)
fps
100%
HD Graphics (Haswell):
2.5 [X] MSI CX61 2QC 2970M MS-16GD Intel Celeron 2970M 2.2GHz
HD Graphics (Haswell)
fps
100%
HD Graphics (Haswell):
1.8 [X] MSI CX61 2QC 2970M MS-16GD Intel Celeron 2970M 2.2GHz
HD Graphics (Haswell)
fps
100%
HD Graphics (Haswell):
13.7 [X] MSI CX61 2QC 2970M MS-16GD Intel Celeron 2970M 2.2GHz
HD Graphics (Haswell)
min:
5 fps, max:
75 fps
fps
100%
HD Graphics (Haswell):
8.9 [X] MSI CX61 2QC 2970M MS-16GD Intel Celeron 2970M 2.2GHz
HD Graphics (Haswell)
min:
4 fps, max:
65 fps
fps
100%
HD Graphics (Haswell):
11.7 [X] MSI CX61 2QC 2970M MS-16GD Intel Celeron 2970M 2.2GHz
HD Graphics (Haswell)
min:
10 fps, max:
14 fps
fps
HD Graphics (Haswell):
0 (!) [X] MSI CX61 2QC 2970M MS-16GD Intel Celeron 2970M 2.2GHz
HD Graphics (Haswell)
fps
HD Graphics (Broadwell):
15.3 fps
HD Graphics (Broadwell):
8.5 fps
HD Graphics (Broadwell):
38.1 fps
HD Graphics (Broadwell):
20.6 fps
100%
HD Graphics (Haswell):
41.4 [X] MSI CX61 2QC 2970M MS-16GD Intel Celeron 2970M 2.2GHz
HD Graphics (Haswell)
min:
21 fps, max:
51 fps
fps
41%
HD Graphics (Braswell):
16.8 fps
70%
HD Graphics (Broadwell):
29 fps
100%
HD Graphics (Haswell):
24.1 [X] MSI CX61 2QC 2970M MS-16GD Intel Celeron 2970M 2.2GHz
HD Graphics (Haswell)
min:
11 fps, max:
35 fps
fps
49%
HD Graphics (Braswell):
11.9 fps
86%
HD Graphics (Broadwell):
20.8 fps
100%
HD Graphics (Haswell):
11.4 [X] MSI CX61 2QC 2970M MS-16GD Intel Celeron 2970M 2.2GHz
HD Graphics (Haswell)
min:
5 fps, max:
18 fps
fps
HD Graphics (Braswell):
13.7 fps
HD Graphics (Braswell):
9.5 fps
100%
HD Graphics (Haswell):
8.9 [X] MSI CX61 2QC 2970M MS-16GD Intel Celeron 2970M 2.2GHz
HD Graphics (Haswell)
min:
5 fps, max:
12 fps
fps
100%
HD Graphics (Haswell):
5.2 [X] MSI CX61 2QC 2970M MS-16GD Intel Celeron 2970M 2.2GHz
HD Graphics (Haswell)
min:
3 fps, max:
8 fps
5.8 ~ 6 fps
100%
HD Graphics (Haswell):
3.1 fps
100%
HD Graphics (Haswell):
52.4 fps
52%
HD Graphics (Braswell):
27.2 fps
95%
HD Graphics (Broadwell):
50 fps
100%
HD Graphics (Haswell):
12.8 fps
55%
HD Graphics (Braswell):
7.1 fps
105%
HD Graphics (Broadwell):
13.5 fps
100%
HD Graphics (Haswell):
15.9 fps
83%
HD Graphics (Braswell):
13.2 fps
150%
HD Graphics (Broadwell):
23.9 fps
100%
HD Graphics (Haswell):
11.2 fps
78%
HD Graphics (Braswell):
8.7 fps
146%
HD Graphics (Broadwell):
16.4 fps
100%
HD Graphics (Haswell):
7.7 fps
70%
HD Graphics (Braswell):
5.4 fps
100%
HD Graphics (Haswell):
5.7 fps
68%
HD Graphics (Braswell):
3.9 fps
100%
HD Graphics (Haswell):
9.7 fps
100%
HD Graphics (Haswell):
8.4 fps
100%
HD Graphics (Haswell):
10.9 fps
75%
HD Graphics (Braswell):
8.2 fps
128%
HD Graphics (Broadwell):
13.9 fps
100%
HD Graphics (Haswell):
7 fps
87%
HD Graphics (Braswell):
6.1 fps
134%
HD Graphics (Broadwell):
9.4 fps
HD Graphics (Braswell):
6.1 fps
HD Graphics (Braswell):
4.3 fps
HD Graphics (Braswell):
6 fps
HD Graphics (Braswell):
3.2 fps
100%
HD Graphics (Haswell):
31 fps
42%
HD Graphics (Braswell):
13 13 ~ 13 fps
110%
HD Graphics (Broadwell):
34 fps
100%
HD Graphics (Haswell):
20 fps
60%
HD Graphics (Braswell):
12 12.5 ~ 12 fps
120%
HD Graphics (Broadwell):
24 fps
100%
HD Graphics (Haswell):
9 fps
100%
HD Graphics (Haswell):
5.8 fps
100%
HD Graphics (Haswell):
21.6 fps
63%
HD Graphics (Braswell):
13.7 fps
100%
HD Graphics (Haswell):
12.9 fps
68%
HD Graphics (Braswell):
8.8 fps
100%
HD Graphics (Haswell):
13.5 fps
100%
HD Graphics (Haswell):
8.3 fps
100%
HD Graphics (Haswell):
16.4 fps
100%
HD Graphics (Haswell):
11.3 fps
100%
HD Graphics (Haswell):
123.6 fps
52%
HD Graphics (Braswell):
64 fps
92%
HD Graphics (Broadwell):
113.6 fps
100%
HD Graphics (Haswell):
26.2 fps
71%
HD Graphics (Braswell):
18.7 fps
100%
HD Graphics (Broadwell):
26.3 fps
100%
HD Graphics (Haswell):
13.3 fps
59%
HD Graphics (Braswell):
7.9 fps
100%
HD Graphics (Haswell):
9.7 fps
58%
HD Graphics (Braswell):
5.6 fps
100%
HD Graphics (Haswell):
58.2 fps
40%
HD Graphics (Braswell):
23 fps
99%
HD Graphics (Broadwell):
57.6 fps
100%
HD Graphics (Haswell):
19.6 fps
64%
HD Graphics (Braswell):
12.5 fps
115%
HD Graphics (Broadwell):
22.6 fps
100%
HD Graphics (Haswell):
2.2 fps
100%
HD Graphics (Haswell):
19.9 fps
100%
HD Graphics (Haswell):
14 fps
100%
HD Graphics (Haswell):
35.2 fps
100%
HD Graphics (Haswell):
13.6 fps
100%
HD Graphics (Haswell):
9 fps
100%
HD Graphics (Haswell):
23.1 fps
100%
HD Graphics (Haswell):
13.7 fps
100%
HD Graphics (Haswell):
10.1 fps
100%
HD Graphics (Haswell):
5.7 fps
100%
HD Graphics (Haswell):
22.1 fps
100%
HD Graphics (Haswell):
13 fps
100%
HD Graphics (Haswell):
11.1 fps
100%
HD Graphics (Haswell):
12.8 27.8 [X] MSI CX61 2QC 2970M MS-16GD Intel Celeron 2970M 2.2GHz
HD Graphics (Haswell)
~ 20 fps
100%
HD Graphics (Haswell):
10 18.2 [X] MSI CX61 2QC 2970M MS-16GD Intel Celeron 2970M 2.2GHz
HD Graphics (Haswell)
~ 14 fps
100%
HD Graphics (Haswell):
11.8 [X] MSI CX61 2QC 2970M MS-16GD Intel Celeron 2970M 2.2GHz
HD Graphics (Haswell)
fps
100%
HD Graphics (Haswell):
3.9 [X] MSI CX61 2QC 2970M MS-16GD Intel Celeron 2970M 2.2GHz
HD Graphics (Haswell)
fps
100%
HD Graphics (Haswell):
21 fps
100%
HD Graphics (Haswell):
12 fps
100%
HD Graphics (Haswell):
27 fps
100%
HD Graphics (Haswell):
18 fps
100%
HD Graphics (Haswell):
14 fps
100%
HD Graphics (Haswell):
57.7 fps
100%
HD Graphics (Haswell):
37 fps
100%
HD Graphics (Haswell):
22.4 fps
100%
HD Graphics (Haswell):
16.9 fps
100%
HD Graphics (Haswell):
14 fps
27%
HD Graphics (Braswell):
3.8 fps
100%
HD Graphics (Haswell):
7.8 fps
27%
HD Graphics (Braswell):
2.1 fps
100%
HD Graphics (Haswell):
15.9 fps
100%
HD Graphics (Haswell):
8.9 fps
100%
HD Graphics (Haswell):
14.2 fps
100%
HD Graphics (Haswell):
11.5 fps
100%
HD Graphics (Haswell):
36.9 fps
100%
HD Graphics (Haswell):
24.2 fps
100%
HD Graphics (Haswell):
7.2 fps
100%
HD Graphics (Haswell):
38 38.5 ~ 38 fps
51%
HD Graphics (Braswell):
19.2 fps
100%
HD Graphics (Haswell):
18.6 19.6 ~ 19 fps
66%
HD Graphics (Braswell):
12.6 fps
100%
HD Graphics (Haswell):
13.2 fps
95%
HD Graphics (Braswell):
12.5 fps
100%
HD Graphics (Haswell):
11.2 fps
122%
HD Graphics (Broadwell):
13.7 fps
HD Graphics (Broadwell):
10.7 fps
HD Graphics (Broadwell):
7 fps
100%
HD Graphics (Haswell):
23 32.8 [X] MSI CX61 2QC 2970M MS-16GD Intel Celeron 2970M 2.2GHz
HD Graphics (Haswell)
~ 28 fps
90%
HD Graphics (Broadwell):
25.3 fps
100%
HD Graphics (Haswell):
10.3 14.2 [X] MSI CX61 2QC 2970M MS-16GD Intel Celeron 2970M 2.2GHz
HD Graphics (Haswell)
~ 12 fps
118%
HD Graphics (Broadwell):
14.1 fps
100%
HD Graphics (Haswell):
11.9 [X] MSI CX61 2QC 2970M MS-16GD Intel Celeron 2970M 2.2GHz
HD Graphics (Haswell)
fps
98%
HD Graphics (Broadwell):
11.7 fps
100%
HD Graphics (Haswell):
3.7 [X] MSI CX61 2QC 2970M MS-16GD Intel Celeron 2970M 2.2GHz
HD Graphics (Haswell)
fps
100%
HD Graphics (Haswell):
96.5 fps
100%
HD Graphics (Haswell):
28.3 fps
100%
HD Graphics (Haswell):
15 fps
100%
HD Graphics (Haswell):
59.6 fps
100%
HD Graphics (Haswell):
11.2 fps
116%
HD Graphics (Broadwell):
34.7 fps
126%
HD Graphics (Broadwell):
17.7 fps
146%
HD Graphics (Broadwell):
11.7 fps
100%
HD Graphics (Haswell):
12.2 fps
76%
HD Graphics (Braswell):
9.3 fps
100%
HD Graphics (Haswell):
7.6 fps
75%
HD Graphics (Braswell):
5.7 fps
HD Graphics (Braswell):
2.1 fps
100%
HD Graphics (Haswell):
38.7 fps
74%
HD Graphics (Braswell):
28.6 fps
100%
HD Graphics (Haswell):
17.7 fps
73%
HD Graphics (Braswell):
13 fps
100%
HD Graphics (Haswell):
13.1 fps
76%
HD Graphics (Braswell):
9.9 fps
100%
HD Graphics (Haswell):
18.7 fps
100%
HD Graphics (Haswell):
11.4 fps
100%
HD Graphics (Haswell):
12.3 fps
127%
HD Graphics (Broadwell):
15.6 fps
100%
HD Graphics (Haswell):
9.9 fps
115%
HD Graphics (Broadwell):
11.4 fps
HD Graphics (Broadwell):
5.3 fps
100%
HD Graphics (Haswell):
25.6 fps
100%
HD Graphics (Haswell):
17.6 fps
100%
HD Graphics (Haswell):
22.3 fps
67%
HD Graphics (Braswell):
15 fps
100%
HD Graphics (Haswell):
16.8 fps
71%
HD Graphics (Braswell):
12 fps
HD Graphics (Braswell):
11.3 fps
100%
HD Graphics (Haswell):
46.2 fps
26%
HD Graphics (Braswell):
12.2 fps
95%
HD Graphics (Broadwell):
43.7 fps
100%
HD Graphics (Haswell):
34.7 fps
33%
HD Graphics (Braswell):
11.5 fps
91%
HD Graphics (Broadwell):
31.5 fps
100%
HD Graphics (Haswell):
22.5 fps
46%
HD Graphics (Braswell):
10.4 fps
106%
HD Graphics (Broadwell):
23.9 fps
100%
HD Graphics (Haswell):
31 fps
100%
HD Graphics (Haswell):
18.8 fps
100%
HD Graphics (Haswell):
11.7 fps
100%
HD Graphics (Haswell):
36.9 fps
69%
HD Graphics (Braswell):
25.5 fps
104%
HD Graphics (Broadwell):
38.4 fps
100%
HD Graphics (Haswell):
23 fps
73%
HD Graphics (Braswell):
16.7 fps
108%
HD Graphics (Broadwell):
24.9 fps
100%
HD Graphics (Haswell):
19.5 fps
68%
HD Graphics (Braswell):
13.2 fps
101%
HD Graphics (Broadwell):
19.7 fps
100%
HD Graphics (Haswell):
12.5 fps
100%
HD Graphics (Haswell):
36 fps
81%
HD Graphics (Braswell):
28 30 ~ 29 fps
100%
HD Graphics (Haswell):
16 fps
81%
HD Graphics (Braswell):
12.7 13.1 ~ 13 fps
100%
HD Graphics (Haswell):
9.8 fps
83%
HD Graphics (Braswell):
8.1 fps
100%
HD Graphics (Haswell):
21.7 22.2 ~ 22 fps
75%
HD Graphics (Braswell):
16.5 fps
100%
HD Graphics (Haswell):
11.2 11.3 ~ 11 fps
75%
HD Graphics (Braswell):
8.2 fps
100%
HD Graphics (Haswell):
6.8 fps
74%
HD Graphics (Braswell):
5 fps
100%
HD Graphics (Haswell):
36.8 fps
76%
HD Graphics (Braswell):
28 fps
100%
HD Graphics (Haswell):
16.7 fps
83%
HD Graphics (Braswell):
13.9 fps
100%
HD Graphics (Haswell):
51.9 fps
100%
HD Graphics (Haswell):
27.4 fps
100%
HD Graphics (Haswell):
14.8 fps
100%
HD Graphics (Haswell):
49.2 fps
100%
HD Graphics (Haswell):
28 fps
24%
HD Graphics (Braswell):
6.7 fps
100%
HD Graphics (Haswell):
21.2 fps
20%
HD Graphics (Braswell):
4.2 fps
HD Graphics (Braswell):
2.1 fps
100%
HD Graphics (Haswell):
42.6 fps
100%
HD Graphics (Haswell):
17.8 fps
100%
HD Graphics (Haswell):
113 fps
100%
HD Graphics (Haswell):
45.1 fps
100%
HD Graphics (Haswell):
93.7 fps
100%
HD Graphics (Haswell):
39.2 fps
Average Gaming Intel HD Graphics (Haswell) → 100% Average Gaming 30-70 fps → 100%
Average Gaming Intel HD Graphics (Braswell) → 64% Average Gaming 30-70 fps → 52%
Average Gaming Intel HD Graphics (Broadwell) → 111% Average Gaming 30-70 fps → 101%
Intel HD Graphics (Broadwell) low med. high ultra QHD 4K Star Wars Battlefront 15.3 8.5 FIFA 16 38.1 20.6 World of Warships 29 20.8 Dirt Rally 50 13.5 Battlefield Hardline 23.9 16.4 Dragon Age: Inquisition 13.9 9.4 F1 2014 34 24 Sims 4 113.6 26.3 GRID: Autosport 57.6 22.6 Metro: Last Light 13.7 10.7 7 BioShock Infinite 25.3 14.1 11.7 Tomb Raider 34.7 17.7 11.7 Hitman: Absolution 15.6 11.4 5.3 Counter-Strike: GO 43.7 31.5 23.9 Diablo III 38.4 24.9 19.7 < 30 fps < 60 fps < 120 fps ≥ 120 fps 7 7 1 13 1 7
v1.26
log 01. 17:38:51
#0 checking url part for id 4622 +0s ... 0s
#1 checking url part for id 6273 +0s ... 0s
#2 checking url part for id 5979 +0s ... 0s
#3 not redirecting to Ajax server +0s ... 0s
#4 did not recreate cache, as it is less than 5 days old! Created at Wed, 01 May 2024 05:36:19 +0200 +0.001s ... 0.001s
#5 composed specs +0.196s ... 0.197s
#6 did output specs +0s ... 0.198s
#7 start showIntegratedCPUs +0s ... 0.198s
#8 getting avg benchmarks for device 4622 +0.055s ... 0.252s
#9 got single benchmarks 4622 +0.04s ... 0.292s
#10 getting avg benchmarks for device 6273 +0.012s ... 0.303s
#11 got single benchmarks 6273 +0.081s ... 0.384s
#12 getting avg benchmarks for device 5979 +0.013s ... 0.398s
#13 got single benchmarks 5979 +0.015s ... 0.412s
#14 got avg benchmarks for devices +0s ... 0.412s
#15 min, max, avg, median took s +0.325s ... 0.737s
#16 before gaming benchmark output +0s ... 0.737s
#17 Got 316 rows for game benchmarks. +0.027s ... 0.765s
#18 composed SQL query for gamebenchmarks +0s ... 0.765s
#19 got data and put it in $dataArray +0.059s ... 0.824s
#20 benchmarks composed for output. +0.193s ... 1.017s
#21 calculated avg scores. +0s ... 1.017s
#22 return log +0.003s ... 1.02s
Teilen Sie diesen Artikel, um uns zu unterstützen. Jeder Link hilft!
Autor: Klaus Hinum, 8.09.2017 (Update: 1.07.2023)
 Deutsch
 English
 Español
 Français
 Italiano
 Nederlands
 Polski
 Português
 Русский
 Türkçe
 Svenska
 Chinese
 Magyar