NVIDIA GeForce GTX 1660 Ti Max-Q vs NVIDIA GeForce RTX 2070 Super Mobile
NVIDIA GeForce GTX 1660 Ti Max-Q ► remove from comparison
Die Nvidia GeForce GTX 1660 Ti mit Max-Q Design für Laptops ist eine mobile Grafikkarte basierend auf der Turing Architektur. Sie ist gedacht für dünne und leichte Notebook und je nach Kühlungsdesign etwa 10-15% langsamer als eine normale GTX 1660 Ti für Laptops (22% geringerer Basis-Takt und 16% geringerer Boost-Takt). Sie basiert wie die Desktop-Version auf den TU116 Chip und wurde Ende April 2019 vorgestellt. Die GTX 1660 Serie bietet im Unterschied zu den stärkeren RTX 2000er Karten (z.B. RTX 2060 ) keine Raytracing und Tensor Kerne. Die Leistung sollte vergleichbar mit einer GTX 1070 Max-Q sein, jedoch bei deutlich geringerem Stromverbrauch von 60 Watt TGP (versus 80 Watt der Laptop 1660 Ti und 115 Watt der Desktop-Version).
Im April 2020 gab es einen Refresh der GeFroce GTX 1660 Ti Max-Q mit dem Codenamen N18E-G0-A1. Die Specs bleiben aber vergleichbar, der Chip ist im selben Package erhältlich wie die neuen RTX Chips (z.b. RTX 2070 Super ).
Bei der Turing Architektur gab es auch auf der Ebene der CUDA-Kerne deutliche Verbesserungen. Float und INT Operationen können nun gleichzeitig ausgeführt werden, der Cache wurde vereinheitlicht und verbessert und Adaptive Shading eingeführt. Nvidia spricht dadurch von einer bis zu 50% höheren Leistung pro Kern im Vergleich zu Pascal.
Der Stromverbrauch ist mit 60 Watt TGP (Total Graphics Power) von Nvidia spezifiziert und damit 20 Watt unterhalb der normalen (Max-P) Version . Dadurch eignet sich die GPU auch für dünnere Gaming-Laptops. Der verbaute TU116 Chip wird bei TSMC im 12nm FFN Verfahren gefertigt.
NVIDIA GeForce RTX 2070 Super Mobile ► remove from comparison
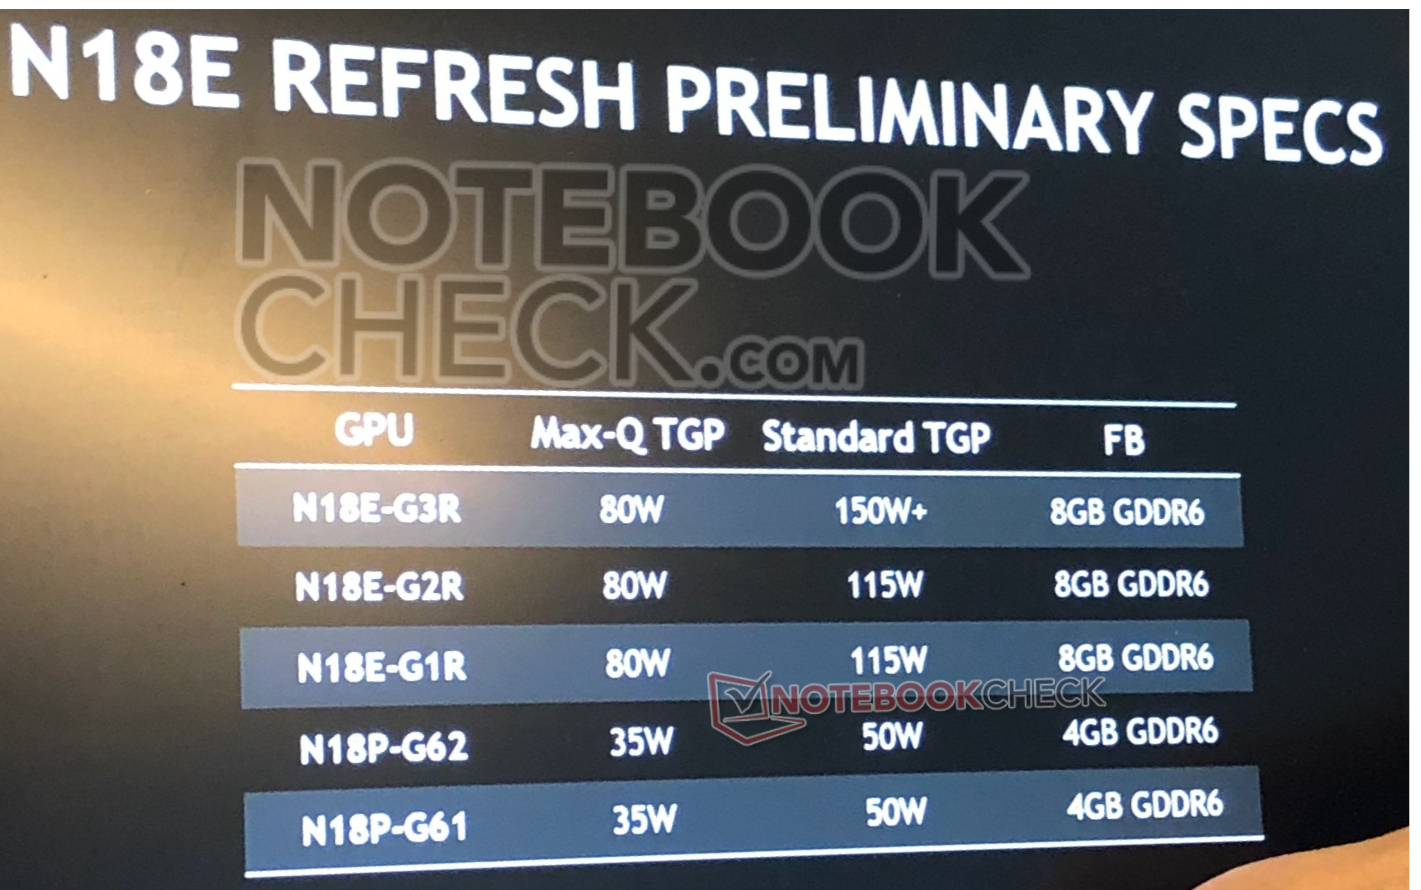
Die Nvidia GeForce RTX 2070 Super Mobile (für Laptops) ist nach der mobilen RTX 2080 und 2080 Super die drittschnellste mobile Grafikkarte in 2020. Sie basiert auf die Desktop RTX 2070 Super jedoch werden die Shader wahrscheinlich deutlich niedriger getaktet.
Die GPU trägt den Codenamen N18-G2R (für Refresh) und schafft in ersten Benchmarks eine 10% höhere Leistung als die alte GeForce RTX 2070 Mobile .
Features
Der TU106-Chip wird in 12nm gefertigt und bietet eine Reihe neuer Features, wie DLSS (Deep Learning Super Sampling) und Real Time Ray Tracing. Dadurch lassen sich vor allem Beleuchtungseffekte sehr viel realistischer darstellen. Weiterhin gibt es Support für DisplayPort 1.4 (ready), HDMI 2.0b, HDR, Simultaneous Multi-Projection (SMP) sowie H.265 Video De- und Encoding (PlayReady 3.0).
Performance
Die Performance der mobilen GeForce RTX 2070 Super Mobile sollte etwas unterhalb der Desktop RTX 2070 liegen und in etwa auf dem Niveau der mobilen GTX 1080 . Damit ordnet sich die RTX 2070 Super im absoluten High-End-Segment ein und kann die meisten Spiele des Jahres 2019 in hohen Einstellungen und 4K-Auflösung flüssig darstellen.
Der Stromverbrauch der normalen (Max-P) Notebook-Grafikkarte ist mit 115 Watt von Nvidia spezifiziert und damit 35 Watt höher als bei der Max-Q Version.
NVIDIA GeForce GTX 1660 Ti Max-Q NVIDIA GeForce RTX 2070 Super Mobile GeForce RTX 2000 Serie Codename N18E-G0 N18E-G2R Architektur Turing Turing Pipelines 1536 - unified 2560 - unified Kerntakt 1140 - 1335 (Boost) MHz 1140 - 1380 (Boost) MHz Speichertakt 12000 MHz 14002 MHz Speicherbandbreite 192 Bit 256 Bit Speichertyp GDDR6 GDDR6 Max. Speichergröße 6 GB 8 GB Shared Memory nein nein API DirectX 12_1, OpenGL 4.6 DirectX 12_1, OpenGL 4.6 Stromverbrauch 60 Watt 115 Watt Herstellungsprozess 12 nm 12 nm Notebookgröße mittel (15.4" z.B.) groß (17" z.B.) Erscheinungsdatum 23.04.2019 02.04.2020 Herstellerseite www.nvidia.com Features DLSS, Raytraycing, VR Ready, G-SYNC, Vulkan, Multi Monitor, 550 Watt system power recommended
Benchmarks Performance Rating - 3DMark 11 + Fire Strike + Time Spy - GeForce GTX 1660 Ti Max-Q
6.1 pt (18%)
...
NVIDIA GeForce GTX 1660 Ti Max-Q
...
max:
3DMark - 3DMark Time Spy Score
min: 4547 avg: 5197 median: 5072 (15%) max: 6395 Points
min: 7943 avg: 8292 median: 8315.5 (24%) max: 8602 Points
GPU TDP ? TDP 113 W TDP 115 W 84% 97% 100%
3DMark - 3DMark Time Spy Graphics
min: 4867 avg: 5089 median: 5084.5 (13%) max: 5440 Points
min: 7840 avg: 8238 median: 8272 (22%) max: 8657 Points
GPU TDP ? TDP 113 W TDP 115 W 83% 100% 100%
3DMark - 3DMark Ice Storm Unlimited Graphics
min: 220799 avg: 314100 median: 306910 (35%) max: 414592 Points
min: 446705 avg: 471516 median: 481195 (55%) max: 486649 Points
GPU TDP ? TDP 113 W TDP 115 W 71% 99% 100%
3DMark - 3DMark Ice Storm Extreme Graphics
min: 76153 avg: 110626 median: 110626 (14%) max: 145099 Points
3DMark - 3DMark Cloud Gate Score
min: 16807 avg: 29350 median: 33027 (35%) max: 39942 Points
min: 39220 avg: 45009 median: 46745 (50%) max: 50766 Points
GPU TDP ? TDP 113 W TDP 115 W 92% 98% 100%
3DMark - 3DMark Cloud Gate Graphics
min: 38321 avg: 63736 median: 63086 (17%) max: 89505 Points
min: 75986 avg: 121959 median: 126287 (33%) max: 141778 Points
GPU TDP ? TDP 113 W TDP 115 W 74% 100% 61%
3DMark - 3DMark Fire Strike Standard Score
min: 10103 avg: 11548 median: 11615 (20%) max: 12739 Points
min: 14771 avg: 18634 median: 18919.5 (33%) max: 19884 Points
GPU TDP ? TDP 113 W TDP 115 W 86% 100% 91%
3DMark - 3DMark Fire Strike Standard Graphics
min: 12903 avg: 13356 median: 13355 (15%) max: 13870 Points
min: 18662 avg: 21824 median: 22016 (25%) max: 23042 Points
GPU TDP ? TDP 113 W TDP 115 W 85% 100% 93%
3DMark - 3DMark Ice Storm Graphics
min: 59373 avg: 104094 median: 86295 (10%) max: 166615 Points
3DMark - 3DMark Wild Life Unlimited
51350 Points (26%)
3DMark 11 - 3DM11 Performance Score
min: 12279 avg: 15364 median: 15913 (22%) max: 17377 Points
min: 20961 avg: 23775 median: 24028.5 (33%) max: 25360 Points
GPU TDP ? TDP 113 W TDP 115 W 81% 87% 100%
3DMark 11 - 3DM11 Performance GPU
min: 17010 avg: 17711 median: 17439 (15%) max: 18653 Points
min: 28207 avg: 29416 median: 29092.5 (25%) max: 31050 Points
GPU TDP ? TDP 113 W TDP 115 W 79% 100% 98%
3DMark Vantage + NVIDIA GeForce GTX 1660 Ti Max-Q 3DMark Vantage - 3DM Vant. Perf. total
31845 Points (9%)
3DM Vant. Perf. total + NVIDIA GeForce RTX 2070 Super Mobile
70601 Points (20%)
3DM Vant. Perf. GPU no PhysX + NVIDIA GeForce GTX 1660 Ti Max-Q 3DMark Vantage - 3DM Vant. Perf. GPU no PhysX
34951 Points (20%)
3DM Vant. Perf. GPU no PhysX + NVIDIA GeForce RTX 2070 Super Mobile
75429 Points (43%)
3DMark 06 3DMark 06 - Standard 1280x1024 + NVIDIA GeForce GTX 1660 Ti Max-Q
min: 24029 avg: 28247 median: 25211 (33%) max: 38536 Points
3DMark 06 - Standard 1280x1024 + NVIDIA GeForce RTX 2070 Super Mobile
43041 Points (56%)
SPECviewperf 13 specvp13 sw-04 + NVIDIA GeForce RTX 2070 Super Mobile SPECviewperf 13 - specvp13 sw-04
91.2 fps (24%)
specvp13 snx-03 + NVIDIA GeForce RTX 2070 Super Mobile SPECviewperf 13 - specvp13 snx-03
20.1 fps (2%)
specvp13 showcase-02 + NVIDIA GeForce RTX 2070 Super Mobile SPECviewperf 13 - specvp13 showcase-02
112.1 fps (24%)
specvp13 medical-02 + NVIDIA GeForce RTX 2070 Super Mobile SPECviewperf 13 - specvp13 medical-02
56.3 fps (12%)
specvp13 maya-05 + NVIDIA GeForce RTX 2070 Super Mobile SPECviewperf 13 - specvp13 maya-05
225 fps (26%)
specvp13 energy-02 + NVIDIA GeForce RTX 2070 Super Mobile SPECviewperf 13 - specvp13 energy-02
21.6 fps (7%)
specvp13 creo-02 + NVIDIA GeForce RTX 2070 Super Mobile SPECviewperf 13 - specvp13 creo-02
177.5 fps (26%)
specvp13 catia-05 + NVIDIA GeForce RTX 2070 Super Mobile SPECviewperf 13 - specvp13 catia-05
137.6 fps (15%)
specvp13 3dsmax-06 + NVIDIA GeForce RTX 2070 Super Mobile SPECviewperf 13 - specvp13 3dsmax-06
188.7 fps (33%)
Cinebench R10 Cinebench R10 Shading (32bit) + NVIDIA GeForce GTX 1660 Ti Max-Q Cinebench R10 - Cinebench R10 Shading (32bit)
min: 6820 avg: 9290 median: 8562.5 (6%) max: 13213 Points
Cinebench R11.5 Cinebench R11.5 OpenGL 64 Bit + NVIDIA GeForce GTX 1660 Ti Max-Q Cinebench R11.5 - Cinebench R11.5 OpenGL 64 Bit
min: 49.83 avg: 59.5 median: 59.5 (21%) max: 69.2 fps
Cinebench R15 + NVIDIA GeForce GTX 1660 Ti Max-Q Cinebench R15 - Cinebench R15 OpenGL 64 Bit
min: 78.2 avg: 100.5 median: 96.9 (6%) max: 130.7 fps
Cinebench R15 OpenGL 64 Bit + NVIDIA GeForce RTX 2070 Super Mobile
min: 130 avg: 141 median: 142.1 (8%) max: 154 fps
GPU TDP ? TDP 113 W TDP 115 W 79% 96% 100%
Cinebench R15 OpenGL Ref. Match 64 Bit + NVIDIA GeForce GTX 1660 Ti Max-Q Cinebench R15 - Cinebench R15 OpenGL Ref. Match 64 Bit
99.6 % (100%)
Cinebench R15 OpenGL Ref. Match 64 Bit + NVIDIA GeForce RTX 2070 Super Mobile
99.6 % (100%)
GPU TDP ? TDP 113 W TDP 115 W 100% 100% 100%
GFXBench - GFXBench 5.0 Aztec Ruins High Tier Offscreen
110.2 fps (20%)
GFXBench - GFXBench 5.0 Aztec Ruins Normal Tier Offscreen
253.8 fps (19%)
GFXBench - GFXBench Car Chase Offscreen
227.4 fps (26%)
402.6 fps (45%)
GFXBench 3.1 - GFXBench Manhattan ES 3.1 Offscreen
345.8 fps (7%)
GFXBench 3.0 - GFXBench 3.0 Manhattan Offscreen
360.6 fps (21%)
GFXBench (DX / GLBenchmark) 2.7 + NVIDIA GeForce GTX 1660 Ti Max-Q GFXBench (DX / GLBenchmark) 2.7 - GFXBench T-Rex HD Offscreen C24Z16
943 fps (8%)
LuxMark v2.0 64Bit - LuxMark v2.0 Room GPU
2141 Samples/s (10%)
LuxMark v2.0 64Bit - LuxMark v2.0 Sala GPU
4254 Samples/s (7%)
ComputeMark v2.1 - ComputeMark v2.1 Result
10027 Points (11%)
15586 Points (17%)
Power Consumption - Furmark Stress Test Power Consumption - external Monitor *
min: 77.6 avg: 86.3 median: 86.3 (12%) max: 95 Watt
175 Watt (25%)
GPU TDP ? TDP 115 W 117% 100%
Power Consumption - The Witcher 3 Power Consumption - external Monitor *
min: 92 avg: 96.6 median: 96.6 (13%) max: 101.2 Watt
Power Consumption - Witcher 3 Power Consumption *
min: 94.2 avg: 104.8 median: 106.9 (24%) max: 121 Watt
min: 175 avg: 190.3 median: 190.5 (42%) max: 201 Watt
GPU TDP ? TDP 113 W 117% 100%
Power Consumption - Witcher 3 ultra Power Efficiency
min: 0.4388 avg: 0.5 median: 0.5 (43%) max: 0.537 fps per Watt
min: 0.4264 avg: 0.4 median: 0.4 (40%) max: 0.472 fps per Watt
GPU TDP ? TDP 113 W 99% 100%
Power Consumption - Witcher 3 ultra Power Efficiency - external Monitor
min: 0.4822 avg: 0.5 median: 0.5 (44%) max: 0.578 fps per Watt
Emissions Witcher 3 Fan Noise + NVIDIA GeForce GTX 1660 Ti Max-Q Emissions - Witcher 3 Fan Noise
min: 34 avg: 43.4 median: 43.7 (70%) max: 53.8 dB(A)
Witcher 3 Fan Noise + NVIDIA GeForce RTX 2070 Super Mobile
min: 50 avg: 53.4 median: 54 (86%) max: 57.5 dB(A)
GPU TDP ? TDP 113 W 96% 100%
Clock Speed - GPU Clock Witcher 3 ultra
1501 MHz (59%)
min: 1425 avg: 1479 median: 1455 (57%) max: 1560 MHz
GPU TDP ? TDP 113 W 97% 100%
Clock Speed - GPU Clock Speed Furmark
1062 MHz (42%)
1148 MHz (45%)
GPU TDP ? TDP 115 W 93% 100%
Average Benchmarks NVIDIA GeForce GTX 1660 Ti Max-Q → 100% n=18 Average Benchmarks NVIDIA GeForce RTX 2070 Super Mobile → 159% n=18
- Bereich der Benchmarkergebnisse für diese Grafikkarte
- Durchschnittliche Benchmarkergebnisse für diese Grafikkarte
* Smaller numbers mean a higher performance
1 This benchmark is not used for the average calculation
Spiele-Benchmarks Die folgenden Benchmarks basieren auf unseren Spieletests mit Testnotebooks. Die Performance dieser Grafikkarte bei den gelisteten Spielen ist abhängig von der verwendeten CPU, Speicherausstattung, Treiber und auch Betriebssystem. Dadurch müssen die untenstehenden Werte nicht repräsentativ sein. Detaillierte Informationen über das verwendete System sehen Sie nach einem Klick auf den fps-Wert.
GeForce RTX 2070 Super Mobile:
156 fps
GeForce RTX 2070 Super Mobile:
105.4 fps
GeForce RTX 2070 Super Mobile:
104.1 fps
GeForce RTX 2070 Super Mobile:
92.2 fps
GeForce RTX 2070 Super Mobile:
61 fps
GeForce RTX 2070 Super Mobile:
31.4 fps
GeForce RTX 2070 Super Mobile:
191 fps
GeForce RTX 2070 Super Mobile:
100.5 fps
GeForce RTX 2070 Super Mobile:
93.8 fps
GeForce RTX 2070 Super Mobile:
85.1 fps
GeForce RTX 2070 Super Mobile:
60.6 fps
GeForce RTX 2070 Super Mobile:
35.3 fps
GeForce RTX 2070 Super Mobile:
122 fps
GeForce RTX 2070 Super Mobile:
83 fps
GeForce RTX 2070 Super Mobile:
71 fps
GeForce RTX 2070 Super Mobile:
60 61 [X] SCHENKER XMG Neo 17 Comet Lake Overboost
Intel Core i7-10875H 2.3GHz
GeForce RTX 2070 Super Mobile
min:
18 fps, P0.1:
29 fps, P1:
42 fps, max:
124 fps
93 [X] SCHENKER Compact 17 Leistungsmodus
Intel Core i7-10875H 2.3GHz
GeForce RTX 2070 Super Mobile
min:
35 fps, P0.1:
40 fps, P1:
60 fps, max:
149 fps
~ 71 fps
GeForce RTX 2070 Super Mobile:
157 165 [X] SCHENKER Compact 17 Intel Core i7-10875H 2.3GHz
GeForce RTX 2070 Super Mobile
min:
112 fps, P0.1:
123.8 fps, P1:
129.7 fps, max:
233.8 fps
~ 161 fps
GeForce RTX 2070 Super Mobile:
91 91 95.5 [X] SCHENKER Compact 17 Intel Core i7-10875H 2.3GHz
GeForce RTX 2070 Super Mobile
min:
52.2 fps, P0.1:
65.7 fps, P1:
79.8 fps, max:
128.7 fps
~ 93 fps
GeForce RTX 2070 Super Mobile:
73.6 78 [X] SCHENKER Compact 17 Intel Core i7-10875H 2.3GHz
GeForce RTX 2070 Super Mobile
min:
52.6 fps, P0.1:
58.3 fps, P1:
66.9 fps, max:
97 fps
~ 76 fps
GeForce RTX 2070 Super Mobile:
45.5 63.8 [X] SCHENKER Compact 17 Intel Core i7-10875H 2.3GHz
GeForce RTX 2070 Super Mobile
min:
40.1 fps, P0.1:
48.9 fps, P1:
53.5 fps, max:
78.2 fps
68.6 [X] SCHENKER Compact 17 Leistungsmodus
Intel Core i7-10875H 2.3GHz
GeForce RTX 2070 Super Mobile
min:
46.8 fps, P0.1:
51.6 fps, P1:
58.2 fps, max:
125.1 fps
~ 59 fps
GeForce RTX 2070 Super Mobile:
52.3 [X] SCHENKER Compact 17 Intel Core i7-10875H 2.3GHz
GeForce RTX 2070 Super Mobile
min:
36.6 fps, P0.1:
39.1 fps, P1:
44.2 fps, max:
70.7 fps
fps
GeForce RTX 2070 Super Mobile:
34.9 [X] SCHENKER Compact 17 Intel Core i7-10875H 2.3GHz
GeForce RTX 2070 Super Mobile
min:
21.3 fps, P0.1:
24.1 fps, P1:
30.5 fps, max:
42.3 fps
fps
GeForce RTX 2070 Super Mobile:
112 [X] SCHENKER Compact 17 Intel Core i7-10875H 2.3GHz
GeForce RTX 2070 Super Mobile
min:
46 fps, P0.1:
63 fps, P1:
81 fps, max:
162 fps
112.2 ~ 112 fps
GeForce RTX 2070 Super Mobile:
102.7 105 [X] SCHENKER Compact 17 Intel Core i7-10875H 2.3GHz
GeForce RTX 2070 Super Mobile
min:
49 fps, P0.1:
62 fps, P1:
81 fps, max:
141 fps
~ 104 fps
GeForce RTX 2070 Super Mobile:
90.1 92 [X] SCHENKER Compact 17 Intel Core i7-10875H 2.3GHz
GeForce RTX 2070 Super Mobile
min:
48 fps, P0.1:
58 fps, P1:
70 fps, max:
128 fps
~ 91 fps
GeForce RTX 2070 Super Mobile:
59.3 60 [X] SCHENKER XMG Neo 17 Comet Lake Overboost
Intel Core i7-10875H 2.3GHz
GeForce RTX 2070 Super Mobile
min:
31 fps, P0.1:
42 fps, P1:
47 fps, max:
112 fps
61 [X] SCHENKER Compact 17 Intel Core i7-10875H 2.3GHz
GeForce RTX 2070 Super Mobile
min:
18 fps, P0.1:
40 fps, P1:
50 fps, max:
99 fps
64 [X] SCHENKER Compact 17 Leistungsmodus
Intel Core i7-10875H 2.3GHz
GeForce RTX 2070 Super Mobile
min:
38 fps, P0.1:
47 fps, P1:
53 fps, max:
98 fps
~ 61 fps
GeForce RTX 2070 Super Mobile:
44 [X] SCHENKER Compact 17 Intel Core i7-10875H 2.3GHz
GeForce RTX 2070 Super Mobile
min:
19 fps, P0.1:
20 fps, P1:
22 fps, max:
114 fps
fps
GeForce RTX 2070 Super Mobile:
25 [X] SCHENKER Compact 17 Intel Core i7-10875H 2.3GHz
GeForce RTX 2070 Super Mobile
min:
13 fps, P0.1:
14 fps, P1:
15 fps, max:
85 fps
fps
GeForce RTX 2070 Super Mobile:
263.1 fps
GeForce RTX 2070 Super Mobile:
224.6 fps
GeForce RTX 2070 Super Mobile:
211.5 fps
GeForce RTX 2070 Super Mobile:
202.4 fps
GeForce RTX 2070 Super Mobile:
123.7 149.5 ~ 137 fps
GeForce RTX 2070 Super Mobile:
95.2 106 ~ 101 fps
GeForce RTX 2070 Super Mobile:
92 96.6 ~ 94 fps
GeForce RTX 2070 Super Mobile:
122 124 143 [X] SCHENKER Compact 17 Intel Core i7-10875H 2.3GHz
GeForce RTX 2070 Super Mobile
min:
7.13 fps, P0.1:
24.4 fps, P1:
82.4 fps, max:
271 fps
~ 130 fps
GeForce RTX 2070 Super Mobile:
93.7 94 102 [X] SCHENKER Compact 17 Intel Core i7-10875H 2.3GHz
GeForce RTX 2070 Super Mobile
min:
7.57 fps, P0.1:
17.8 fps, P1:
57.4 fps, max:
202 fps
~ 97 fps
GeForce RTX 2070 Super Mobile:
81.6 86.6 [X] SCHENKER Compact 17 Intel Core i7-10875H 2.3GHz
GeForce RTX 2070 Super Mobile
min:
16.2 fps, P0.1:
22.6 fps, P1:
45.3 fps, max:
185 fps
87.8 ~ 85 fps
GeForce RTX 2070 Super Mobile:
71.1 72.5 78 [X] SCHENKER Compact 17 Intel Core i7-10875H 2.3GHz
GeForce RTX 2070 Super Mobile
min:
4.71 fps, P0.1:
24.4 fps, P1:
46.2 fps, max:
153 fps
82.1 [X] SCHENKER Compact 17 Leistungsmodus
Intel Core i7-10875H 2.3GHz
GeForce RTX 2070 Super Mobile
min:
16.4 fps, P0.1:
30.7 fps, P1:
46.6 fps, max:
143 fps
~ 76 fps
GeForce RTX 2070 Super Mobile:
63.7 [X] SCHENKER Compact 17 Intel Core i7-10875H 2.3GHz
GeForce RTX 2070 Super Mobile
min:
17.5 fps, P0.1:
24.3 fps, P1:
36.7 fps, max:
125 fps
fps
GeForce RTX 2070 Super Mobile:
39.8 [X] SCHENKER Compact 17 Intel Core i7-10875H 2.3GHz
GeForce RTX 2070 Super Mobile
min:
8.15 fps, P0.1:
15.3 fps, P1:
22.5 fps, max:
99.7 fps
fps
100%
GeForce GTX 1660 Ti Max-Q:
55.1 fps
125%
GeForce RTX 2070 Super Mobile:
66.6 71.2 ~ 69 fps
100%
GeForce GTX 1660 Ti Max-Q:
49.4 fps
121%
GeForce RTX 2070 Super Mobile:
58 61.7 ~ 60 fps
100%
GeForce GTX 1660 Ti Max-Q:
37.1 fps
137%
GeForce RTX 2070 Super Mobile:
48.8 53.3 ~ 51 fps
100%
GeForce GTX 1660 Ti Max-Q:
25.3 fps
162%
GeForce RTX 2070 Super Mobile:
37.8 42.1 43.8 [X] SCHENKER XMG Neo 17 Comet Lake Overboost
Intel Core i7-10875H 2.3GHz
GeForce RTX 2070 Super Mobile
~ 41 fps
100%
GeForce GTX 1660 Ti Max-Q:
119 fps
123%
GeForce RTX 2070 Super Mobile:
139 152 ~ 146 fps
100%
GeForce GTX 1660 Ti Max-Q:
78 fps
151%
GeForce RTX 2070 Super Mobile:
107 129 ~ 118 fps
100%
GeForce GTX 1660 Ti Max-Q:
65 fps
162%
GeForce RTX 2070 Super Mobile:
94 116 ~ 105 fps
100%
GeForce GTX 1660 Ti Max-Q:
51 fps
167%
GeForce RTX 2070 Super Mobile:
77 79 [X] Asus Strix G17 G712LWS Turbo
Intel Core i7-10750H 2.6GHz
GeForce RTX 2070 Super Mobile
98 ~ 85 fps
100%
GeForce GTX 1660 Ti Max-Q:
136.1 fps
104%
GeForce RTX 2070 Super Mobile:
137.5 145 ~ 141 fps
100%
GeForce GTX 1660 Ti Max-Q:
87.7 fps
147%
GeForce RTX 2070 Super Mobile:
128.2 129.2 ~ 129 fps
100%
GeForce GTX 1660 Ti Max-Q:
81.3 fps
145%
GeForce RTX 2070 Super Mobile:
117.8 119.1 ~ 118 fps
100%
GeForce GTX 1660 Ti Max-Q:
78.4 fps
153%
GeForce RTX 2070 Super Mobile:
116.2 116.8 121.6 [X] SCHENKER Compact 17 Leistungsmodus
Intel Core i7-10875H 2.3GHz
GeForce RTX 2070 Super Mobile
123.8 [X] Asus Strix G17 G712LWS Turbo
Intel Core i7-10750H 2.6GHz
GeForce RTX 2070 Super Mobile
~ 120 fps
GeForce RTX 2070 Super Mobile:
81.3 fps
GeForce RTX 2070 Super Mobile:
46.9 fps
100%
GeForce GTX 1660 Ti Max-Q:
219 fps
104%
GeForce RTX 2070 Super Mobile:
227 fps
100%
GeForce GTX 1660 Ti Max-Q:
130 fps
129%
GeForce RTX 2070 Super Mobile:
168 fps
100%
GeForce GTX 1660 Ti Max-Q:
112 fps
131%
GeForce RTX 2070 Super Mobile:
147 fps
100%
GeForce GTX 1660 Ti Max-Q:
79 fps
153%
GeForce RTX 2070 Super Mobile:
118 124 [X] Asus Strix G17 G712LWS Turbo
Intel Core i7-10750H 2.6GHz
GeForce RTX 2070 Super Mobile
min:
108 fps, max:
143 fps
~ 121 fps
100%
GeForce GTX 1660 Ti Max-Q:
214.7 fps
116%
GeForce RTX 2070 Super Mobile:
249.1 fps
100%
GeForce GTX 1660 Ti Max-Q:
130.2 fps
149%
GeForce RTX 2070 Super Mobile:
172.4 215 ~ 194 fps
100%
GeForce GTX 1660 Ti Max-Q:
79.9 fps
166%
GeForce RTX 2070 Super Mobile:
122.2 144 ~ 133 fps
100%
GeForce GTX 1660 Ti Max-Q:
56.1 fps
173%
GeForce RTX 2070 Super Mobile:
90 103 ~ 97 fps
GeForce RTX 2070 Super Mobile:
64.5 fps
GeForce RTX 2070 Super Mobile:
33.3 fps
100%
GeForce GTX 1660 Ti Max-Q:
168.9 fps
134%
GeForce RTX 2070 Super Mobile:
219.1 234.1 ~ 227 fps
100%
GeForce GTX 1660 Ti Max-Q:
101.7 fps
100%
GeForce GTX 1660 Ti Max-Q:
95.4 fps
100%
GeForce GTX 1660 Ti Max-Q:
93.4 fps
178%
GeForce RTX 2070 Super Mobile:
151 155.4 163.2 [X] Asus Strix G17 G712LWS Turbo
Intel Core i7-10750H 2.6GHz
GeForce RTX 2070 Super Mobile
170 190.4 ~ 166 fps
GeForce RTX 2070 Super Mobile:
118 fps
GeForce RTX 2070 Super Mobile:
61.6 fps
100%
GeForce GTX 1660 Ti Max-Q:
176.8 fps
100%
GeForce GTX 1660 Ti Max-Q:
81.2 fps
167%
GeForce RTX 2070 Super Mobile:
136 fps
100%
GeForce GTX 1660 Ti Max-Q:
63.3 fps
179%
GeForce RTX 2070 Super Mobile:
113 fps
GeForce RTX 2070 Super Mobile:
74 fps
GeForce RTX 2070 Super Mobile:
34.1 fps
100%
GeForce GTX 1660 Ti Max-Q:
121.2 fps
100%
GeForce GTX 1660 Ti Max-Q:
98.3 fps
123%
GeForce RTX 2070 Super Mobile:
121 fps
100%
GeForce GTX 1660 Ti Max-Q:
90.5 fps
134%
GeForce RTX 2070 Super Mobile:
121 fps
100%
GeForce GTX 1660 Ti Max-Q:
87.7 fps
138%
GeForce RTX 2070 Super Mobile:
121 fps
GeForce RTX 2070 Super Mobile:
81 fps
GeForce RTX 2070 Super Mobile:
41.4 fps
100%
GeForce GTX 1660 Ti Max-Q:
115.1 fps
100%
GeForce GTX 1660 Ti Max-Q:
71.7 fps
153%
GeForce RTX 2070 Super Mobile:
110 fps
100%
GeForce GTX 1660 Ti Max-Q:
47.2 fps
155%
GeForce RTX 2070 Super Mobile:
73.1 fps
100%
GeForce GTX 1660 Ti Max-Q:
29.4 fps
162%
GeForce RTX 2070 Super Mobile:
47.6 fps
GeForce RTX 2070 Super Mobile:
38.1 fps
GeForce RTX 2070 Super Mobile:
24.8 fps
100%
GeForce GTX 1660 Ti Max-Q:
91.5 fps
130%
GeForce RTX 2070 Super Mobile:
119 fps
100%
GeForce GTX 1660 Ti Max-Q:
78.1 fps
146%
GeForce RTX 2070 Super Mobile:
114 fps
100%
GeForce GTX 1660 Ti Max-Q:
72.4 fps
149%
GeForce RTX 2070 Super Mobile:
108 fps
GeForce RTX 2070 Super Mobile:
84 fps
GeForce RTX 2070 Super Mobile:
42.5 fps
100%
GeForce GTX 1660 Ti Max-Q:
95.8 fps
100%
GeForce GTX 1660 Ti Max-Q:
83 fps
127%
GeForce RTX 2070 Super Mobile:
105 fps
100%
GeForce GTX 1660 Ti Max-Q:
73.9 fps
131%
GeForce RTX 2070 Super Mobile:
97 fps
100%
GeForce GTX 1660 Ti Max-Q:
66.9 fps
138%
GeForce RTX 2070 Super Mobile:
92.4 fps
GeForce RTX 2070 Super Mobile:
81.7 fps
GeForce RTX 2070 Super Mobile:
48.1 fps
100%
GeForce GTX 1660 Ti Max-Q:
135.2 fps
100%
GeForce GTX 1660 Ti Max-Q:
88 fps
160%
GeForce RTX 2070 Super Mobile:
141 fps
100%
GeForce GTX 1660 Ti Max-Q:
72.6 fps
185%
GeForce RTX 2070 Super Mobile:
134 fps
100%
GeForce GTX 1660 Ti Max-Q:
62.6 fps
171%
GeForce RTX 2070 Super Mobile:
107 fps
GeForce RTX 2070 Super Mobile:
75.3 fps
GeForce RTX 2070 Super Mobile:
41.6 fps
100%
GeForce GTX 1660 Ti Max-Q:
112.9 fps
100%
GeForce GTX 1660 Ti Max-Q:
86.5 fps
185%
GeForce RTX 2070 Super Mobile:
160 fps
100%
GeForce GTX 1660 Ti Max-Q:
72 fps
165%
GeForce RTX 2070 Super Mobile:
119 fps
100%
GeForce GTX 1660 Ti Max-Q:
58.7 fps
137%
GeForce RTX 2070 Super Mobile:
80.7 fps
GeForce RTX 2070 Super Mobile:
70.2 fps
GeForce RTX 2070 Super Mobile:
47.2 fps
100%
GeForce GTX 1660 Ti Max-Q:
83 114 ~ 99 fps
100%
GeForce GTX 1660 Ti Max-Q:
68 72 ~ 70 fps
164%
GeForce RTX 2070 Super Mobile:
115 fps
100%
GeForce GTX 1660 Ti Max-Q:
65 66 ~ 66 fps
153%
GeForce RTX 2070 Super Mobile:
101 fps
100%
GeForce GTX 1660 Ti Max-Q:
48 51 ~ 50 fps
150%
GeForce RTX 2070 Super Mobile:
75 fps
GeForce RTX 2070 Super Mobile:
55 fps
GeForce RTX 2070 Super Mobile:
32 fps
100%
GeForce GTX 1660 Ti Max-Q:
147.9 fps
100%
GeForce GTX 1660 Ti Max-Q:
145.4 fps
193%
GeForce RTX 2070 Super Mobile:
280 fps
100%
GeForce GTX 1660 Ti Max-Q:
141 fps
189%
GeForce RTX 2070 Super Mobile:
267 fps
100%
GeForce GTX 1660 Ti Max-Q:
139.3 fps
190%
GeForce RTX 2070 Super Mobile:
264 fps
GeForce RTX 2070 Super Mobile:
262 fps
GeForce RTX 2070 Super Mobile:
211 fps
100%
GeForce GTX 1660 Ti Max-Q:
87 116.5 ~ 102 fps
100%
GeForce GTX 1660 Ti Max-Q:
72.1 81.5 ~ 77 fps
165%
GeForce RTX 2070 Super Mobile:
127 fps
100%
GeForce GTX 1660 Ti Max-Q:
52.9 54.9 ~ 54 fps
171%
GeForce RTX 2070 Super Mobile:
92.1 fps
100%
GeForce GTX 1660 Ti Max-Q:
41.5 42.3 ~ 42 fps
168%
GeForce RTX 2070 Super Mobile:
70.6 fps
GeForce RTX 2070 Super Mobile:
49.8 fps
GeForce RTX 2070 Super Mobile:
26.8 fps
100%
GeForce GTX 1660 Ti Max-Q:
158.3 fps
100%
GeForce GTX 1660 Ti Max-Q:
63.7 fps
168%
GeForce RTX 2070 Super Mobile:
107 fps
100%
GeForce GTX 1660 Ti Max-Q:
47.1 fps
172%
GeForce RTX 2070 Super Mobile:
80.8 fps
GeForce RTX 2070 Super Mobile:
52.6 fps
GeForce RTX 2070 Super Mobile:
25.6 fps
100%
GeForce GTX 1660 Ti Max-Q:
155 183 ~ 169 fps
100%
GeForce GTX 1660 Ti Max-Q:
119 140 ~ 130 fps
156%
GeForce RTX 2070 Super Mobile:
203 fps
100%
GeForce GTX 1660 Ti Max-Q:
106 117 ~ 112 fps
159%
GeForce RTX 2070 Super Mobile:
178 fps
100%
GeForce GTX 1660 Ti Max-Q:
71 77 ~ 74 fps
230%
GeForce RTX 2070 Super Mobile:
170 fps
GeForce RTX 2070 Super Mobile:
116 fps
GeForce RTX 2070 Super Mobile:
73 fps
100%
GeForce GTX 1660 Ti Max-Q:
144.1 209.4 ~ 177 fps
100%
GeForce GTX 1660 Ti Max-Q:
76.5 93.1 ~ 85 fps
100%
GeForce GTX 1660 Ti Max-Q:
54.7 57.1 ~ 56 fps
100%
GeForce GTX 1660 Ti Max-Q:
41.1 41.6 ~ 41 fps
100%
GeForce GTX 1660 Ti Max-Q:
146.4 154.7 ~ 151 fps
100%
GeForce GTX 1660 Ti Max-Q:
70.9 76.2 ~ 74 fps
193%
GeForce RTX 2070 Super Mobile:
143 fps
100%
GeForce GTX 1660 Ti Max-Q:
58.7 65.8 ~ 62 fps
195%
GeForce RTX 2070 Super Mobile:
121 fps
100%
GeForce GTX 1660 Ti Max-Q:
58.2 64.8 ~ 62 fps
192%
GeForce RTX 2070 Super Mobile:
119 fps
GeForce RTX 2070 Super Mobile:
74.2 fps
GeForce RTX 2070 Super Mobile:
36.7 fps
100%
GeForce GTX 1660 Ti Max-Q:
59.6 87.9 ~ 74 fps
100%
GeForce GTX 1660 Ti Max-Q:
58.7 83.2 ~ 71 fps
163%
GeForce RTX 2070 Super Mobile:
116 fps
100%
GeForce GTX 1660 Ti Max-Q:
45.3 64.1 ~ 55 fps
164%
GeForce RTX 2070 Super Mobile:
90.4 fps
100%
GeForce GTX 1660 Ti Max-Q:
26 33.2 ~ 30 fps
170%
GeForce RTX 2070 Super Mobile:
51 fps
GeForce RTX 2070 Super Mobile:
44 fps
GeForce RTX 2070 Super Mobile:
23.9 fps
100%
GeForce GTX 1660 Ti Max-Q:
110 142 ~ 126 fps
100%
GeForce GTX 1660 Ti Max-Q:
80 87 ~ 84 fps
179%
GeForce RTX 2070 Super Mobile:
150 fps
100%
GeForce GTX 1660 Ti Max-Q:
66 69 ~ 68 fps
182%
GeForce RTX 2070 Super Mobile:
124 fps
100%
GeForce GTX 1660 Ti Max-Q:
49 50 ~ 50 fps
174%
GeForce RTX 2070 Super Mobile:
87 fps
GeForce RTX 2070 Super Mobile:
61 fps
GeForce RTX 2070 Super Mobile:
32 fps
100%
GeForce GTX 1660 Ti Max-Q:
181.2 194.2 ~ 188 fps
100%
GeForce GTX 1660 Ti Max-Q:
102.6 139.9 ~ 121 fps
174%
GeForce RTX 2070 Super Mobile:
211 fps
100%
GeForce GTX 1660 Ti Max-Q:
88.7 103.2 ~ 96 fps
185%
GeForce RTX 2070 Super Mobile:
178 fps
100%
GeForce GTX 1660 Ti Max-Q:
57.3 59.2 ~ 58 fps
168%
GeForce RTX 2070 Super Mobile:
97.7 fps
GeForce RTX 2070 Super Mobile:
72.4 fps
100%
GeForce GTX 1660 Ti Max-Q:
53.6 fps
100%
GeForce GTX 1660 Ti Max-Q:
48.9 fps
100%
GeForce GTX 1660 Ti Max-Q:
48.8 fps
100%
GeForce GTX 1660 Ti Max-Q:
46.4 fps
100%
GeForce GTX 1660 Ti Max-Q:
97 fps
100%
GeForce GTX 1660 Ti Max-Q:
81 fps
137%
GeForce RTX 2070 Super Mobile:
111 fps
100%
GeForce GTX 1660 Ti Max-Q:
78 fps
133%
GeForce RTX 2070 Super Mobile:
104 fps
100%
GeForce GTX 1660 Ti Max-Q:
71 fps
132%
GeForce RTX 2070 Super Mobile:
94 fps
GeForce RTX 2070 Super Mobile:
89 fps
GeForce RTX 2070 Super Mobile:
50 fps
100%
GeForce GTX 1660 Ti Max-Q:
53.9 60 66.5 ~ 60 fps
187%
GeForce RTX 2070 Super Mobile:
112 fps
176%
GeForce RTX 2070 Super Mobile:
82.7 fps
177%
GeForce RTX 2070 Super Mobile:
65.5 fps
GeForce RTX 2070 Super Mobile:
54.4 fps
GeForce RTX 2070 Super Mobile:
31.9 fps
100%
GeForce GTX 1660 Ti Max-Q:
144 144 ~ 144 fps
100%
GeForce GTX 1660 Ti Max-Q:
105.3 133.9 ~ 120 fps
120%
GeForce RTX 2070 Super Mobile:
144 fps
100%
GeForce GTX 1660 Ti Max-Q:
90.1 99.6 ~ 95 fps
152%
GeForce RTX 2070 Super Mobile:
144 fps
100%
GeForce GTX 1660 Ti Max-Q:
89 99.6 ~ 94 fps
153%
GeForce RTX 2070 Super Mobile:
144 fps
GeForce RTX 2070 Super Mobile:
121 fps
GeForce RTX 2070 Super Mobile:
66.6 fps
GeForce RTX 2070 Super Mobile:
162 fps
GeForce RTX 2070 Super Mobile:
119 fps
GeForce RTX 2070 Super Mobile:
105 fps
GeForce RTX 2070 Super Mobile:
75 fps
GeForce RTX 2070 Super Mobile:
41.2 fps
100%
GeForce GTX 1660 Ti Max-Q:
135.6 fps
100%
GeForce GTX 1660 Ti Max-Q:
85.8 fps
193%
GeForce RTX 2070 Super Mobile:
166 fps
100%
GeForce GTX 1660 Ti Max-Q:
77.4 fps
182%
GeForce RTX 2070 Super Mobile:
141 fps
100%
GeForce GTX 1660 Ti Max-Q:
72.8 fps
174%
GeForce RTX 2070 Super Mobile:
127 fps
GeForce RTX 2070 Super Mobile:
88.3 fps
GeForce RTX 2070 Super Mobile:
44 fps
191%
GeForce RTX 2070 Super Mobile:
166 fps
192%
GeForce RTX 2070 Super Mobile:
152 fps
100%
GeForce GTX 1660 Ti Max-Q:
61 73 85 ~ 73 fps
193%
GeForce RTX 2070 Super Mobile:
141 fps
GeForce RTX 2070 Super Mobile:
110 fps
100%
GeForce GTX 1660 Ti Max-Q:
37.9 fps
165%
GeForce RTX 2070 Super Mobile:
62.7 fps
GeForce RTX 2070 Super Mobile:
98.8 fps
GeForce RTX 2070 Super Mobile:
89.7 fps
GeForce RTX 2070 Super Mobile:
82.5 fps
GeForce RTX 2070 Super Mobile:
78.8 fps
GeForce RTX 2070 Super Mobile:
46.4 fps
100%
GeForce GTX 1660 Ti Max-Q:
115.2 fps
100%
GeForce GTX 1660 Ti Max-Q:
87.9 fps
100%
GeForce GTX 1660 Ti Max-Q:
84.6 fps
100%
GeForce GTX 1660 Ti Max-Q:
83.1 fps
100%
GeForce GTX 1660 Ti Max-Q:
48 64 90 ~ 67 fps
100%
GeForce GTX 1660 Ti Max-Q:
43 56 71 ~ 57 fps
182%
GeForce RTX 2070 Super Mobile:
104 fps
100%
GeForce GTX 1660 Ti Max-Q:
39 51 60 ~ 50 fps
180%
GeForce RTX 2070 Super Mobile:
90 fps
100%
GeForce GTX 1660 Ti Max-Q:
33 42 44 ~ 40 fps
158%
GeForce RTX 2070 Super Mobile:
63 fps
GeForce RTX 2070 Super Mobile:
56 fps
GeForce RTX 2070 Super Mobile:
36 fps
100%
GeForce GTX 1660 Ti Max-Q:
62 82 113 126 ~ 96 fps
143%
GeForce RTX 2070 Super Mobile:
121 153 ~ 137 fps
100%
GeForce GTX 1660 Ti Max-Q:
53 57 83 85 ~ 70 fps
169%
GeForce RTX 2070 Super Mobile:
110 120 123 ~ 118 fps
100%
GeForce GTX 1660 Ti Max-Q:
52 53 74 75 ~ 64 fps
177%
GeForce RTX 2070 Super Mobile:
107 115 118 ~ 113 fps
100%
GeForce GTX 1660 Ti Max-Q:
49 49 64 67 ~ 57 fps
182%
GeForce RTX 2070 Super Mobile:
100 104 108 ~ 104 fps
GeForce RTX 2070 Super Mobile:
73 fps
GeForce RTX 2070 Super Mobile:
37 fps
100%
GeForce GTX 1660 Ti Max-Q:
66.9 fps
100%
GeForce GTX 1660 Ti Max-Q:
59.3 fps
219%
GeForce RTX 2070 Super Mobile:
130 fps
100%
GeForce GTX 1660 Ti Max-Q:
59.5 fps
202%
GeForce RTX 2070 Super Mobile:
120 fps
100%
GeForce GTX 1660 Ti Max-Q:
50.8 fps
195%
GeForce RTX 2070 Super Mobile:
98.9 fps
GeForce RTX 2070 Super Mobile:
63.9 fps
GeForce RTX 2070 Super Mobile:
32.1 fps
100%
GeForce GTX 1660 Ti Max-Q:
68 103 ~ 86 fps
100%
GeForce GTX 1660 Ti Max-Q:
54 84 ~ 69 fps
100%
GeForce GTX 1660 Ti Max-Q:
53 79 ~ 66 fps
100%
GeForce GTX 1660 Ti Max-Q:
50 74 ~ 62 fps
169%
GeForce RTX 2070 Super Mobile:
98 112 ~ 105 fps
100%
GeForce GTX 1660 Ti Max-Q:
30 fps
100%
GeForce GTX 1660 Ti Max-Q:
376.8 fps
100%
GeForce GTX 1660 Ti Max-Q:
215.9 fps
100%
GeForce GTX 1660 Ti Max-Q:
117.3 fps
141%
GeForce RTX 2070 Super Mobile:
107 113 117 118 ~ 114 fps
100%
GeForce GTX 1660 Ti Max-Q:
125.6 fps
100%
GeForce GTX 1660 Ti Max-Q:
91.7 fps
159%
GeForce RTX 2070 Super Mobile:
146 fps
100%
GeForce GTX 1660 Ti Max-Q:
77.3 fps
154%
GeForce RTX 2070 Super Mobile:
119 fps
100%
GeForce GTX 1660 Ti Max-Q:
53.7 fps
154%
GeForce RTX 2070 Super Mobile:
82.5 fps
GeForce RTX 2070 Super Mobile:
59.7 fps
GeForce RTX 2070 Super Mobile:
31.1 fps
178%
GeForce RTX 2070 Super Mobile:
121 fps
100%
GeForce GTX 1660 Ti Max-Q:
44.9 50 54.6 ~ 50 fps
170%
GeForce RTX 2070 Super Mobile:
79.7 91.1 ~ 85 fps
GeForce RTX 2070 Super Mobile:
37.7 fps
100%
GeForce GTX 1660 Ti Max-Q:
138 fps
100%
GeForce GTX 1660 Ti Max-Q:
92.2 fps
178%
GeForce RTX 2070 Super Mobile:
164 fps
100%
GeForce GTX 1660 Ti Max-Q:
89.5 fps
174%
GeForce RTX 2070 Super Mobile:
156 fps
100%
GeForce GTX 1660 Ti Max-Q:
78.6 fps
164%
GeForce RTX 2070 Super Mobile:
129 fps
GeForce RTX 2070 Super Mobile:
93.4 fps
GeForce RTX 2070 Super Mobile:
47.9 fps
100%
GeForce GTX 1660 Ti Max-Q:
91 fps
100%
GeForce GTX 1660 Ti Max-Q:
82 fps
100%
GeForce GTX 1660 Ti Max-Q:
72 fps
100%
GeForce GTX 1660 Ti Max-Q:
61 fps
100%
GeForce GTX 1660 Ti Max-Q:
206.7 247.4 ~ 227 fps
100%
GeForce GTX 1660 Ti Max-Q:
160.8 212.1 ~ 186 fps
100%
GeForce GTX 1660 Ti Max-Q:
141.7 173.7 ~ 158 fps
100%
GeForce GTX 1660 Ti Max-Q:
130.4 fps
100%
GeForce GTX 1660 Ti Max-Q:
78.1 fps
100%
GeForce GTX 1660 Ti Max-Q:
72.4 fps
100%
GeForce GTX 1660 Ti Max-Q:
41.5 fps
100%
GeForce GTX 1660 Ti Max-Q:
193.7 fps
100%
GeForce GTX 1660 Ti Max-Q:
140.7 fps
100%
GeForce GTX 1660 Ti Max-Q:
116 fps
100%
GeForce GTX 1660 Ti Max-Q:
42.4 fps
100%
GeForce GTX 1660 Ti Max-Q:
40.7 fps
100%
GeForce GTX 1660 Ti Max-Q:
93.7 fps
100%
GeForce GTX 1660 Ti Max-Q:
72.7 fps
100%
GeForce GTX 1660 Ti Max-Q:
64.5 fps
100%
GeForce GTX 1660 Ti Max-Q:
232.8 fps
100%
GeForce GTX 1660 Ti Max-Q:
200.1 fps
100%
GeForce GTX 1660 Ti Max-Q:
163.6 fps
100%
GeForce GTX 1660 Ti Max-Q:
148.8 fps
100%
GeForce GTX 1660 Ti Max-Q:
60 fps
100%
GeForce GTX 1660 Ti Max-Q:
60 fps
100%
GeForce GTX 1660 Ti Max-Q:
60 fps
100%
GeForce GTX 1660 Ti Max-Q:
93.3 113 119 ~ 108 fps
144%
GeForce RTX 2070 Super Mobile:
154 155 156 156 ~ 155 fps
139%
GeForce RTX 2070 Super Mobile:
136 137 141 145 ~ 140 fps
135%
GeForce RTX 2070 Super Mobile:
111 127 133 135 ~ 127 fps
136%
GeForce RTX 2070 Super Mobile:
104 122 126 129 ~ 120 fps
100%
GeForce GTX 1660 Ti Max-Q:
89 fps
100%
GeForce GTX 1660 Ti Max-Q:
69 fps
100%
GeForce GTX 1660 Ti Max-Q:
51 fps
100%
GeForce GTX 1660 Ti Max-Q:
30.9 fps
191%
GeForce RTX 2070 Super Mobile:
57.6 59.8 ~ 59 fps
100%
GeForce GTX 1660 Ti Max-Q:
161.3 fps
113%
GeForce RTX 2070 Super Mobile:
182 [X] MSI GE66 Raider 10SFS Intel Core i9-10980HK 2.4GHz
GeForce RTX 2070 Super Mobile
min:
2.06 fps, P1:
143 fps, max:
272 fps
fps
100%
GeForce GTX 1660 Ti Max-Q:
151.5 fps
117%
GeForce RTX 2070 Super Mobile:
177 [X] MSI GE66 Raider 10SFS Intel Core i9-10980HK 2.4GHz
GeForce RTX 2070 Super Mobile
min:
3.28 fps, P1:
143 fps, max:
351 fps
fps
100%
GeForce GTX 1660 Ti Max-Q:
114.6 fps
142%
GeForce RTX 2070 Super Mobile:
163 [X] MSI GE66 Raider 10SFS Intel Core i9-10980HK 2.4GHz
GeForce RTX 2070 Super Mobile
min:
5.5 fps, P1:
100 fps, max:
300 fps
fps
100%
GeForce GTX 1660 Ti Max-Q:
59.6 fps
158%
GeForce RTX 2070 Super Mobile:
94 [X] MSI GE66 Raider 10SFS Intel Core i9-10980HK 2.4GHz
GeForce RTX 2070 Super Mobile
min:
22.9 fps, P1:
62.5 fps, max:
186 fps
fps
144%
GeForce RTX 2070 Super Mobile:
371.8 fps
123%
GeForce RTX 2070 Super Mobile:
308.3 fps
131%
GeForce RTX 2070 Super Mobile:
299 fps
148%
GeForce RTX 2070 Super Mobile:
173.4 fps
100%
GeForce GTX 1660 Ti Max-Q:
343.8 fps
100%
GeForce GTX 1660 Ti Max-Q:
322.9 fps
100%
GeForce GTX 1660 Ti Max-Q:
296.9 fps
100%
GeForce GTX 1660 Ti Max-Q:
166.1 fps
Average Gaming NVIDIA GeForce GTX 1660 Ti Max-Q → 100% Average Gaming 30-70 fps → 100%
Average Gaming NVIDIA GeForce RTX 2070 Super Mobile → 160% Average Gaming 30-70 fps → 157%
 Deutsch
 English
 Español
 Français
 Italiano
 Nederlands
 Polski
 Português
 Русский
 Türkçe
 Svenska
 Chinese
 Magyar