Testberichte für den Intel Core Ultra 9 185H Prozessor
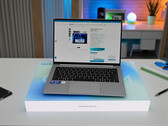
Kompaktes Premium-Ultrabook mit starkem 2,8K-OLED-Display und Core Ultra im Test – Geekom GeekBook X14 Pro
Mit dem GeekBook X14 Pro betritt Mini-PC-Spezialist Geekom erstmals den Notebook-Markt – und setzt direkt auf ein leichtes Premium-Ultrabook mit OLED-Display, Intel-Core-Ultra-Prozessor und moderner Ausstattung. Doch wie schlägt sich das 14-Zoll-Gerät im Alltag hinsichtlich Mobilität, Leistung und Ausdauer? Unser ausführlicher Test zeigt, ob das Debüt gelingt oder noch Kinderkrankheiten offenbart.
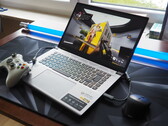
Intel Core Ultra 9 185H, Arc 8-Core, 14", 1 kgTest Acer Predator Triton Neo 16: Premium-Laptop mit RTX 4070 für Gamer und Creator
Während das kürzlich getestete Nitro V 16 aufgrund des mauen Bildschirms nur bedingt überzeugen konnte, macht das Predator Triton Neo 16 eine deutlich bessere Figur. Wir haben den 16-Zoll-Gamer mit Meteor Lake-CPU und GeForce RTX 4070 ausführlich getestet.
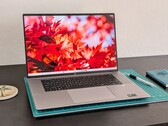
Intel Core Ultra 9 185H, NVIDIA GeForce RTX 4070 Laptop GPU, 16", 2 kgHP ZBook Studio 16 G11 Workstation im Test: Leistungsstark und dabei super leicht
Eine der leichtesten 16-Zoll-Workstations von HP erhält neue Prozessoroptionen und eine RTX 3000 für eine spürbar schnellere Leistung als bisher. Wo sich die Nachteile des ZBooks verstecken, ermitteln wir in diesem Review.
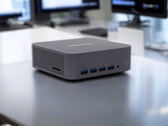
Intel Core Ultra 9 185H, NVIDIA RTX 3000 Ada Generation Laptop, 16", 1.8 kgAsus NUC 14 Pro+ Mini-PC im Test - potenzieller Desktop-Killer mit nur 622 Gramm
Der Asus NUC 14 Pro+ verspricht beeindruckende Leistung in einem kompakten Format – ein Mini-PC, der mit modernen Prozessoren und viel Power aufwartet. Doch wie gut schlägt er sich im Alltag? In diesem Review prüfen wir, ob der NUC 14 Pro+ die Erwartungen erfüllt und ob er tatsächlich eine Desktop-Alternative darstellt.
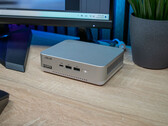
Intel Core Ultra 9 185H, Arc 8-Core, 622 gGeekom GT1 Mega im Test: Erster KI-Mini-PC von Geekom überzeugt nicht in allen Punkten
Der Geekom GT1 Mega verspricht starke Leistung im Mini-PC-Format und richtet sich an Nutzer, die auf kleinstem Raum viel Leistung benötigen. Ausgestattet mit dem Intel Core Ultra 9 185H verbaut Geekom erstmals einen Meteor-Lake-Prozessor, der eine separate NPU mitbringt. Ob der Geekom GT1 Mega überzeugt, klären wir in diesem Test – von Performance über Ausstattung bis zur Kühlung.
Intel Core Ultra 9 185H, Arc 8-Core, 693 gLenovo IdeaPad Pro 5 16IMH G9 RTX 4050: NVIDIA GeForce RTX 4050 Laptop GPU, 16.00", 2 kg
Test » Lenovo IdeaPad Pro 5 16IMH G9 im Test: 90 W GeForce RTX 4050 fast so gut wie die RTX 4060
Acer Predator Helios Neo 14 (2024): NVIDIA GeForce RTX 4070 Laptop GPU, 14.50", 1.9 kg
Test » Acer Predator Helios Neo 14 (2024) im Test: Mobiles RTX-4070-Notebook mit langen Laufzeiten
Asus ROG NUC 14-90AS0051: NVIDIA GeForce RTX 4070 Laptop GPU, 2.6 kg
Test » Asus ROG NUC Gaming-Mini-PC im Test: Intel Core Ultra 9 185H und Nvidia GeForce RTX 4070 Laptop im 2,5-Liter-Gehäuse
Asus ROG Zephyrus G16 GU605MY: NVIDIA GeForce RTX 4090 Laptop GPU, 16.00", 1.9 kg
Test » Asus ROG Zephyrus G16 Laptop im Test - RTX 4090 im schlanken Gamer mit angezogener Handbremse
Lenovo Yoga Pro 9 16IMH9 RTX 4050: NVIDIA GeForce RTX 4050 Laptop GPU, 16.00", 2.1 kg
Test » Lenovo Yoga Pro 9 16IMH9 Laptop im Test: Die Leistung der 75-Watt-GeForce RTX 4050 übertrifft Erwartungen
Huawei MateBook X Pro 2024: Intel Arc 8-Core iGPU, 14.20", 1 kg
Test » Huawei MateBook X Pro 2024 Laptop im Test - 980 Gramm Magnesium-Ultrabook mit beeindruckendem OLED-Panel
Alienware x16 R2 P120F: NVIDIA GeForce RTX 4080 Laptop GPU, 16.00", 2.7 kg
Test » Alienware x16 R2 Laptop im Test: Eine Weiterentwicklung im Vergleich zum x16 R1
Minisforum AtomMan X7 Ti: Intel Arc 8-Core iGPU, 0.9 kg
Test » Minisforum AtomMan X7 Ti mit Intel Core Ultra 9 185H im Test: AI-Mini-PC mit Touch-Display, Kamera und OCuLink
Dell Precision 5690: NVIDIA RTX 5000 Ada Generation Laptop, 16.00", 2.3 kg
Test » Dell Precision 5690 im Workstation-Test: Bereit für die KI-Revolution
Dell Precision 5000 5490: NVIDIA RTX 3000 Ada Generation Laptop, 14.00", 1.6 kg
Test » Dell Precision 5490 Workstation im Test: Jetzt mit Intel Meteor Lake-H vPro
Lenovo Yoga Pro 9 16IMH9: NVIDIA GeForce RTX 4070 Laptop GPU, 16.00", 2.1 kg
Test » Lenovo Yoga Pro 9i 16 G9 Laptop im Test - MiniLED mit 1.200 Nits und Core Ultra 9
Asus Zenbook Duo OLED UX8406MA: Intel Arc 8-Core iGPU, 14.00", 1.7 kg
Test » Asus Zenbook Duo OLED (2024) Convertible im Test - Multitasking-Champion mit Core Ultra 9
HP ZBook Power 16 G11, RTX 3000 Ada: NVIDIA RTX 3000 Ada Generation Laptop, 16.00", 2.1 kg
Externer Test » HP ZBook Power 16 G11, RTX 3000 Ada
Lenovo ThinkPad P16s G3: Intel Arc 8-Core iGPU, 16.00", 1.8 kg
Externer Test » Lenovo ThinkPad P16s G3
HP Omen Transcend 14-fb0000ng, Ultra 9 185H: NVIDIA GeForce RTX 4060 Laptop GPU, 14.00", 1.6 kg
Externer Test » HP Omen Transcend 14-fb0000ng, Ultra 9 185H
Lenovo IdeaPad Pro 5 16IMH9, Ultra 9 185H: Intel Arc 8-Core iGPU, 16.00", 1.9 kg
Externer Test » Lenovo IdeaPad Pro 5 16IMH9, Ultra 9 185H
MSI Prestige 16 AI Studio B1VGG: NVIDIA GeForce RTX 4070 Laptop GPU, 16.00", 1.6 kg
Externer Test » MSI Prestige 16 AI Studio B1VGG
Acer Predator Triton Neo 16 PTN16-51, Ultra 9 185H: NVIDIA GeForce RTX 4060 Laptop GPU, 16.00", 2.1 kg
Externer Test » Acer Predator Triton Neo 16 PTN16-51, Ultra 9 185H
HP ZBook Studio 16 G11: NVIDIA RTX 3000 Ada Generation Laptop, 16.00", 1.8 kg
Externer Test » HP ZBook Studio 16 G11
MSI Stealth 18 AI Studio A1VHG: NVIDIA GeForce RTX 4080 Laptop GPU, 18.00", 2.9 kg
Externer Test » MSI Stealth 18 AI Studio A1VHG
MSI Prestige 14 AI Studio C1VFG, Ultra 9 185H: NVIDIA GeForce RTX 4060 Laptop GPU, 14.00", 1.7 kg
Externer Test » MSI Prestige 14 AI Studio C1VFG, Ultra 9 185H
Acer Predator Helios Neo 14 PHN14-51, RTX 4060: NVIDIA GeForce RTX 4060 Laptop GPU, 14.50", 1.9 kg
Externer Test » Acer Predator Helios Neo 14 PHN14-51, RTX 4060
MSI Stealth 16 AI Studio A1VIG: NVIDIA GeForce RTX 4090 Laptop GPU, 16.00", 2 kg
Externer Test » MSI Stealth 16 AI Studio A1VIG
Lenovo IdeaPad Pro 5 16IMH G9 RTX 4050: NVIDIA GeForce RTX 4050 Laptop GPU, 16.00", 2 kg
Externer Test » Lenovo IdeaPad Pro 5 16IMH G9 RTX 4050
Acer Predator Helios Neo 14 (2024): NVIDIA GeForce RTX 4070 Laptop GPU, 14.50", 1.9 kg
Externer Test » Acer Predator Helios Neo 14 (2024)
MSI Creator 16 AI Studio A1VIG: NVIDIA GeForce RTX 4090 Laptop GPU, 16.00", 2 kg
Externer Test » MSI Creator 16 AI Studio A1VIG
MSI Stealth 16 AI Studio A1VGG: NVIDIA GeForce RTX 4070 Laptop GPU, 16.00", 2 kg
Externer Test » MSI Stealth 16 AI Studio A1VGG
Dell Precision 5000 5490: NVIDIA RTX 3000 Ada Generation Laptop, 14.00", 1.6 kg
Externer Test » Dell Precision 5000 5490
MSI Stealth 18 AI Studio A1VIG: NVIDIA GeForce RTX 4090 Laptop GPU, 18.00", 2.9 kg
Externer Test » MSI Stealth 18 AI Studio A1VIG
Acer Predator Triton Neo 16 PTN16-51, RTX 4070: NVIDIA GeForce RTX 4070 Laptop GPU, 16.00", 2.1 kg
Externer Test » Acer Predator Triton Neo 16 PTN16-51, RTX 4070
Lenovo Yoga Pro 7 14IMH9, Ultra 9 185H RTX 4060: NVIDIA GeForce RTX 4060 Laptop GPU, 14.50", 1.6 kg
Externer Test » Lenovo Yoga Pro 7 14IMH9, Ultra 9 185H RTX 4060
Lenovo Yoga Pro 9 16IMH9, RTX 4060: NVIDIA GeForce RTX 4060 Laptop GPU, 16.00", 2.1 kg
Externer Test » Lenovo Yoga Pro 9 16IMH9, RTX 4060
Acer Swift Go 16 OLED SFG16-72: Intel Arc 8-Core iGPU, 16.00", 1.6 kg
Externer Test » Acer Swift Go 16 OLED SFG16-72
Lenovo Yoga Pro 9 16IMH9, RTX 4050: NVIDIA GeForce RTX 4050 Laptop GPU, 16.00", 2.1 kg
Externer Test » Lenovo Yoga Pro 9 16IMH9, RTX 4050
Asus ROG Zephyrus G16 2024 GU605MV: NVIDIA GeForce RTX 4060 Laptop GPU, 16.00", 1.9 kg
Externer Test » Asus ROG Zephyrus G16 2024 GU605MV
Lenovo ThinkBook 13x IMH G4, Ultra 9 185H: Intel Arc 8-Core iGPU, 13.50", 1.2 kg
Externer Test » Lenovo ThinkBook 13x IMH G4, Ultra 9 185H
MSI Stealth 18 A1VHG: NVIDIA GeForce RTX 4080 Laptop GPU, 18.40", 2.8 kg
Externer Test » MSI Stealth 18 A1VHG
Lenovo Yoga Pro 9 16IMH9 RTX 4050: NVIDIA GeForce RTX 4050 Laptop GPU, 16.00", 2.1 kg
Externer Test » Lenovo Yoga Pro 9 16IMH9 RTX 4050
MSI Pulse 16 AI C1VGKG: NVIDIA GeForce RTX 4070 Laptop GPU, 16.00", 2.5 kg
Externer Test » MSI Pulse 16 AI C1VGKG
Asus ZenBook 14 UX3405MA, Ultra 9: Intel Arc 8-Core iGPU, 14.00", 1.2 kg
Externer Test » Asus ZenBook 14 UX3405MA, Ultra 9
Asus VivoBook S 14 OLED S5406MA, Ultra 9 185H: Intel Arc 8-Core iGPU, 14.00", 1.3 kg
Externer Test » Asus VivoBook S 14 OLED S5406MA, Ultra 9 185H
MSI Stealth 14 AI Studio A1VGG: NVIDIA GeForce RTX 4070 Laptop GPU, 14.00", 1.7 kg
Externer Test » MSI Stealth 14 AI Studio A1VGG
Dell Precision 5690: NVIDIA RTX 5000 Ada Generation Laptop, 16.00", 2.3 kg
Externer Test » Dell Precision 5690
Alienware x16 R2 P120F: NVIDIA GeForce RTX 4080 Laptop GPU, 16.00", 2.7 kg
Externer Test » Alienware x16 R2 P120F
Huawei MateBook X Pro 2024: Intel Arc 8-Core iGPU, 14.20", 1 kg
Externer Test » Huawei MateBook X Pro 2024
Acer Swift Go 14 SFG14-72, Ultra 9: Intel Arc 8-Core iGPU, 14.00", 1.3 kg
Externer Test » Acer Swift Go 14 SFG14-72, Ultra 9
Samsung Galaxy Book4 Ultra, RTX 4070: NVIDIA GeForce RTX 4070 Laptop GPU, 16.00", 1.9 kg
Externer Test » Samsung Galaxy Book4 Ultra, RTX 4070
MSI Prestige 16 AI Studio B1VFG: NVIDIA GeForce RTX 4060 Laptop GPU, 16.00", 1.6 kg
Externer Test » MSI Prestige 16 AI Studio B1VFG
Alienware x16 R2: NVIDIA GeForce RTX 4080 Laptop GPU, 16.00", 2.7 kg
Externer Test » Alienware x16 R2
Asus ROG Zephyrus G16 GU605MI, Ultra 9 185H: NVIDIA GeForce RTX 4070 Laptop GPU, 16.00", 1.8 kg
Externer Test » Asus ROG Zephyrus G16 GU605MI, Ultra 9 185H
MSI Stealth 16 AI Studio A1VHG: NVIDIA GeForce RTX 4080 Laptop GPU, 16.00", 2 kg
Externer Test » MSI Stealth 16 AI Studio A1VHG
MSI Sword 16 HX B14VFKG: NVIDIA GeForce RTX 4060 Laptop GPU, 16.00", 2.3 kg
Externer Test » MSI Sword 16 HX B14VFKG
Asus ROG Zephyrus G16 GU605MY: NVIDIA GeForce RTX 4090 Laptop GPU, 16.00", 1.9 kg
Externer Test » Asus ROG Zephyrus G16 GU605MY
Asus ROG Zephyrus G16 GU605MZ: NVIDIA GeForce RTX 4080 Laptop GPU, 16.00", 2 kg
Externer Test » Asus ROG Zephyrus G16 GU605MZ
Lenovo Yoga Pro 9 16IMH9: NVIDIA GeForce RTX 4070 Laptop GPU, 16.00", 2.1 kg
Externer Test » Lenovo Yoga Pro 9 16IMH9
HP Omen Transcend 14-fb0000ng: NVIDIA GeForce RTX 4070 Laptop GPU, 14.00", 1.6 kg
Externer Test » HP Omen Transcend 14-fb0000ng
Asus Vivobook Pro 15 OLED N6506: NVIDIA GeForce RTX 4060 Laptop GPU, 15.60", 1.8 kg
Externer Test » Asus Vivobook Pro 15 OLED N6506
Asus Zenbook Duo OLED UX8406MA: Intel Arc 8-Core iGPU, 14.00", 1.7 kg
Externer Test » Asus Zenbook Duo OLED UX8406MA
Geekom GeekBook X14 Pro: Intel Arc 8-Core iGPU, 14.00", 1 kg
» GeekBook X14 Pro: Ultraleichtes 14-Zoll-OLED-Notebook von Geekom mit Core Ultra 9 getestet
Asus ROG NUC 14-90AS0051: NVIDIA GeForce RTX 4070 Laptop GPU, 2.6 kg
» Asus ROG NUC 15 Mini-PC mit GeForce RTX 5070 (Ti) oder GeForce RTX 5080 ist jetzt auch in Deutschland verfügbar
Asus Zenbook Duo OLED UX8406MA: Intel Arc 8-Core iGPU, 14.00", 1.7 kg
» Zwei OLED-Touchscreens in einem Notebook: Asus ZenBook Duo mit Core Ultra 7 für 1.599 Euro
Asus ROG NUC 14-90AS0051: NVIDIA GeForce RTX 4070 Laptop GPU, 2.6 kg
» Mini-PC mit RTX 4070: Asus ROG NUC 14 mit Core Ultra 9 und 32GB DDR5 erhält kräftigen Deal-Rabatt
Geekom GT1 Mega: Intel Arc 8-Core iGPU, 0.7 kg
» Nur heute: Geekom GT1 Mega Mini-PC mit 32GB RAM und Core Ultra 9 185H zum Bestpreis auf Amazon
Acer Predator Helios Neo 14 (2024): NVIDIA GeForce RTX 4070 Laptop GPU, 14.50", 1.9 kg
» Kompakt-Gamer Acer Predator Helios Neo 14 mit QHD+ Display, Core Ultra 7 und RTX 4060 zum Bestpreis
Huawei MateBook X Pro 2024: Intel Arc 8-Core iGPU, 14.20", 1 kg
» Deal: 980g leichtes Huawei MateBook X Pro 2024 mit 1.200 Nits hellem 3K-OLED-Touchscreen zum Bestpreis
Acer Predator Helios Neo 14 (2024): NVIDIA GeForce RTX 4070 Laptop GPU, 14.50"
» Acer Predator Helios Neo 14 (2024) mit Core Ultra 9 und RTX 4070: Wie viel Power liefert die Hardware im Akkubetrieb?
» Acer Predator Helios Neo 14 (2024) mit Core Ultra 9 und RTX 4070: Wie viel Power liefert die Hardware im Akkubetrieb?
» Acer Predator Helios Neo 14: Leichtes Gaming-Notebook mit 3k-Panel, GeForce RTX4070, langen Laufzeiten
Asus ROG Zephyrus G16 GU605MY: NVIDIA GeForce RTX 4090 Laptop GPU, 16.00", 1.9 kg
» Das Asus ROG Zephyrus G16 ist das kompakteste 16-Zoll-Notebook mit einer GeForce RTX 4090 Laptop
Huawei MateBook X Pro 2024: Intel Arc 8-Core iGPU, 14.20", 1 kg
» Huaweis neues MateBook X Pro ist wiegt nur 980 Gramm und bietet einen hellen OLED-Touchscreen, die Kühlung ist aber überfordert
Minisforum AtomMan X7 Ti: Intel Arc 8-Core iGPU, 0.9 kg
» Minisforum AtomMan X7 Ti: AI-Mini-PC mit 4 Zoll Touch-Display und Intel Core Ultra 9 185H im Test
Lenovo Yoga Pro 9 16IMH9: NVIDIA GeForce RTX 4070 Laptop GPU, 16.00", 2.1 kg
» Lenovo Yoga Pro 9i 16 G9 bietet weiterhin ein tolles Mini-LED-Panel mit 1.200 Nits, aber es gibt auch neue Probleme
Asus Zenbook Duo OLED UX8406MA: Intel Arc 8-Core iGPU, 14.00", 1.7 kg
» Asus Zenbook Duo startet in Deutschland ab 1.599 Euro mit zwei Displays, Thunderbolt 4 und Bluetooth-Tastatur
» Asus Zenbook Duo startet in Deutschland ab 1.599 Euro mit zwei Displays, Thunderbolt 4 und Bluetooth-Tastatur
» Asus Zenbook Duo startet in Deutschland ab 1.599 Euro mit zwei Displays, Thunderbolt 4 und Bluetooth-Tastatur
» Das Asus Zenbook Duo OLED (2024) ist das beste Multi-Screen-Gerät auf dem Markt