Intel HD Graphics 5000 vs Intel HD Graphics (Sandy Bridge) vs Intel HD Graphics (Cherry Trail)
Intel HD Graphics 5000 ► remove from comparison
Die Intel HD Graphics 5000 (GT3) ist eine Prozessorgrafikkarte in den CPUs der Haswell- Generation. Zunächst wird die GPU in einigen ULV-Modellen mit 15 Watt TDP eingesetzt (z.B. Core i5-4250U ). Sie stellt die maximale Ausbaustufe der integrierten Grafikeinheit dar (40 Execution Units), muss im Gegensatz zur Iris Pro (GT3e) aber auf den zusätzlichen eDRAM-Cache verzichten. Abhängig von der Taktrate (diese fällt bei den 15-Watt-Modellen relativ niedrig aus) sowie der Hauptspeicheranbindung kann sich die Performance von Modell zu Modell leicht unterscheiden.
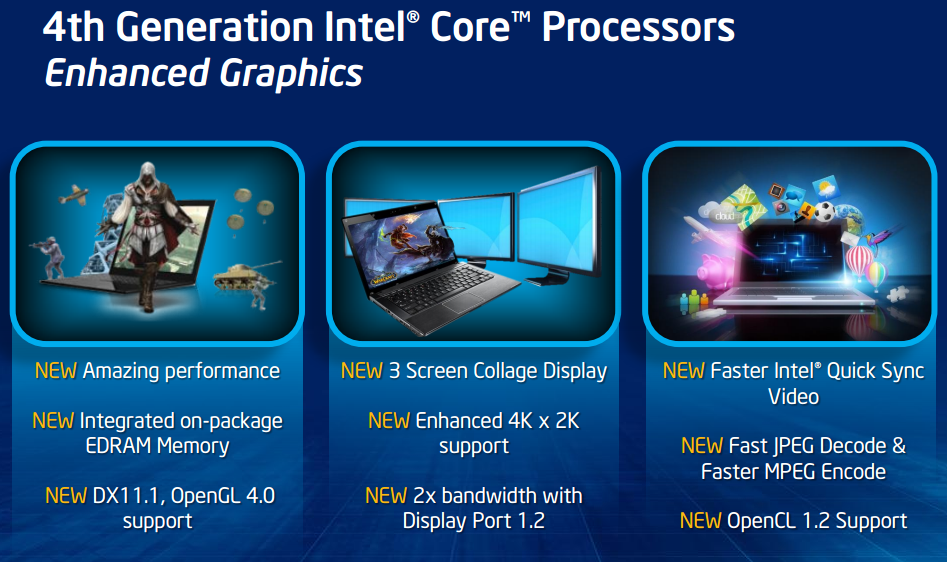
Der Grafikkern wurde im Vergleich zum Intel HD Graphics 4000 der Ivy-Bridge-Generation in verschiedenen Punkten weiterentwickelt. So unterstützt die GPU nun mit DirectX 11.1, OpenCL 1.2 und OpenGL 4.0 alle wichtigen aktuellen Standards. Auch ein verbesserter Decoder für 4K-Videos sowie ein überarbeiteter Quick-Sync-Encoder sind mit an Bord.
Die Performance der HD Graphics 5000 liegt im 3DMark 11 um etwa 50 Prozent oberhalb der HD 4000 der Vorgängergeneration. In Spielen fällt die Mehrleistung dagegen deutlich geringer aus: Bei gleichzeitiger Belastung der CPU kann die Grafikeinheit ihren starken Turbo-Boost nur sehr eingeschränkt ausschöpfen, da die niedrige TDP der ULV-Modelle (15 Watt) zu limitieren beginnt. Obwohl die HD 5000 mit 40 Execution Units (EUs) doppelt so viele Ausführungseinheiten wie die HD Graphics 4600 besitzt (HD 4000 : 16 EUs), ist die Grafikleistung darum dennoch etwas schwächer. Unterm Strich liegt die HD 5000 damit knapp hinter AMDs Radeon HD 7660G und auf dem Niveau einer dedizierte Radeon HD 7650M . Aktuelle 3D-Spiele (Stand 2013) können in niedrigen, seltener auch mittleren Einstellungen flüssig dargestellt werden.
Der Stromverbrauch ist dank des 22-Nanometer-Prozesses mit Tri-Gate-Transistoren relativ gering und wird dynamisch vom TDP-Budget des gesamten Chips abgezweigt. Die HD 5000 wird zunächst in einigen Dual-Core-Modellen der 15-Watt-Klasse (ULV) eingesetzt, beispielsweise dem Core i7-4650U .
Weitere Details zur Grafikkartenarchitektur der Haswell Generation finden Sie in unserem Artikel zur Vorstellung der Haswell-Generation .
Intel HD Graphics (Sandy Bridge) ► remove from comparison
Die Intel HD Graphics (Family) ist eine Prozessorgrafikkarte in den billigen Celeron und Pentium Modellen der Sandy Bridge Familie (2. Generation Core Prozessoren). Sie ist nicht baugleich zur gleichnamigen Intel HD Graphics in den Arrandale Prozessoren sondern mit der Intel HD Graphics 2000 in den Core i3-2xxx, i5-2xxx und i7-2xxx Desktop Prozessoren. Je nach Prozessor wird sie mit unterschiedlichem Basistakt und auch Turbo Boost Takt betrieben. Derzeit gibt es drei Geschwindigkeitsstufen (mit Beispielprozessoren):
Stromspar z.B. Intel Celeron 847: Basis: 350MHz, Turbo 800MHzCeleron z.B. Intel Celeron B810: Basis: 650MHz, Turbo 950MHzPentium z.B. Intel Pentium B950: Basis: 650MHz, Turbo 1100MHzDadurch ist die Performance der Grafikkarte (besonders bei den langsam getakteten Stromsparprozessoren) sehr unterschiedlich. In den normalen Celeron und Pentium Modellen mit 650MHz Grundtakt liegt die Leistung in etwa auf dem Niveau der alten Nvidia GeForce 9400M Chipsatzgrafik. Auch die geringe Prozessorleistung von Einkern-Celeron CPUs kann sich aber auch stark auf die Grafikperformance auswirken. Im Celeron B710 waren z.B. viele Spiele nicht spielbar, die im Pentium B960 flüssig liefen (obwohl die Grafiktaktung vergleichbar ist).
Wie die Intel HD Graphics 3000 und 2000, kann die Prozessorgrafik auf den integrierten Last Level Cache (Level 3 Cache) im Prozessor zugreifen. Diesen teilt sie sich mit dem Prozessor, wobei in den günstigen CPUs nur 2 MB verbaut sind.
Wie bei den Ivy Bridge basierten Grafikkarten, wird anscheinend auch bei Sandy Bridge 2x Antialiasing per Software aus dem 4x Antialiasing errechnet. Daher ergibt sich kein Geschwindigkeitsunterschied zwischen 2x und 4x AA. Im Unigine Valley Benchmark erreichten wir als Bestätigung bei 2x AA und 4x AA das selbe Ergebnis (HD Graphics 3000 ULV im i7-2637M).
Auch bei den Features wurde bei den günstigen Prozessoren und der integrierten Grafik gespart. Z.B. sind die Funktionen Quick Sync (zur En- und Decodierung von HD Videos), in Tru 3D und Clear Video HD deaktiviert.
Intel HD Graphics (Cherry Trail) ► remove from comparison
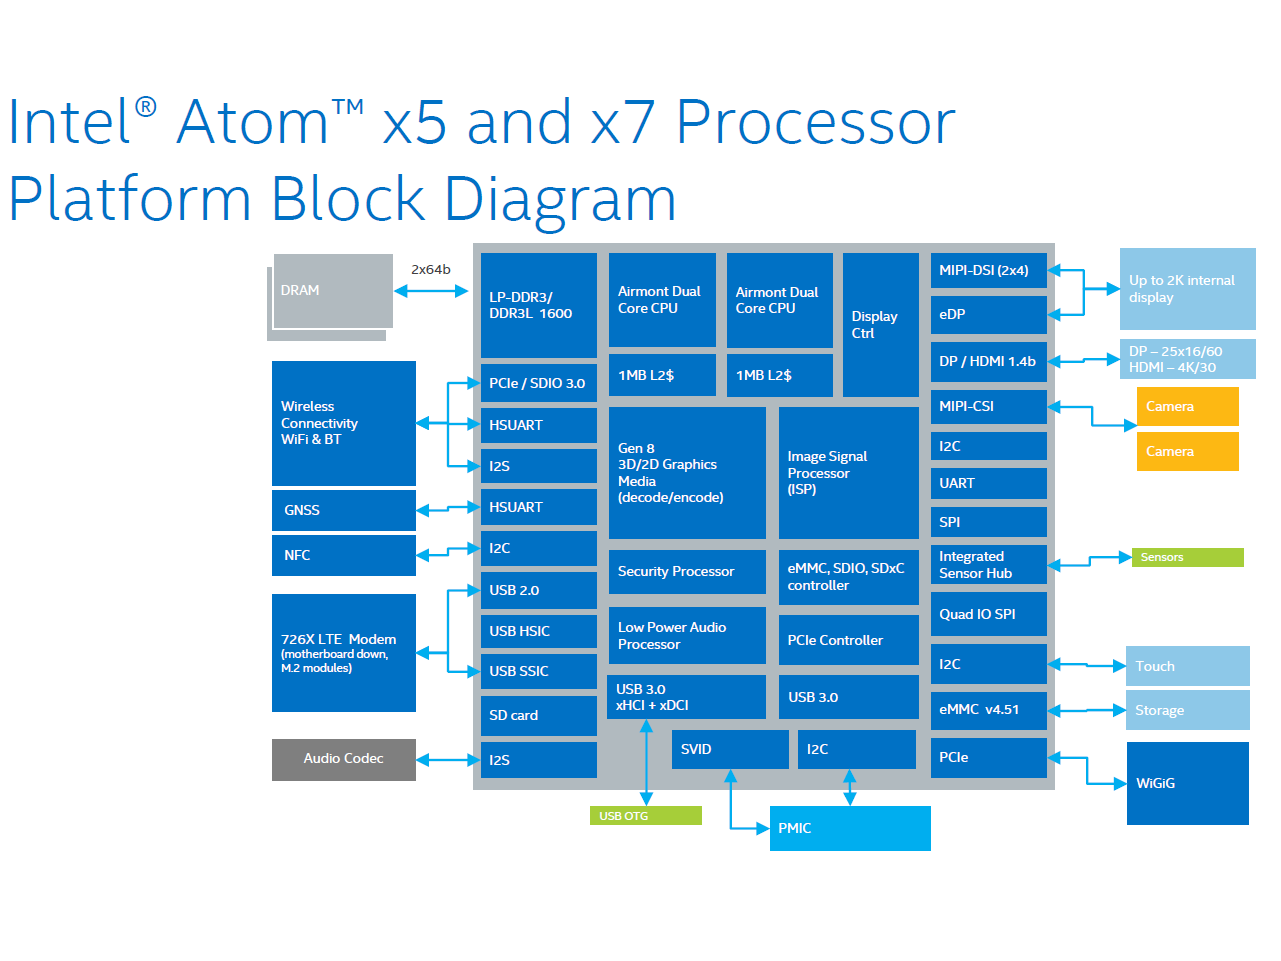
Die Intel HD Graphics (Cherry Trail) ist eine in den Tablet-SoCs der Cherry-Trail-Serie (z.B. Atom x7-Z8700 ) integrierte Grafikeinheit. Sie basiert auf der gleichen Architektur wie die GPU verschiedener Broadwell-Prozessoren (z.B. HD Graphics 5300 ), bietet allerdings deutlich weniger Shadereinheiten und geringere Taktraten. Die genauen Spezifikationen hängen vom jeweiligen SoC ab:
Die schnellste Variante mit 16 EUs und maximal 600 MHz schlägt die ältere HD Graphics (Bay Trail) um Faktor zwei, womit sich die GPU etwas oberhalb einer Qualcomm Adreno 330 oder PowerVR G6430 , jedoch deutlich unter einer Adreno 420 oder GX6450 einordnet. Auch Nvidias Tegra-SoCs K1 und X1 rechnen weitaus schneller.
Unter Windows werden sich Anwender deshalb weiter auf sehr alte und anspruchslose Spiele beschränken müssen, wohingegen moderne Android-Games auch in hohen Auflösungen zumeist flüssig dargestellt werden sollten. Der x7-Z8700 war z.B. nur knapp in der Lage Team Fortress 2 in minimalen Details und 1280x720 flüssig wiederzugeben (11 - 69 fps).
Videos kann die GPU auch in 4K/H.265 flüssig wiedergeben (je nach Bitrate und Farbtiefe).
Die Intel HD Graphics Grafikkarte in den Cherry Trail SoCs unterstützt nach unseren Tests mit dem MS Surface 3 mit Atom x7-Z8700 nur DisplayPort 1.1 und damit lediglich 30 Hz bei 4K (3.840 x 2.160).
Intel HD Graphics 5000 Intel HD Graphics (Sandy Bridge) Intel HD Graphics (Cherry Trail) HD Graphics Serie Codename Haswell GT3 Sandy Bridge Cherry Trail Architektur Gen. 7.5 Haswell Gen. 6 Sandy Bridge Gen. 8 Pipelines 40 - unified 6 - unified 16 - unified Kerntakt 200 - 1100 (Boost) MHz 350 - 1100 (Boost) MHz 200 - 600 (Boost) MHz Speicherbandbreite 64/128 Bit 64/128 Bit 64/128 Bit Shared Memory ja ja ja API DirectX 11.1, Shader 5.0, OpenGL 4.0 DirectX 10.1, Shader 4.1 DirectX 12 (FL 11_1), Shader 5.0, OpenGL 4.3 Herstellungsprozess 22 nm 32 nm 14 nm Features QuickSync Erscheinungsdatum 05.06.2013 01.05.2011 02.03.2015 Herstellerseite www.intel.com
CPU in HD Graphics 5000 GPU Base Speed GPU Boost / Turbo Intel Core i7-4650U 2 x 1700 MHz, 15 W 200 MHz 1100 MHz Intel Core i7-4550U 2 x 1500 MHz, 15 W 200 MHz 1100 MHz Intel Core i5-4360U 2 x 1500 MHz, 15 W 200 MHz 1100 MHz » show 3 more Intel Core i5-4350U 2 x 1400 MHz, 15 W 200 MHz 1100 MHz Intel Core i5-4260U 2 x 1400 MHz, 15 W 200 MHz 1000 MHz Intel Core i5-4250U 2 x 1300 MHz, 15 W 200 MHz 1000 MHz min. - max. 200 MHz 1000 - 1100 MHz
CPU in HD Graphics (Sandy Bridge) GPU Base Speed GPU Boost / Turbo Intel Pentium G860 2 x 3000 MHz, 65 W 650 MHz 1100 MHz Intel Pentium B980 2 x 2400 MHz, 35 W 650 - 1100 MHz ? MHz Intel Pentium B970 2 x 2300 MHz, 35 W 650 MHz 1150 MHz » show 23 more Intel Pentium B960 2 x 2200 MHz, 35 W 650 MHz 1100 MHz Intel Pentium B950 2 x 2100 MHz, 35 W 650 MHz 1100 MHz Intel Pentium B940 2 x 2000 MHz, 35 W 650 MHz 1100 MHz Intel Celeron B840 2 x 1900 MHz, 35 W 650 MHz 950 MHz Intel Celeron B830 2 x 1800 MHz, 35 W 650 MHz 950 MHz Intel Celeron B820 2 x 1700 MHz, 35 W 650 MHz 1050 MHz Intel Celeron B815 2 x 1600 MHz, 35 W 650 MHz 1050 MHz Intel Celeron B810 2 x 1600 MHz, 35 W 650 MHz 950 MHz Intel Pentium 997 2 x 1600 MHz, 17 W 350 MHz 1000 MHz Intel Pentium 987 2 x 1500 MHz, 17 W 350 MHz 1000 MHz Intel Celeron 887 2 x 1500 MHz, 17 W 350 MHz 1000 MHz Intel Celeron B800 2 x 1500 MHz, 35 W 650 MHz 1000 MHz Intel Pentium 977 2 x 1400 MHz, 17 W 350 MHz 1000 MHz Intel Celeron 877 2 x 1400 MHz, 17 W 350 MHz 1000 MHz Intel Pentium 967 2 x 1300 MHz, 17 W 350 MHz 1000 MHz Intel Celeron 867 2 x 1300 MHz, 17 W 350 MHz 1000 MHz Intel Pentium 957 2 x 1200 MHz, 17 W 350 MHz 800 MHz Intel Celeron B730 1 x 1800 MHz, 35 W 650 MHz 1000 MHz Intel Celeron 847 2 x 1100 MHz, 17 W 350 MHz 800 MHz Intel Celeron 807 1 x 1500 MHz, 17 W 350 MHz 950 MHz Intel Celeron B720 1 x 1700 MHz, 35 W 650 MHz 1000 MHz Intel Celeron B710 1 x 1600 MHz, 35 W 650 MHz 1000 MHz Intel Celeron 797 1 x 1400 MHz, 35 W 350 MHz 950 MHz min. - max. 200 - 650 - 1100 MHz 800 - 1150 MHz
CPU in HD Graphics (Cherry Trail) GPU Base Speed GPU Boost / Turbo Intel Atom x7-Z8700 4 x 1600 MHz 200 MHz 600 MHz Intel Atom x5-Z8500 4 x 1440 MHz 200 MHz 600 MHz Intel Atom x5-Z8350 4 x 1440 MHz 200 MHz 500 MHz » show 2 more Intel Atom x5-Z8300 4 x 1440 MHz 200 MHz 500 MHz Intel Atom x5-E8000 4 x 1040 MHz, 5 W 320 MHz ? MHz min. - max. 200 - 650 - 1100 MHz ? - 1150 MHz
Benchmarks Performance Rating - 3DMark 11 + Fire Strike + Time Spy - HD Graphics 5000
0.3 pt (1%)
...
...
max:
Performance Rating - 3DMark 11 + Fire Strike + Time Spy - HD Graphics (Cherry Trail)
0.1 pt (0%)
Intel HD Graphics (Cherry Trail)
...
max:
3DMark - 3DMark Ice Storm Unlimited Graphics
65904 Points (7%)
min: 18563 avg: 20873 median: 19303 (2%) max: 27537 Points
3DMark - 3DMark Ice Storm Extreme Graphics
37346 Points (5%)
3DMark - 3DMark Cloud Gate Score
min: 4331 avg: 4586 median: 4496.5 (5%) max: 5059 Points
min: 1386 avg: 1452 median: 1451.5 (2%) max: 1517 Points
min: 769 avg: 1454 median: 1488 (2%) max: 1905 Points
3DMark - 3DMark Cloud Gate Graphics
min: 5381 avg: 5981 median: 5693.5 (1%) max: 6762 Points
min: 1389 avg: 1405 median: 1404.5 (0%) max: 1420 Points
min: 1537 avg: 1851 median: 1783.5 (0%) max: 2272 Points
3DMark - 3DMark Fire Strike Standard Score
min: 583 avg: 669 median: 651 (1%) max: 808 Points
min: 174 avg: 390.4 median: 248 (0%) max: 1059 Points
3DMark - 3DMark Fire Strike Standard Graphics
min: 620 avg: 725 median: 715.5 (1%) max: 875 Points
min: 193 avg: 233 median: 225 (0%) max: 281 Points
3DMark - 3DMark Ice Storm Graphics
min: 35584 avg: 41867 median: 40454 (5%) max: 52302 Points
min: 13132 avg: 13747 median: 13746.5 (2%) max: 14361 Points
min: 7544 avg: 16078 median: 17063.5 (2%) max: 23395 Points
3DMark - 3DMark Sling Shot (ES 3.0) Unlimited
min: 1445 avg: 1525 median: 1525 (7%) max: 1605 Points
3DMark - 3DMark Sling Shot (ES 3.0) Unlimited Graphics
min: 1598 avg: 1684 median: 1684 (4%) max: 1770 Points
3DMark - 3DMark Sling Shot Extreme (ES 3.1) Unlimited
min: 1072 avg: 1215 median: 1159 (6%) max: 1414 Points
3DMark - 3DMark Sling Shot Extreme (ES 3.1) Unlimited Graphics
min: 1058 avg: 1251 median: 1142 (3%) max: 1554 Points
3DMark 11 - 3DM11 Performance Score
min: 962 avg: 1088 median: 1125.5 (2%) max: 1163 Points
min: 314 avg: 359.4 median: 343 (0%) max: 562 Points
3DMark 11 - 3DM11 Performance GPU
min: 859 avg: 993 median: 1033.5 (1%) max: 1072 Points
min: 278 avg: 319.9 median: 298 (0%) max: 494 Points
3DMark Vantage + Intel HD Graphics 5000 3DMark Vantage - 3DM Vant. Perf. total
min: 3418 avg: 4231 median: 4276.5 (1%) max: 4734 Points
3DM Vant. Perf. total + Intel HD Graphics (Sandy Bridge) min: 737 avg: 932 median: 976 (0%) max: 1057 Points
3DM Vant. Perf. GPU no PhysX + Intel HD Graphics 5000 3DMark Vantage - 3DM Vant. Perf. GPU no PhysX
min: 2917 avg: 3639 median: 3665 (2%) max: 4108 Points
3DM Vant. Perf. GPU no PhysX + Intel HD Graphics (Sandy Bridge) min: 581 avg: 736 median: 767.5 (0%) max: 831 Points
3DMark 2001SE - 3DMark 2001 - Standard
min: 9769 avg: 11443 median: 11429.5 (12%) max: 13145 Points
3DMark 03 - 3DMark 03 - Standard
min: 15752 avg: 18768 median: 18768 (10%) max: 21784 Points
min: 2701 avg: 6189 median: 6390 (3%) max: 7772 Points
3DMark 05 - 3DMark 05 - Standard
min: 9623 avg: 9763 median: 9763 (11%) max: 9903 Points
min: 2000 avg: 4691 median: 4768 (5%) max: 5917 Points
3DMark 06 3DMark 06 - Standard 1280x1024 + Intel HD Graphics 5000
min: 4751 avg: 5775 median: 5940 (8%) max: 6160 Points
3DMark 06 - Standard 1280x1024 + Intel HD Graphics (Sandy Bridge)
min: 1027 avg: 2435 median: 2509 (3%) max: 3230 Points
3DMark 06 - Standard 1280x1024 + Intel HD Graphics (Cherry Trail)
min: 2403 avg: 2833 median: 2595 (3%) max: 3330 Points
3DMark 06 - Standard 1280x800 + Intel HD Graphics 5000
6675 Points (9%)
3DMark 06 - Score Unknown Settings + Intel HD Graphics (Sandy Bridge)
min: 2365 avg: 2618 median: 2438 (3%) max: 3050 Points
3DMark 06 - Standard 1366x768 + Intel HD Graphics (Sandy Bridge)
3002 Points (4%)
3DMark 06 - Standard 1280x768 + Intel HD Graphics (Sandy Bridge)
2433 Points (3%)
3DMark 06 - Standard 1024x768 + Intel HD Graphics (Sandy Bridge)
3530 Points (5%)
3DMark 06 - Standard 1024x768 + Intel HD Graphics (Cherry Trail)
2877 Points (4%)
Unigine Valley 1.0 - Unigine Valley 1.0 DX
1.2 fps (0%)
Unigine Heaven 3.0 - Unigine Heaven 3.0 DX 11
12.1 fps (4%)
Unigine Heaven 3.0 - Unigine Heaven 3.0 OpenGL
12.1 fps (5%)
Unigine Heaven 2.1 - Heaven 2.1 high
min: 12.3 avg: 13 median: 13.1 (2%) max: 13.5 fps
min: 5.3 avg: 5.7 median: 5.5 (1%) max: 7 fps
5.7 fps (1%)
SPECviewperf 11 + Intel HD Graphics 5000 SPECviewperf 11 - specvp11 snx-01
min: 1.26 avg: 1.5 median: 1.5 (1%) max: 1.64 fps
specvp11 snx-01 + Intel HD Graphics (Sandy Bridge) 0.1 fps (0%)
specvp11 tcvis-02 + Intel HD Graphics 5000 SPECviewperf 11 - specvp11 tcvis-02
min: 1.77 avg: 2.1 median: 2.1 (1%) max: 2.51 fps
specvp11 tcvis-02 + Intel HD Graphics (Sandy Bridge) 0.1 fps (0%)
specvp11 sw-02 + Intel HD Graphics 5000 SPECviewperf 11 - specvp11 sw-02
min: 7.95 avg: 9.9 median: 9.9 (8%) max: 11.8 fps
specvp11 proe-05 + Intel HD Graphics 5000 SPECviewperf 11 - specvp11 proe-05
min: 1.42 avg: 1.6 median: 1.6 (2%) max: 1.78 fps
specvp11 proe-05 + Intel HD Graphics (Sandy Bridge) 0.3 fps (0%)
specvp11 maya-03 + Intel HD Graphics 5000 SPECviewperf 11 - specvp11 maya-03
min: 12.95 avg: 14.2 median: 14.2 (11%) max: 15.43 fps
specvp11 lightwave-01 + Intel HD Graphics 5000 SPECviewperf 11 - specvp11 lightwave-01
min: 13.34 avg: 14.5 median: 14.5 (16%) max: 15.62 fps
specvp11 ensight-04 + Intel HD Graphics 5000 SPECviewperf 11 - specvp11 ensight-04
min: 2.06 avg: 2.1 median: 2.1 (1%) max: 2.11 fps
specvp11 ensight-04 + Intel HD Graphics (Sandy Bridge) 0.1 fps (0%)
specvp11 catia-03 + Intel HD Graphics 5000 SPECviewperf 11 - specvp11 catia-03
4.5 fps (2%)
Windows 7 Experience Index - Win7 Gaming graphics
min: 6.5 avg: 6.6 median: 6.6 (84%) max: 6.7 Points
min: 5.4 avg: 5.7 median: 5.7 (72%) max: 5.8 Points
Windows 7 Experience Index - Win7 Graphics
min: 5.8 avg: 5.9 median: 5.9 (74%) max: 5.9 Points
min: 3.8 avg: 4.5 median: 4.5 (57%) max: 5.1 Points
Cinebench R10 Cinebench R10 Shading (32bit) + Intel HD Graphics 5000 Cinebench R10 - Cinebench R10 Shading (32bit)
min: 5143 avg: 6901 median: 6946.5 (5%) max: 7959 Points
Cinebench R10 Shading (32bit) + Intel HD Graphics (Sandy Bridge)
min: 1030 avg: 2571 median: 2577 (2%) max: 3508 Points
Cinebench R10 Shading (32bit) + Intel HD Graphics (Cherry Trail)
min: 1192 avg: 2009 median: 1973 (1%) max: 2551 Points
Cinebench R11.5 Cinebench R11.5 OpenGL 64 Bit + Intel HD Graphics 5000 Cinebench R11.5 - Cinebench R11.5 OpenGL 64 Bit
min: 15.01 avg: 19.6 median: 19.6 (7%) max: 24.76 fps
Cinebench R11.5 OpenGL 64 Bit + Intel HD Graphics (Sandy Bridge)
min: 2.68 avg: 6.3 median: 6.6 (2%) max: 7.93 fps
Cinebench R11.5 OpenGL 64 Bit + Intel HD Graphics (Cherry Trail)
min: 4.01 avg: 8.8 median: 8.4 (3%) max: 11.71 fps
Cinebench R15 + Intel HD Graphics 5000 Cinebench R15 - Cinebench R15 OpenGL 64 Bit
min: 24.15 avg: 27.4 median: 27.4 (2%) max: 30.64 fps
Cinebench R15 OpenGL 64 Bit + Intel HD Graphics (Cherry Trail)
min: 6.64 avg: 10.3 median: 9.7 (1%) max: 15.52 fps
Cinebench R15 OpenGL Ref. Match 64 Bit + Intel HD Graphics 5000 Cinebench R15 - Cinebench R15 OpenGL Ref. Match 64 Bit
min: 63.3 avg: 81.1 median: 80.7 (81%) max: 99.6 %
Cinebench R15 OpenGL Ref. Match 64 Bit + Intel HD Graphics (Cherry Trail)
min: 98 avg: 98 median: 98 (98%) max: 98.6 %
GFXBench - GFXBench Car Chase Offscreen
min: 6.3 avg: 7.3 median: 7 (1%) max: 9 fps
GFXBench 3.1 - GFXBench Manhattan ES 3.1 Offscreen
min: 9.2 avg: 10.8 median: 11 (0%) max: 13 fps
GFXBench 3.0 - GFXBench 3.0 Manhattan Offscreen
22.5 fps (1%)
min: 8.4 avg: 13.8 median: 13.5 (1%) max: 18 fps
GFXBench (DX / GLBenchmark) 2.7 + Intel HD Graphics 5000 GFXBench (DX / GLBenchmark) 2.7 - GFXBench T-Rex HD Offscreen C24Z16
min: 62 avg: 72.5 median: 72.5 (1%) max: 83 fps
GFXBench T-Rex HD Offscreen C24Z16 + Intel HD Graphics (Cherry Trail) min: 22 avg: 30.5 median: 32 (0%) max: 38.5 fps
Geekbench 6.2 - Geekbench 6.2 GPU OpenCL
15316 Points (4%)
Geekbench 6.2 - Geekbench 6.2 GPU Vulkan
19700 Points (6%)
LuxMark v2.0 64Bit - LuxMark v2.0 Room GPU
min: 139 avg: 187 median: 201 (1%) max: 221 Samples/s
min: 48 avg: 58.7 median: 59 (0%) max: 69 Samples/s
LuxMark v2.0 64Bit - LuxMark v2.0 Sala GPU
min: 286 avg: 305.3 median: 306 (1%) max: 324 Samples/s
min: 69 avg: 87.7 median: 89 (0%) max: 105 Samples/s
ComputeMark v2.1 - ComputeMark v2.1 Result
min: 775 avg: 817 median: 816.5 (1%) max: 858 Points
277 Points (0%)
Average Benchmarks Intel HD Graphics 5000 → 100% n=7 Average Benchmarks Intel HD Graphics (Sandy Bridge) → 35% n=7 Average Benchmarks Intel HD Graphics (Cherry Trail) → 38% n=7
- Bereich der Benchmarkergebnisse für diese Grafikkarte
- Durchschnittliche Benchmarkergebnisse für diese Grafikkarte
* Smaller numbers mean a higher performance
1 This benchmark is not used for the average calculation
Spiele-Benchmarks Die folgenden Benchmarks basieren auf unseren Spieletests mit Testnotebooks. Die Performance dieser Grafikkarte bei den gelisteten Spielen ist abhängig von der verwendeten CPU, Speicherausstattung, Treiber und auch Betriebssystem. Dadurch müssen die untenstehenden Werte nicht repräsentativ sein. Detaillierte Informationen über das verwendete System sehen Sie nach einem Klick auf den fps-Wert.
HD Graphics (Cherry Trail):
21.4 fps
HD Graphics (Cherry Trail):
15.5 fps
HD Graphics (Cherry Trail):
22.6 [X] Chuwi Hi12 Intel Atom x5-Z8300 1.4GHz
HD Graphics (Cherry Trail)
min:
21 fps, max:
27 fps
fps
HD Graphics (Cherry Trail):
11.5 fps
HD Graphics (Cherry Trail):
7 fps
HD Graphics (Cherry Trail):
8.8 fps
HD Graphics (Cherry Trail):
4.8 fps
HD Graphics (Cherry Trail):
8.1 fps
HD Graphics (Cherry Trail):
3.9 fps
HD Graphics (Cherry Trail):
13.9 [X] Chuwi Hi12 Intel Atom x5-Z8300 1.4GHz
HD Graphics (Cherry Trail)
min:
7 fps, max:
19 fps
16.8 ~ 15 fps
HD Graphics (Cherry Trail):
15.1 fps
HD Graphics (Cherry Trail):
9.8 fps
HD Graphics (Cherry Trail):
20 [X] Chuwi Hi12 Intel Atom x5-Z8300 1.4GHz
HD Graphics (Cherry Trail)
min:
18 fps
fps
HD Graphics (Cherry Trail):
15.2 [X] Chuwi Hi12 Intel Atom x5-Z8300 1.4GHz
HD Graphics (Cherry Trail)
min:
13 fps
fps
HD Graphics (Cherry Trail):
7.2 [X] Chuwi Hi12 Intel Atom x5-Z8300 1.4GHz
HD Graphics (Cherry Trail)
min:
6 fps
fps
HD Graphics (Cherry Trail):
20.1 fps
HD Graphics (Cherry Trail):
12.5 fps
100%
HD Graphics 5000:
19.2 fps
56%
HD Graphics (Cherry Trail):
10.8 (!) [X] Microsoft Surface 3 Intel Atom x7-Z8700 1.6GHz
HD Graphics (Cherry Trail)
fps
100%
HD Graphics 5000:
16 fps
100%
HD Graphics 5000:
4.4 fps
100%
HD Graphics 5000:
2.6 fps
100%
HD Graphics 5000:
20.8 fps
100%
HD Graphics 5000:
15.1 fps
100%
HD Graphics 5000:
7 fps
100%
HD Graphics 5000:
4.3 fps
100%
HD Graphics 5000:
12.7 fps
100%
HD Graphics 5000:
9.6 fps
100%
HD Graphics 5000:
5.5 fps
100%
HD Graphics 5000:
2.9 fps
100%
HD Graphics 5000:
15.8 fps
100%
HD Graphics 5000:
10.6 fps
100%
HD Graphics 5000:
17.4 fps
55%
HD Graphics (Cherry Trail):
9.5 fps
100%
HD Graphics 5000:
12 fps
48%
HD Graphics (Cherry Trail):
5.7 fps
100%
HD Graphics 5000:
4.5 fps
100%
HD Graphics 5000:
2.1 fps
100%
HD Graphics 5000:
14.3 fps
100%
HD Graphics 5000:
10.6 fps
100%
HD Graphics 5000:
5.4 fps
100%
HD Graphics 5000:
25.4 fps
100%
HD Graphics 5000:
16.2 fps
100%
HD Graphics 5000:
9.7 fps
100%
HD Graphics 5000:
15.5 fps
105%
HD Graphics (Cherry Trail):
16.2 fps
100%
HD Graphics 5000:
12.2 fps
50%
HD Graphics (Cherry Trail):
6.1 fps
100%
HD Graphics 5000:
51 fps
31%
HD Graphics (Cherry Trail):
16 fps
100%
HD Graphics 5000:
35 fps
34%
HD Graphics (Cherry Trail):
12 fps
100%
HD Graphics 5000:
20 fps
100%
HD Graphics 5000:
13 fps
100%
HD Graphics 5000:
14.2 fps
100%
HD Graphics 5000:
10.6 fps
100%
HD Graphics 5000:
14.7 fps
100%
HD Graphics 5000:
9.2 fps
100%
HD Graphics 5000:
28.9 fps
100%
HD Graphics 5000:
20.9 fps
100%
HD Graphics 5000:
11.4 fps
100%
HD Graphics 5000:
20.1 fps
100%
HD Graphics 5000:
13 fps
100%
HD Graphics 5000:
7.2 fps
100%
HD Graphics 5000:
36.2 fps
43%
HD Graphics (Cherry Trail):
15.6 fps
100%
HD Graphics 5000:
28.1 fps
100%
HD Graphics 5000:
17.4 fps
100%
HD Graphics 5000:
168.3 fps
100%
HD Graphics 5000:
32.8 fps
100%
HD Graphics 5000:
14.2 fps
56%
HD Graphics (Cherry Trail):
5.5 10 ~ 8 fps
100%
HD Graphics 5000:
10 fps
100%
HD Graphics 5000:
28.7 fps
100%
HD Graphics 5000:
17.6 fps
100%
HD Graphics 5000:
6.6 fps
100%
HD Graphics 5000:
5.2 fps
100%
HD Graphics 5000:
85.7 fps
29%
HD Graphics (Cherry Trail):
22 27.3 ~ 25 fps
100%
HD Graphics 5000:
30.2 fps
43%
HD Graphics (Cherry Trail):
12.5 13.5 ~ 13 fps
100%
HD Graphics 5000:
14.9 fps
100%
HD Graphics 5000:
12.5 fps
100%
HD Graphics 5000:
17 18.1 ~ 18 fps
100%
HD Graphics 5000:
10.9 11.6 ~ 11 fps
100%
HD Graphics 5000:
27.2 fps
100%
HD Graphics 5000:
22.1 fps
100%
HD Graphics 5000:
10.7 fps
100%
HD Graphics 5000:
33.2 fps
100%
HD Graphics 5000:
20.2 fps
100%
HD Graphics 5000:
13.2 fps
100%
HD Graphics 5000:
11.9 14.8 ~ 13 fps
100%
HD Graphics 5000:
8.4 9.7 ~ 9 fps
100%
HD Graphics 5000:
7.6 fps
100%
HD Graphics 5000:
3.9 fps
HD Graphics (Sandy Bridge):
11.8 [X] Compal Barebone Intel Pentium B960 2.2GHz
HD Graphics (Sandy Bridge)
fps
HD Graphics (Sandy Bridge):
6.9 [X] Compal Barebone Intel Pentium B960 2.2GHz
HD Graphics (Sandy Bridge)
fps
HD Graphics (Sandy Bridge):
3.4 [X] Compal Barebone Intel Pentium B960 2.2GHz
HD Graphics (Sandy Bridge)
fps
HD Graphics (Sandy Bridge):
2.5 [X] Compal Barebone Intel Pentium B960 2.2GHz
HD Graphics (Sandy Bridge)
fps
100%
HD Graphics 5000:
24 fps
100%
HD Graphics 5000:
20.5 fps
100%
HD Graphics 5000:
6.2 fps
100%
HD Graphics 5000:
28.6 fps
47%
HD Graphics (Cherry Trail):
13.3 fps
100%
HD Graphics 5000:
19.9 fps
100%
HD Graphics 5000:
13.3 fps
100%
HD Graphics 5000:
51 fps
47%
HD Graphics (Sandy Bridge):
24 [X] Compal Barebone Intel Pentium B960 2.2GHz
HD Graphics (Sandy Bridge)
min:
16 fps
fps
100%
HD Graphics 5000:
34 fps
47%
HD Graphics (Sandy Bridge):
16 [X] Compal Barebone Intel Pentium B960 2.2GHz
HD Graphics (Sandy Bridge)
min:
13 fps
fps
100%
HD Graphics 5000:
28 fps
100%
HD Graphics 5000:
12 fps
100%
HD Graphics 5000:
165.1 fps
57%
HD Graphics (Sandy Bridge):
94 [X] Compal Barebone Intel Pentium B960 2.2GHz
HD Graphics (Sandy Bridge)
fps
100%
HD Graphics 5000:
100.2 fps
52%
HD Graphics (Sandy Bridge):
52 [X] Compal Barebone Intel Pentium B960 2.2GHz
HD Graphics (Sandy Bridge)
min:
41 fps
fps
100%
HD Graphics 5000:
71.4 fps
34%
HD Graphics (Sandy Bridge):
24 (!) [X] Compal Barebone Intel Pentium B960 2.2GHz
HD Graphics (Sandy Bridge)
fps
100%
HD Graphics 5000:
39.3 fps
31%
HD Graphics (Sandy Bridge):
12 [X] Compal Barebone Intel Pentium B960 2.2GHz
HD Graphics (Sandy Bridge)
fps
100%
HD Graphics 5000:
39.8 fps
100%
HD Graphics 5000:
29.4 fps
100%
HD Graphics 5000:
21.6 fps
100%
HD Graphics 5000:
6.6 fps
HD Graphics (Cherry Trail):
58 fps
HD Graphics (Cherry Trail):
47 fps
100%
HD Graphics 5000:
59.6 69.8 ~ 65 fps
63%
HD Graphics (Sandy Bridge):
41.2 [X] Compal Barebone Intel Pentium B960 2.2GHz
HD Graphics (Sandy Bridge)
fps
46%
HD Graphics (Cherry Trail):
29.7 fps
100%
HD Graphics 5000:
31.5 36.8 ~ 34 fps
71%
HD Graphics (Sandy Bridge):
24.2 [X] Compal Barebone Intel Pentium B960 2.2GHz
HD Graphics (Sandy Bridge)
fps
49%
HD Graphics (Cherry Trail):
16.5 fps
100%
HD Graphics 5000:
14.4 15.5 ~ 15 fps
59%
HD Graphics (Sandy Bridge):
8.9 [X] Compal Barebone Intel Pentium B960 2.2GHz
HD Graphics (Sandy Bridge)
fps
100%
HD Graphics 5000:
13.3 fps
100%
HD Graphics 5000:
10.4 fps
100%
HD Graphics 5000:
6 fps
100%
HD Graphics 5000:
58.6 fps
49%
HD Graphics (Sandy Bridge):
29 [X] Compal Barebone Intel Pentium B960 2.2GHz
HD Graphics (Sandy Bridge)
fps
41%
HD Graphics (Cherry Trail):
24 fps
100%
HD Graphics 5000:
31.3 fps
51%
HD Graphics (Sandy Bridge):
16 [X] Compal Barebone Intel Pentium B960 2.2GHz
HD Graphics (Sandy Bridge)
fps
43%
HD Graphics (Cherry Trail):
13.5 fps
100%
HD Graphics 5000:
22.7 fps
100%
HD Graphics 5000:
12.5 fps
100%
HD Graphics 5000:
18.8 18.9 ~ 19 fps
100%
HD Graphics 5000:
13.9 13.9 ~ 14 fps
100%
HD Graphics 5000:
8.6 10.4 ~ 10 fps
100%
HD Graphics 5000:
7.7 fps
26%
HD Graphics (Cherry Trail):
2.4 2.6 ~ 2 fps
HD Graphics (Sandy Bridge):
100 [X] Compal Barebone Intel Pentium B950 2.1GHz
HD Graphics (Sandy Bridge)
fps
HD Graphics (Sandy Bridge):
16.9 [X] Compal Barebone Intel Pentium B950 2.1GHz
HD Graphics (Sandy Bridge)
fps
HD Graphics (Sandy Bridge):
9.5 [X] Compal Barebone Intel Pentium B950 2.1GHz
HD Graphics (Sandy Bridge)
fps
HD Graphics (Sandy Bridge):
2.8 [X] Compal Barebone Intel Pentium B950 2.1GHz
HD Graphics (Sandy Bridge)
fps
HD Graphics (Sandy Bridge):
9.7 [X] Compal Barebone Intel Pentium B950 2.1GHz
HD Graphics (Sandy Bridge)
fps
28%
HD Graphics (Sandy Bridge):
14.6 [X] Compal Barebone Intel Pentium B950 2.1GHz
HD Graphics (Sandy Bridge)
fps
30%
HD Graphics (Sandy Bridge):
7.9 [X] Compal Barebone Intel Pentium B950 2.1GHz
HD Graphics (Sandy Bridge)
fps
50%
HD Graphics (Cherry Trail):
7 8.3 9 ~ 8 fps
100%
HD Graphics 5000:
7.9 8 9.5 ~ 8 fps
50%
HD Graphics (Cherry Trail):
3.7 3.8 ~ 4 fps
100%
HD Graphics 5000:
20.9 fps
100%
HD Graphics 5000:
13 fps
100%
HD Graphics 5000:
9.4 fps
HD Graphics (Sandy Bridge):
32.2 [X] Compal Barebone Intel Pentium B950 2.1GHz
HD Graphics (Sandy Bridge)
fps
HD Graphics (Sandy Bridge):
13.3 [X] Compal Barebone Intel Pentium B950 2.1GHz
HD Graphics (Sandy Bridge)
fps
HD Graphics (Sandy Bridge):
9.4 [X] Compal Barebone Intel Pentium B950 2.1GHz
HD Graphics (Sandy Bridge)
fps
HD Graphics (Cherry Trail):
34 fps
100%
HD Graphics 5000:
28.6 fps
100%
HD Graphics 5000:
19.2 fps
100%
HD Graphics 5000:
7.1 fps
100%
HD Graphics 5000:
16.6 fps
100%
HD Graphics 5000:
11.2 fps
100%
HD Graphics 5000:
22.3 fps
100%
HD Graphics 5000:
15.7 fps
100%
HD Graphics 5000:
7.3 fps
100%
HD Graphics 5000:
40.5 fps
35%
HD Graphics (Sandy Bridge):
13 [X] Compal Barebone Intel Pentium B950 2.1GHz
HD Graphics (Sandy Bridge)
14.2 [X] Intel Pentium G860, Intel DZ77GA-70K Desktop, DDR3-1333 Intel Pentium G860 3GHz
HD Graphics (Sandy Bridge)
~ 14 fps
100%
HD Graphics 5000:
28 fps
100%
HD Graphics 5000:
14.1 fps
HD Graphics (Sandy Bridge):
9.5 [X] Compal Barebone Intel Pentium B950 2.1GHz
HD Graphics (Sandy Bridge)
fps
HD Graphics (Sandy Bridge):
6.5 [X] Compal Barebone Intel Pentium B950 2.1GHz
HD Graphics (Sandy Bridge)
fps
HD Graphics (Sandy Bridge):
6.9 19.2 [X] Compal Barebone Intel Pentium B950 2.1GHz
HD Graphics (Sandy Bridge)
~ 13 fps
HD Graphics (Cherry Trail):
15.2 fps
HD Graphics (Sandy Bridge):
15.1 [X] Compal Barebone Intel Pentium B950 2.1GHz
HD Graphics (Sandy Bridge)
fps
HD Graphics (Cherry Trail):
11.6 fps
HD Graphics (Sandy Bridge):
13.3 [X] Compal Barebone Intel Pentium B950 2.1GHz
HD Graphics (Sandy Bridge)
fps
HD Graphics (Sandy Bridge):
44.4 [X] Compal Barebone Intel Pentium B950 2.1GHz
HD Graphics (Sandy Bridge)
fps
HD Graphics (Sandy Bridge):
11.8 [X] Compal Barebone Intel Pentium B950 2.1GHz
HD Graphics (Sandy Bridge)
fps
HD Graphics (Sandy Bridge):
9.1 [X] Compal Barebone Intel Pentium B950 2.1GHz
HD Graphics (Sandy Bridge)
fps
HD Graphics (Sandy Bridge):
14.8 43.8 55 65.9 66.2 68.3 76.2 80.6 84 [X] Compal Barebone Intel Pentium B950 2.1GHz
HD Graphics (Sandy Bridge)
96 [X] Intel Pentium G860, Intel DZ77GA-70K Desktop, DDR3-1333 Intel Pentium G860 3GHz
HD Graphics (Sandy Bridge)
~ 65 fps
HD Graphics (Sandy Bridge):
33.1 35 36.2 39.6 41.2 43.9 44.5 51 [X] Compal Barebone Intel Pentium B950 2.1GHz
HD Graphics (Sandy Bridge)
52 [X] Intel Pentium G860, Intel DZ77GA-70K Desktop, DDR3-1333 Intel Pentium G860 3GHz
HD Graphics (Sandy Bridge)
~ 42 fps
HD Graphics (Sandy Bridge):
17.2 17.2 17.5 19.1 19.4 22.9 [X] Compal Barebone Intel Pentium B950 2.1GHz
HD Graphics (Sandy Bridge)
24 [X] Intel Pentium G860, Intel DZ77GA-70K Desktop, DDR3-1333 Intel Pentium G860 3GHz
HD Graphics (Sandy Bridge)
~ 20 fps
HD Graphics (Sandy Bridge):
12 [X] Compal Barebone Intel Pentium B950 2.1GHz
HD Graphics (Sandy Bridge)
12.3 [X] Compal Barebone Intel Pentium B950 2.1GHz
HD Graphics (Sandy Bridge)
~ 12 fps
HD Graphics (Sandy Bridge):
24 fps
HD Graphics (Sandy Bridge):
15 fps
HD Graphics (Sandy Bridge):
12 fps
HD Graphics (Cherry Trail):
0 (!) [X] Microsoft Surface 3 Intel Atom x7-Z8700 1.6GHz
HD Graphics (Cherry Trail)
fps
HD Graphics (Cherry Trail):
0 (!) [X] Microsoft Surface 3 Intel Atom x7-Z8700 1.6GHz
HD Graphics (Cherry Trail)
fps
100%
HD Graphics 5000:
83 fps
100%
HD Graphics 5000:
46 fps
100%
HD Graphics 5000:
28 fps
HD Graphics (Sandy Bridge):
23 [X] Compal Barebone Intel Pentium B950 2.1GHz
HD Graphics (Sandy Bridge)
fps
HD Graphics (Sandy Bridge):
6 [X] Compal Barebone Intel Pentium B950 2.1GHz
HD Graphics (Sandy Bridge)
fps
HD Graphics (Sandy Bridge):
2 [X] Compal Barebone Intel Pentium B950 2.1GHz
HD Graphics (Sandy Bridge)
fps
HD Graphics (Sandy Bridge):
60 [X] Compal Barebone Intel Pentium B950 2.1GHz
HD Graphics (Sandy Bridge)
min:
45 fps, max:
75 fps
fps
HD Graphics (Sandy Bridge):
30.3 [X] Compal Barebone Intel Pentium B950 2.1GHz
HD Graphics (Sandy Bridge)
fps
HD Graphics (Sandy Bridge):
18.8 [X] Compal Barebone Intel Pentium B950 2.1GHz
HD Graphics (Sandy Bridge)
fps
HD Graphics (Cherry Trail):
20.3 fps
HD Graphics (Sandy Bridge):
9.7 [X] Compal Barebone Intel Pentium B950 2.1GHz
HD Graphics (Sandy Bridge)
fps
HD Graphics (Cherry Trail):
11.4 fps
HD Graphics (Sandy Bridge):
11 [X] Compal Barebone Intel Pentium B950 2.1GHz
HD Graphics (Sandy Bridge)
fps
HD Graphics (Sandy Bridge):
27 [X] Intel Pentium B950 2.1GHz
HD Graphics (Sandy Bridge)
fps
HD Graphics (Sandy Bridge):
13.4 [X] Intel Pentium B950 2.1GHz
HD Graphics (Sandy Bridge)
fps
HD Graphics (Sandy Bridge):
8.6 [X] Intel Pentium B950 2.1GHz
HD Graphics (Sandy Bridge)
fps
HD Graphics (Sandy Bridge):
5 [X] Intel Pentium B950 2.1GHz
HD Graphics (Sandy Bridge)
fps
100%
HD Graphics 5000:
54 58 59 ~ 57 fps
40%
HD Graphics (Sandy Bridge):
23 23.1 [X] Intel Pentium B950 2.1GHz
HD Graphics (Sandy Bridge)
~ 23 fps
49%
HD Graphics (Cherry Trail):
24.3 [X] Chuwi Hi12 Intel Atom x5-Z8300 1.4GHz
HD Graphics (Cherry Trail)
min:
20 fps, max:
29 fps
31.9 ~ 28 fps
100%
HD Graphics 5000:
38 42 ~ 40 fps
33%
HD Graphics (Sandy Bridge):
10.9 [X] Intel Pentium B950 2.1GHz
HD Graphics (Sandy Bridge)
15 ~ 13 fps
45%
HD Graphics (Cherry Trail):
16 [X] Chuwi Hi12 Intel Atom x5-Z8300 1.4GHz
HD Graphics (Cherry Trail)
min:
13 fps, max:
19 fps
19 ~ 18 fps
100%
HD Graphics 5000:
31 32 ~ 32 fps
28%
HD Graphics (Sandy Bridge):
6.8 [X] Intel Pentium B950 2.1GHz
HD Graphics (Sandy Bridge)
12 ~ 9 fps
100%
HD Graphics 5000:
13 19 21 ~ 18 fps
44%
HD Graphics (Sandy Bridge):
4.9 [X] Intel Pentium B950 2.1GHz
HD Graphics (Sandy Bridge)
11 ~ 8 fps
HD Graphics (Sandy Bridge):
8.8 [X] Intel Celeron B710 1.6GHz
HD Graphics (Sandy Bridge)
11 [X] Intel Pentium B950 2.1GHz
HD Graphics (Sandy Bridge)
~ 10 fps
HD Graphics (Sandy Bridge):
15 [X] Intel Celeron B710 1.6GHz
HD Graphics (Sandy Bridge)
16.3 16.7 22 [X] Intel Pentium B960 2.2GHz
HD Graphics (Sandy Bridge)
~ 18 fps
36%
HD Graphics (Sandy Bridge):
18 [X] Intel Celeron B710 1.6GHz
HD Graphics (Sandy Bridge)
18.9 19.8 21 [X] Intel Pentium B950 2.1GHz
HD Graphics (Sandy Bridge)
21.7 22 [X] Intel Pentium B960 2.2GHz
HD Graphics (Sandy Bridge)
22 22 ~ 21 fps
28%
HD Graphics (Sandy Bridge):
8 [X] Intel Celeron B710 1.6GHz
HD Graphics (Sandy Bridge)
8 8 9 [X] Intel Pentium B950 2.1GHz
HD Graphics (Sandy Bridge)
9.4 9.5 10 ~ 9 fps
44%
HD Graphics (Sandy Bridge):
8 fps
44%
HD Graphics (Cherry Trail):
8 fps
100%
HD Graphics 5000:
9 fps
44%
HD Graphics (Sandy Bridge):
4 fps
100%
HD Graphics 5000:
29.5 fps
58%
HD Graphics (Cherry Trail):
15.5 18.9 ~ 17 fps
100%
HD Graphics 5000:
18.4 fps
38%
HD Graphics (Sandy Bridge):
4.7 7.7 7.8 ~ 7 fps
43%
HD Graphics (Cherry Trail):
7.2 8.5 ~ 8 fps
100%
HD Graphics 5000:
11.6 fps
HD Graphics (Sandy Bridge):
22 [X] Intel Celeron B710 1.6GHz
HD Graphics (Sandy Bridge)
44 [X] Intel Pentium B950 2.1GHz
HD Graphics (Sandy Bridge)
45 [X] Intel Pentium B960 2.2GHz
HD Graphics (Sandy Bridge)
~ 37 fps
HD Graphics (Sandy Bridge):
13 [X] Intel Celeron B710 1.6GHz
HD Graphics (Sandy Bridge)
23 [X] Intel Pentium B950 2.1GHz
HD Graphics (Sandy Bridge)
24 [X] Intel Pentium B960 2.2GHz
HD Graphics (Sandy Bridge)
~ 20 fps
HD Graphics (Sandy Bridge):
11 [X] Intel Pentium B960 2.2GHz
HD Graphics (Sandy Bridge)
fps
HD Graphics (Sandy Bridge):
7 [X] Intel Pentium B960 2.2GHz
HD Graphics (Sandy Bridge)
9.1 9.6 ~ 9 fps
HD Graphics (Sandy Bridge):
24 [X] Intel Pentium B950 2.1GHz
HD Graphics (Sandy Bridge)
fps
HD Graphics (Sandy Bridge):
18 [X] Intel Pentium B950 2.1GHz
HD Graphics (Sandy Bridge)
fps
HD Graphics (Sandy Bridge):
27 (!) [X] Intel Celeron B710 1.6GHz
HD Graphics (Sandy Bridge)
56 [X] Intel Pentium B950 2.1GHz
HD Graphics (Sandy Bridge)
68.7 76.4 94 [X] Intel Pentium B960 2.2GHz
HD Graphics (Sandy Bridge)
~ 64 fps
HD Graphics (Sandy Bridge):
16 [X] Intel Celeron B710 1.6GHz
HD Graphics (Sandy Bridge)
38.3 43.4 50 [X] Intel Pentium B950 2.1GHz
HD Graphics (Sandy Bridge)
51 [X] Intel Pentium B960 2.2GHz
HD Graphics (Sandy Bridge)
~ 40 fps
HD Graphics (Sandy Bridge):
11.1 21.4 30 [X] Intel Pentium B950 2.1GHz
HD Graphics (Sandy Bridge)
30 [X] Intel Pentium B960 2.2GHz
HD Graphics (Sandy Bridge)
~ 23 fps
HD Graphics (Sandy Bridge):
18 [X] Intel Pentium B950 2.1GHz
HD Graphics (Sandy Bridge)
18 [X] Intel Pentium B960 2.2GHz
HD Graphics (Sandy Bridge)
~ 18 fps
HD Graphics (Sandy Bridge):
20 [X] Intel Pentium B960 2.2GHz
HD Graphics (Sandy Bridge)
21 [X] Intel Pentium B950 2.1GHz
HD Graphics (Sandy Bridge)
~ 21 fps
HD Graphics (Sandy Bridge):
12 [X] Intel Pentium B950 2.1GHz
HD Graphics (Sandy Bridge)
fps
HD Graphics (Sandy Bridge):
7.2 19 [X] Intel Celeron B710 1.6GHz
HD Graphics (Sandy Bridge)
20.1 24.3 26 [X] Intel Pentium B950 2.1GHz
HD Graphics (Sandy Bridge)
26 [X] Intel Pentium B960 2.2GHz
HD Graphics (Sandy Bridge)
~ 20 fps
HD Graphics (Cherry Trail):
25.6 fps
HD Graphics (Cherry Trail):
12 fps
HD Graphics (Sandy Bridge):
48.7 [X] Intel Pentium B950 2.1GHz
HD Graphics (Sandy Bridge)
fps
HD Graphics (Cherry Trail):
28.1 fps
HD Graphics (Sandy Bridge):
21 [X] Intel Pentium B950 2.1GHz
HD Graphics (Sandy Bridge)
fps
HD Graphics (Cherry Trail):
12.5 fps
HD Graphics (Sandy Bridge):
13.2 [X] Intel Pentium B950 2.1GHz
HD Graphics (Sandy Bridge)
fps
100%
HD Graphics 5000:
88.8 fps
46%
HD Graphics (Sandy Bridge):
39.5 43.2 [X] Intel Pentium B960 2.2GHz
HD Graphics (Sandy Bridge)
~ 41 fps
HD Graphics (Sandy Bridge):
68.5 [X] HP ProBook 4530 (XX964EA) Intel Celeron B810 1.6GHz
HD Graphics (Sandy Bridge)
fps
HD Graphics (Sandy Bridge):
39.9 [X] HP ProBook 4530 (XX964EA) Intel Celeron B810 1.6GHz
HD Graphics (Sandy Bridge)
fps
HD Graphics (Sandy Bridge):
20 [X] HP ProBook 4530 (XX964EA) Intel Celeron B810 1.6GHz
HD Graphics (Sandy Bridge)
fps
HD Graphics (Cherry Trail):
18.7 fps
HD Graphics (Sandy Bridge):
14.7 fps
HD Graphics (Sandy Bridge):
9.4 fps
HD Graphics (Sandy Bridge):
7.4 fps
HD Graphics (Sandy Bridge):
4.3 fps
100%
HD Graphics 5000:
126 169 ~ 148 fps
36%
HD Graphics (Sandy Bridge):
27 38 [X] Intel Celeron B710 1.6GHz
HD Graphics (Sandy Bridge)
41 60.1 64.2 65.4 76 [X] Intel Pentium B960 2.2GHz
HD Graphics (Sandy Bridge)
~ 53 fps
43%
HD Graphics (Cherry Trail):
63.2 64 ~ 64 fps
100%
HD Graphics 5000:
38 43 ~ 41 fps
24%
HD Graphics (Sandy Bridge):
3.7 8 10 [X] Intel Celeron B710 1.6GHz
HD Graphics (Sandy Bridge)
11.6 12 [X] Intel Pentium B960 2.2GHz
HD Graphics (Sandy Bridge)
12.4 12.4 ~ 10 fps
44%
HD Graphics (Cherry Trail):
18 18.8 ~ 18 fps
100%
HD Graphics 5000:
24 26 ~ 25 fps
32%
HD Graphics (Sandy Bridge):
7 8 [X] Intel Celeron B710 1.6GHz
HD Graphics (Sandy Bridge)
8.3 8.6 8.7 10 [X] Intel Pentium B960 2.2GHz
HD Graphics (Sandy Bridge)
~ 8 fps
56%
HD Graphics (Cherry Trail):
14 fps
100%
HD Graphics 5000:
10 16 ~ 13 fps
54%
HD Graphics (Cherry Trail):
7 fps
HD Graphics (Sandy Bridge):
11.5 [X] Intel Celeron B710 1.6GHz
HD Graphics (Sandy Bridge)
26 [X] Intel Pentium B960 2.2GHz
HD Graphics (Sandy Bridge)
~ 19 fps
HD Graphics (Sandy Bridge):
6.5 [X] Intel Celeron B710 1.6GHz
HD Graphics (Sandy Bridge)
9.6 [X] Intel Pentium B960 2.2GHz
HD Graphics (Sandy Bridge)
~ 8 fps
HD Graphics (Sandy Bridge):
26 [X] Intel Pentium B950 2.1GHz
HD Graphics (Sandy Bridge)
fps
HD Graphics (Sandy Bridge):
16 [X] Intel Pentium B950 2.1GHz
HD Graphics (Sandy Bridge)
fps
HD Graphics (Sandy Bridge):
27 27 35 [X] Intel Pentium B950 2.1GHz
HD Graphics (Sandy Bridge)
~ 30 fps
HD Graphics (Sandy Bridge):
11.2 11.6 13 [X] Intel Pentium B950 2.1GHz
HD Graphics (Sandy Bridge)
~ 12 fps
HD Graphics (Sandy Bridge):
20.1 [X] Intel Celeron B710 1.6GHz
HD Graphics (Sandy Bridge)
43.8 [X] Intel Pentium B950 2.1GHz
HD Graphics (Sandy Bridge)
44.2 [X] Intel Pentium B960 2.2GHz
HD Graphics (Sandy Bridge)
~ 36 fps
HD Graphics (Sandy Bridge):
10.3 [X] Intel Celeron B710 1.6GHz
HD Graphics (Sandy Bridge)
15.3 [X] Intel Pentium B950 2.1GHz
HD Graphics (Sandy Bridge)
15.3 [X] Intel Pentium B960 2.2GHz
HD Graphics (Sandy Bridge)
~ 14 fps
HD Graphics (Sandy Bridge):
5 [X] Intel Celeron B710 1.6GHz
HD Graphics (Sandy Bridge)
7 [X] Intel Pentium B950 2.1GHz
HD Graphics (Sandy Bridge)
7 [X] Intel Pentium B960 2.2GHz
HD Graphics (Sandy Bridge)
~ 6 fps
HD Graphics (Sandy Bridge):
13.8 [X] HP ProBook 4530 (XX964EA) Intel Celeron B810 1.6GHz
HD Graphics (Sandy Bridge)
24.5 ~ 19 fps
HD Graphics (Sandy Bridge):
15.5 fps
HD Graphics (Sandy Bridge):
12.7 fps
HD Graphics (Sandy Bridge):
10.7 fps
100%
HD Graphics 5000:
122 fps
100%
HD Graphics 5000:
18 fps
HD Graphics (Sandy Bridge):
72 [X] Intel Pentium B960 2.2GHz
HD Graphics (Sandy Bridge)
fps
HD Graphics (Sandy Bridge):
21 [X] Intel Pentium B960 2.2GHz
HD Graphics (Sandy Bridge)
fps
HD Graphics (Sandy Bridge):
23.3 [X] HP ProBook 4530 (XX964EA) Intel Celeron B810 1.6GHz
HD Graphics (Sandy Bridge)
fps
HD Graphics (Sandy Bridge):
75.6 [X] Intel Celeron B710 1.6GHz
HD Graphics (Sandy Bridge)
135 [X] Intel Pentium B950 2.1GHz
HD Graphics (Sandy Bridge)
~ 105 fps
HD Graphics (Sandy Bridge):
22 [X] Intel Celeron B710 1.6GHz
HD Graphics (Sandy Bridge)
36.2 [X] Intel Pentium B950 2.1GHz
HD Graphics (Sandy Bridge)
~ 29 fps
HD Graphics (Sandy Bridge):
7.5 (!) [X] Intel Celeron B710 1.6GHz
HD Graphics (Sandy Bridge)
12.2 (!) [X] Intel Pentium B950 2.1GHz
HD Graphics (Sandy Bridge)
~ 10 fps
HD Graphics (Sandy Bridge):
46.7 [X] HP ProBook 4530 (XX964EA) Intel Celeron B810 1.6GHz
HD Graphics (Sandy Bridge)
fps
HD Graphics (Sandy Bridge):
22.5 [X] HP ProBook 4530 (XX964EA) Intel Celeron B810 1.6GHz
HD Graphics (Sandy Bridge)
fps
HD Graphics (Sandy Bridge):
15.9 [X] Intel Celeron B710 1.6GHz
HD Graphics (Sandy Bridge)
22 [X] Intel Pentium B950 2.1GHz
HD Graphics (Sandy Bridge)
~ 19 fps
HD Graphics (Sandy Bridge):
15 [X] Intel Pentium B950 2.1GHz
HD Graphics (Sandy Bridge)
fps
HD Graphics (Sandy Bridge):
12.5 [X] Intel Pentium B950 2.1GHz
HD Graphics (Sandy Bridge)
fps
HD Graphics (Sandy Bridge):
23.7 [X] Intel Celeron B710 1.6GHz
HD Graphics (Sandy Bridge)
33.7 [X] Intel Pentium B960 2.2GHz
HD Graphics (Sandy Bridge)
~ 29 fps
HD Graphics (Sandy Bridge):
12.1 [X] Intel Celeron B710 1.6GHz
HD Graphics (Sandy Bridge)
14.3 [X] Intel Pentium B960 2.2GHz
HD Graphics (Sandy Bridge)
~ 13 fps
HD Graphics (Sandy Bridge):
35 [X] Intel Celeron B710 1.6GHz
HD Graphics (Sandy Bridge)
58 [X] Intel Pentium B950 2.1GHz
HD Graphics (Sandy Bridge)
83 [X] Intel Pentium B960 2.2GHz
HD Graphics (Sandy Bridge)
~ 59 fps
HD Graphics (Sandy Bridge):
10 [X] Intel Celeron B710 1.6GHz
HD Graphics (Sandy Bridge)
17 [X] Intel Pentium B950 2.1GHz
HD Graphics (Sandy Bridge)
25 [X] Intel Pentium B960 2.2GHz
HD Graphics (Sandy Bridge)
~ 17 fps
HD Graphics (Sandy Bridge):
6 [X] Intel Celeron B710 1.6GHz
HD Graphics (Sandy Bridge)
9 [X] Intel Pentium B950 2.1GHz
HD Graphics (Sandy Bridge)
9 [X] Intel Pentium B960 2.2GHz
HD Graphics (Sandy Bridge)
~ 8 fps
HD Graphics (Sandy Bridge):
3 [X] Intel Pentium B960 2.2GHz
HD Graphics (Sandy Bridge)
fps
HD Graphics (Sandy Bridge):
6.2 [X] HP ProBook 4530 (XX964EA) Intel Celeron B810 1.6GHz
HD Graphics (Sandy Bridge)
fps
HD Graphics (Sandy Bridge):
43.2 [X] Intel Celeron B710 1.6GHz
HD Graphics (Sandy Bridge)
95 [X] Intel Pentium B950 2.1GHz
HD Graphics (Sandy Bridge)
~ 69 fps
100%
HD Graphics 5000:
162 fps
61%
HD Graphics (Sandy Bridge):
54 [X] Intel Celeron B710 1.6GHz
HD Graphics (Sandy Bridge)
120 [X] Intel Pentium B950 2.1GHz
HD Graphics (Sandy Bridge)
123 [X] Intel Pentium B960 2.2GHz
HD Graphics (Sandy Bridge)
~ 99 fps
29%
HD Graphics (Cherry Trail):
44 50.9 [X] Chuwi Hi12 Intel Atom x5-Z8300 1.4GHz
HD Graphics (Cherry Trail)
min:
40 fps, max:
60 fps
~ 47 fps
100%
HD Graphics 5000:
78 fps
38%
HD Graphics (Sandy Bridge):
27 [X] Intel Celeron B710 1.6GHz
HD Graphics (Sandy Bridge)
31 [X] Intel Pentium B950 2.1GHz
HD Graphics (Sandy Bridge)
31 [X] Intel Pentium B960 2.2GHz
HD Graphics (Sandy Bridge)
~ 30 fps
23%
HD Graphics (Cherry Trail):
18.3 [X] Chuwi Hi12 Intel Atom x5-Z8300 1.4GHz
HD Graphics (Cherry Trail)
min:
13 fps, max:
29 fps
fps
100%
HD Graphics 5000:
31 fps
29%
HD Graphics (Sandy Bridge):
9 [X] Intel Pentium B950 2.1GHz
HD Graphics (Sandy Bridge)
9 [X] Intel Pentium B960 2.2GHz
HD Graphics (Sandy Bridge)
~ 9 fps
100%
HD Graphics 5000:
9 fps
HD Graphics (Sandy Bridge):
41 [X] Intel Celeron B710 1.6GHz
HD Graphics (Sandy Bridge)
86 [X] Intel Pentium B950 2.1GHz
HD Graphics (Sandy Bridge)
~ 64 fps
HD Graphics (Sandy Bridge):
32 [X] Intel Celeron B710 1.6GHz
HD Graphics (Sandy Bridge)
44.3 [X] Intel Pentium B960 2.2GHz
HD Graphics (Sandy Bridge)
~ 38 fps
HD Graphics (Sandy Bridge):
32 [X] Intel Celeron B710 1.6GHz
HD Graphics (Sandy Bridge)
43.9 [X] Intel Pentium B960 2.2GHz
HD Graphics (Sandy Bridge)
~ 38 fps
HD Graphics (Sandy Bridge):
30.5 [X] Intel Celeron B710 1.6GHz
HD Graphics (Sandy Bridge)
42.9 [X] Intel Pentium B960 2.2GHz
HD Graphics (Sandy Bridge)
~ 37 fps
HD Graphics (Sandy Bridge):
27.9 [X] Intel Celeron B710 1.6GHz
HD Graphics (Sandy Bridge)
40.6 [X] Intel Pentium B960 2.2GHz
HD Graphics (Sandy Bridge)
~ 34 fps
HD Graphics (Sandy Bridge):
214 [X] Intel Pentium B960 2.2GHz
HD Graphics (Sandy Bridge)
fps
Average Gaming Intel HD Graphics 5000 → 100% Average Gaming 30-70 fps → 100%
Average Gaming Intel HD Graphics (Sandy Bridge) → 42% Average Gaming 30-70 fps → 49%
Average Gaming Intel HD Graphics (Cherry Trail) → 46% Average Gaming 30-70 fps → 36%
v1.26
log 29. 16:09:20
#0 checking url part for id 4574 +0s ... 0s
#1 checking url part for id 2679 +0s ... 0s
#2 checking url part for id 6197 +0s ... 0s
#3 not redirecting to Ajax server +0s ... 0s
#4 did not recreate cache, as it is less than 5 days old! Created at Sun, 28 Apr 2024 05:41:30 +0200 +0.001s ... 0.001s
#5 composed specs +0.165s ... 0.166s
#6 did output specs +0s ... 0.166s
#7 start showIntegratedCPUs +0s ... 0.166s
#8 getting avg benchmarks for device 4574 +0.064s ... 0.23s
#9 got single benchmarks 4574 +0.022s ... 0.253s
#10 getting avg benchmarks for device 2679 +0.002s ... 0.254s
#11 got single benchmarks 2679 +0.076s ... 0.331s
#12 getting avg benchmarks for device 6197 +0.015s ... 0.346s
#13 got single benchmarks 6197 +0.08s ... 0.426s
#14 got avg benchmarks for devices +0s ... 0.426s
#15 min, max, avg, median took s +0.599s ... 1.025s
#16 before gaming benchmark output +0s ... 1.025s
#17 Got 599 rows for game benchmarks. +0.055s ... 1.08s
#18 composed SQL query for gamebenchmarks +0s ... 1.08s
#19 got data and put it in $dataArray +0.064s ... 1.144s
#20 benchmarks composed for output. +0.241s ... 1.385s
#21 calculated avg scores. +0s ... 1.385s
#22 return log +0.003s ... 1.388s
Teilen Sie diesen Artikel, um uns zu unterstützen. Jeder Link hilft!
Autor: Klaus Hinum, 8.09.2017 (Update: 1.07.2023)
 Deutsch
 English
 Español
 Français
 Italiano
 Nederlands
 Polski
 Português
 Русский
 Türkçe
 Svenska
 Chinese
 Magyar