Notebookcheck Logo

NVIDIA GeForce GTX 970M SLI vs NVIDIA GeForce GTX 1650 Ti Max-Q

NVIDIA GeForce GTX 970M SLI

► remove from comparison NVIDIA GeForce GTX 970M SLI

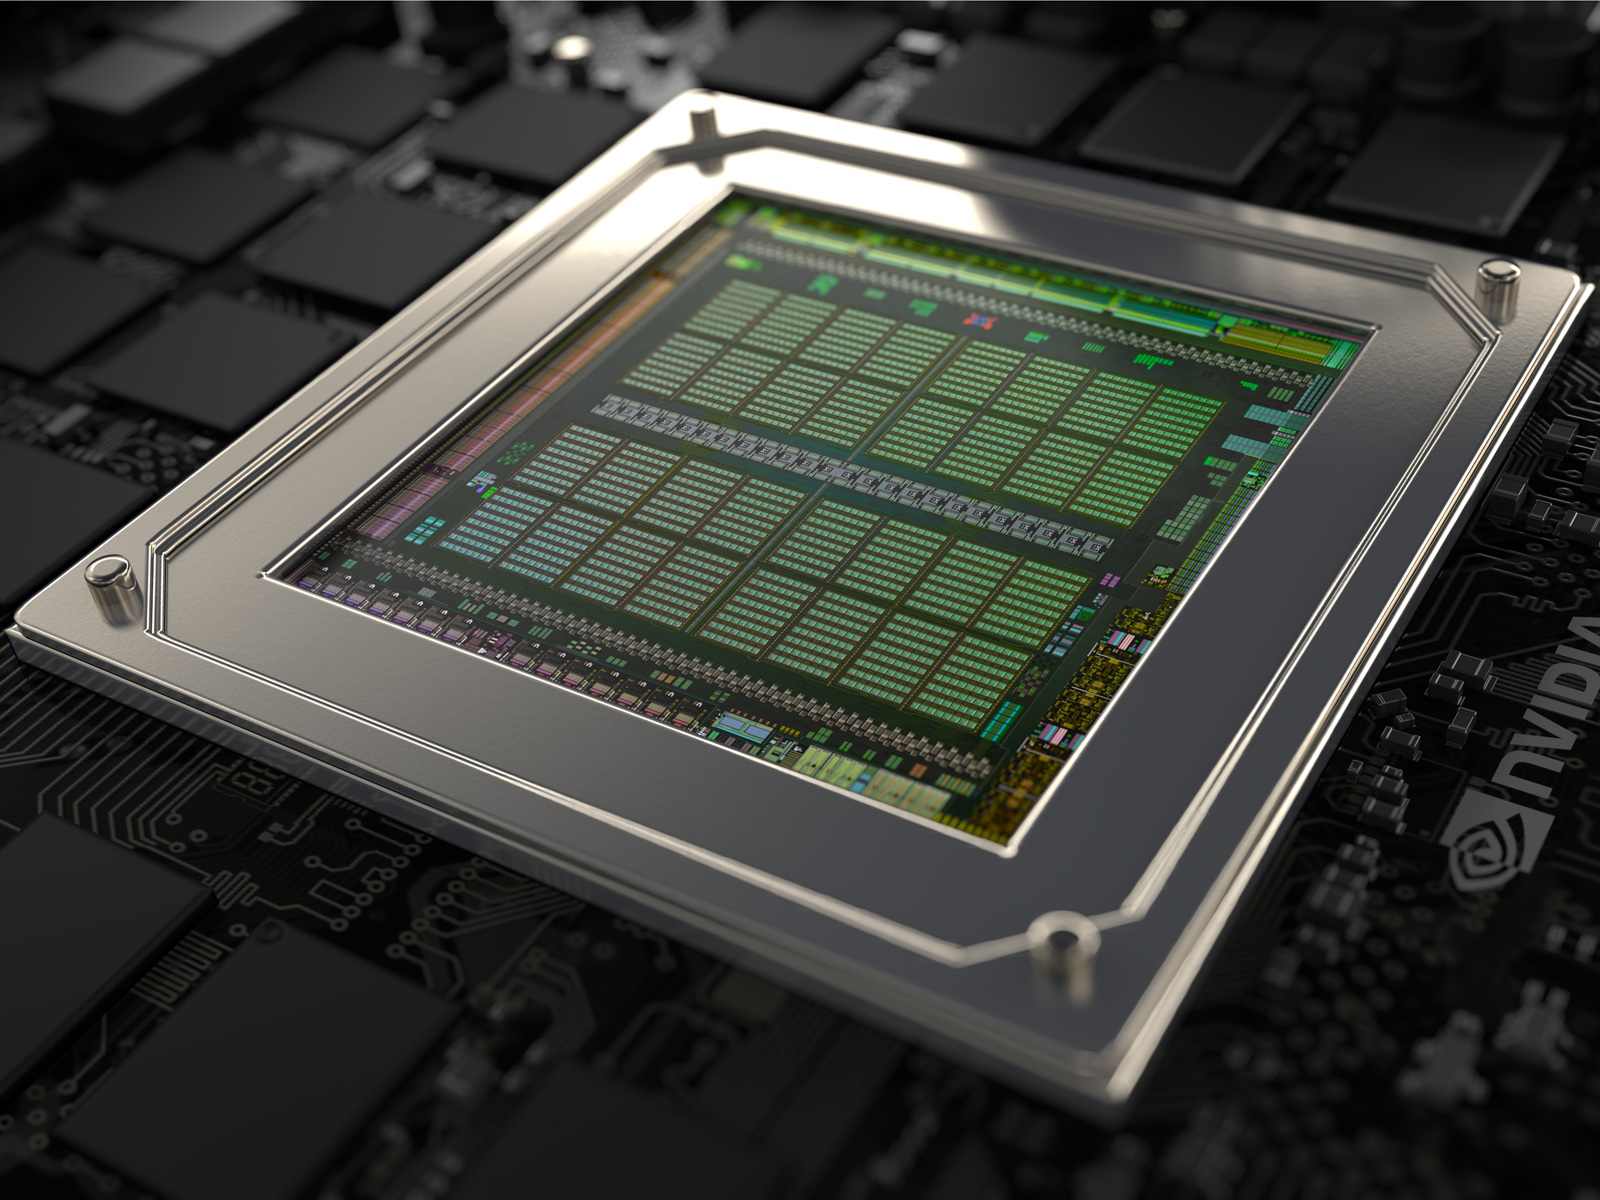
Die NVIDIA GeForce GTX 970M SLI ist ein Verbund aus zwei GeForce GTX 970M Grafikkarten der High-End-Klasse, der Ende 2014 vorgestellt wurde. Die GTX 970M GPU basiert auf dem in 28 Nanometern gefertigten Maxwell-Grafikchip GM204, der auch beim Top-Modell GeForce GTX 980M sowie verschiedenen Desktop-Karten zum Einsatz kommt. Die von Nvidia spezifizierten Taktraten liegen bei 924 MHz (zzgl. Boost) für die GPUs sowie 1.250 MHz (5.000 MHz effektiv) für den bis zu 2x 6 GB großen GDDR5-Speicher.

Beide Grafikkarten rendern jeweils abwechselnd ein Bild (AFR), wodurch sich die Leistung gegenüber einer einzelnen GPU im Optimalfall fast verdoppelt. Allerdings kann es durch ungleichmäßige Abstände zwischen zwei Bildern zu spürbaren (Mikro-)Rucklern kommen, obwohl die fps-Raten in einem flüssigen Bereich liegen.

Architektur

GM204 basiert auf Nvidias Maxwell-Architektur, die die vorherige Kepler-Generation ablöst. Zur Steigerung der Auslastung und Energieeffizienz hat Nvidia unter anderem die sogenannten Streaming Multiprocessors (SMM) umstrukturiert, die nunmehr je 128 Shader-Einheiten und 8 TMUs integrieren. Je vier SMMs bilden einen GPC, insgesamt 4 GPCs sind im GM204 verbaut. Im Falle der GeForce GTX 970M hat Nvidia jedoch 6 der insgesamt 16 SMMs deaktiviert, sodass nur 1.280 Shader-ALUs und 80 TMUs genutzt werden können. Hinzu kommen 48 ROPs, organisiert in drei Clustern à 16 Einheiten.

Das Speicherinterface beider GPUs besitzt eine Breite von jeweils 192 Bit (3x 64 Bit) und soll dank eines verbesserten Komprimierungs-Algorithmus eine ausreichend schnelle Anbindung an den GDDR5-Speicher gewährleisten. Hinzu kommen stark vergrößerte L1- (96 KB pro SMM) und L2-Caches (2 MB), die den Bandbreitenbedarf senken. Anders als der Mittelklasse-Chip GM107 unterstützt GM204 bereits DirectX 12 mit Feature Level 12_1 und verfügt über SMMs mit einer verbesserten Polymorph-Engine.

Leistung

Die Performance einer GeForce GTX 970M liegt etwa 10 Prozent über einer GTX 880M, sodass sich auch beim Vergleich der jeweiligen SLI-Varianten eine ähnliche Differenz ergibt. Damit ist die GeForce GTX 970M SLI Ende 2014 die zweitschnellste Grafiklösung für Notebooks, lediglich ein SLI-Verbund aus zwei GeForce-GTX-980M-Karten rechnet nochmals rund 30 Prozent schneller. Maximale Details, zusätzliche Qualitäts-Features wie AA/AF und extreme hohe Auflösungen werden in nahezu allen aktuellen Spielen ohne Probleme bewältigt.

Features

Das Featureset entspricht zu großen Teilen dem der GeForce-GTX-800M-Serie. Bis zu 4 aktive Displays (mit Optimus u.U. weniger) sind mit der GTX 970M möglich, die mit einer maximalen Auflösung von 3840 x 2160 Pixeln zum Beispiel über DisplayPort 1.2 oder HDMI 2.0 (kein HDCP bei 4K) angebunden werden können. HD-Audio-Formate wie Dolby True HD und DTS-HD lassen sich als Bitstream an einen geeigneten Receiver senden. Wie in der Vergangenheit kann jedoch auch weiterhin 3D Vision nicht mit Optimus-Unterstützung kombiniert werden.

Der aktualisierte Videoprozessor VP6 kann nicht nur gängige Formate wie H.264, sondern ab sofort auch H.265 bis zu einer Auflösung von 4K decodieren und encodieren (per NVENC-API). Auch mehrere parallele Streams, beispielsweise für Picture-in-Picture bei einer Blu-Ray, sind möglich.

Weitere Features der GTX-900M-Serie, die jedoch teils auch von älteren Karten unterstützt werden, sind Battery Boost (längere Akkulaufzeit beim Spielen), Shadowplay (Aufzeichnung von Spiele-Videos, bis zu 4Kp60 und 130 Mbit/s) und Gamestream (Spiele-Streaming auf Shield-Konsole). Weitere Informationen dazu unter diesem Link.

Leistungsaufnahme

Die Leistungsaufnahme einer GeForce GTX 970M sollte inkl. MXM Board und Speicher im Bereich der GTX 870M liegen, die mit einer TDP von 100 Watt spezifiziert wurde. Bei der SLI-Version verdoppelt sich dieser Wert folglich auf etwa 200 Watt, sodass die Grafiklösung nur in sehr großen und schweren Gaming-Notebooks mit leistungsfähiger Kühlung eingesetzt werden kann. Bei geringer Last helfen variable Taktraten dabei, Energie einzusparen.

NVIDIA GeForce GTX 1650 Ti Max-Q

► remove from comparison NVIDIA GeForce GTX 1650 Ti Max-Q

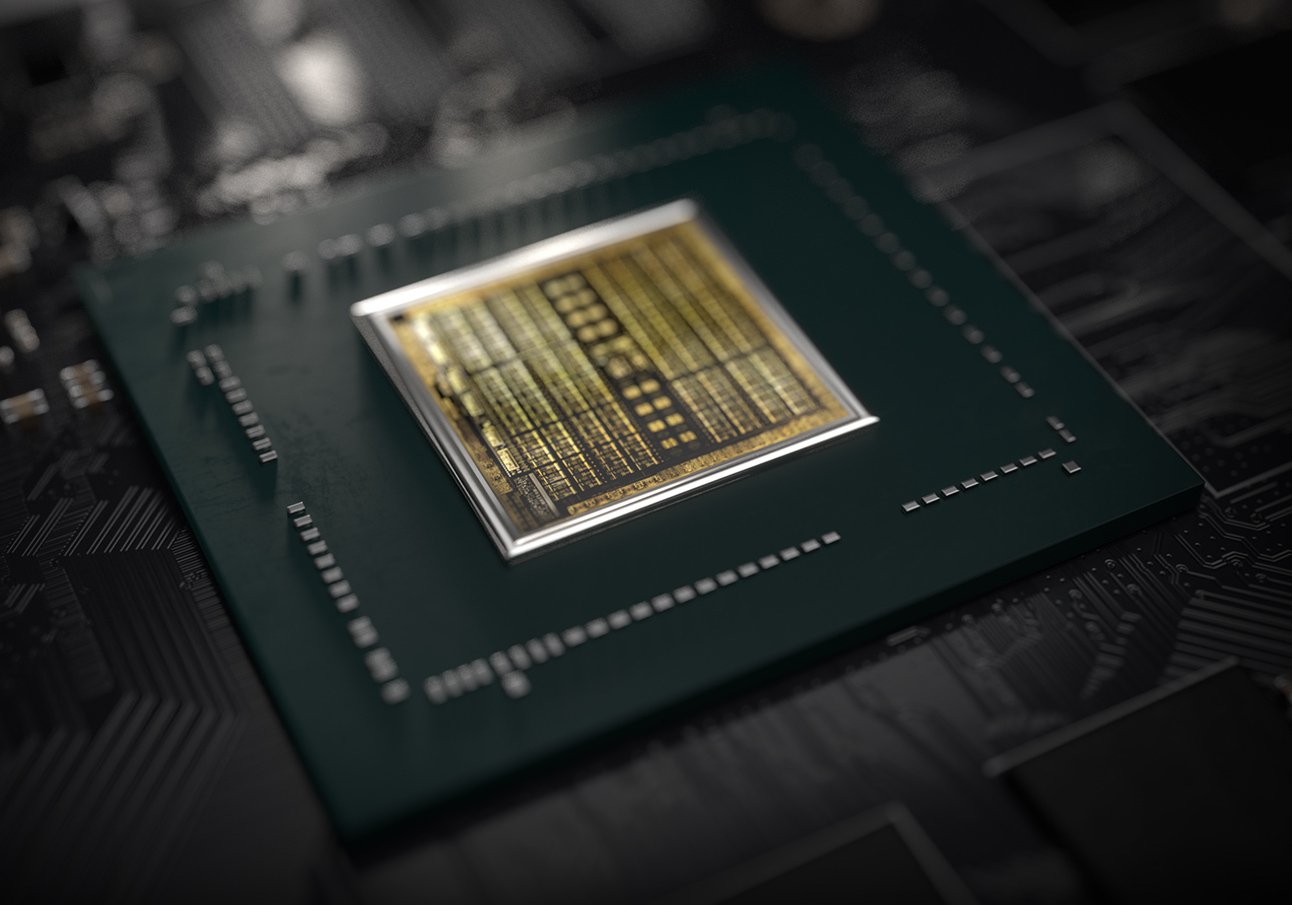
Die Nvidia GeForce GTX 1650 Ti Max-Q (N18P-G62) für Laptops ist die Stromsparversion der mobilen GeForce GTX 1650 Ti mit reduzierten Taktraten und Stromverbrauch. Die GTX 1650 Serie bietet im Unterschied zu den stärkeren RTX 2000er Karten (z.B. RTX 2060) keine Raytracing und Tensor Kerne. Die Leistung sollte leicht oberhalb einer mobilen GTX 1650 liegen.

Aktuell wissen wir von zwei Varianten mit 35 und 40 Watt TGP und unterschiedlichen Taktraten von 1035 - 1200 bzw 1200 - 1365 MHz. Beide Versionen sind jedoch deutlich unter der noromalen Max-P-Variante mit 1350 - 1485 MHz und 50 Watt TGP angesiedelt. Der Speicher wird mit 1250 MHz = 10.000 MHz effektiv (Gbps) getaktet. Es kann aber eventuell auch Varianten mit 1500 MHz (non Max-Q Taktraten) geben.

Bei der Turing Architektur gab es auch auf der Ebene der CUDA-Kerne deutliche Verbesserungen. Float und INT Operationen können nun gleichzeitig ausgeführt werden, der Cache wurde vereinheitlicht und verbessert und Adaptive Shading eingeführt. Nvidia spricht dadurch von einer bis zu 50% höheren Leistung pro Kern im Vergleich zu Pascal.

Im Gegensatz zu den größeren Turing Chips (wie den TU116 der GTX 1660 Ti) bietet der TU117 nur die älteren NVENC Videoenkodierung der Pascal / Volta Generation.

Nvidia spezifiziert einen Stromverbrauch von 35 bzw 40 Watt (im Vergleich zu den 50 - 80 Watt TGP der normalen GTX 1650 Ti Mobile) für die Grafikkarte und damit 15 Watt mehr als die langsamere und effizientere Max-Q Variante der GTX1650. Der TU117 Chip wird bei TSMC im 12nm FFN Verfahren gefertigt.

NVIDIA GeForce GTX 970M SLINVIDIA GeForce GTX 1650 Ti Max-Q
GeForce GTX 1600 Serie
GeForce GTX 980M SLI compare 3072 @ 1.04 - 1.13 GHz2x 256 Bit @ 5000 MHz
GeForce GTX 970M SLI 2560 @ 0.92 - 1.04 GHz2x 192 Bit @ 5000 MHz
GeForce GTX 965M SLI compare 2048 @ 0.92 - 0.95 GHz128 Bit @ 5000 MHz
GeForce GTX 980M compare 1536 @ 1.04 - 1.13 GHz256 Bit @ 5000 MHz
GeForce GTX 970M compare 1280 @ 0.92 - 1.04 GHz192 Bit @ 5000 MHz
GeForce GTX 965M compare 1024 @ 0.92 - 0.95 GHz128 Bit @ 5000 MHz
GeForce GTX 960M compare 640 @ 1.1 - 1.2 GHz128 Bit @ 5000 MHz
GeForce GTX 950M compare 640 @ 0.91 - 1.12 GHz128 Bit @ 1800 - 5000 MHz
GeForce GTX 1660 Ti (Desktop) compare 1536 @ 1.5 - 1.77 GHz192 Bit @ 12000 MHz
GeForce GTX 1660 Super (Desktop) compare 1408 @ 1.53 - 1.79 GHz192 Bit @ 14000 MHz
GeForce GTX 1660 Ti Mobile compare 1536 @ 1.46 - 1.59 GHz192 Bit @ 12000 MHz
GeForce GTX 1660 (Desktop) compare 1408 @ 1.53 - 1.79 GHz192 Bit @ 8000 MHz
GeForce GTX 1650 Super (Desktop) compare 1280 @ 1.53 GHz192 Bit @ 14000 MHz
GeForce GTX 1660 Ti Max-Q compare 1536 @ 1.14 - 1.34 GHz192 Bit @ 12000 MHz
GeForce GTX 1650 Ti Mobile compare 1024 @ 1.35 - 1.49 GHz128 Bit @ 12000 MHz
GeForce GTX 1650 (Desktop) compare 896 @ 1.49 - 1.67 GHz128 Bit @ 8000 MHz
GeForce GTX 1650 Mobile compare 1024 @ 1.38 - 1.56 GHz128 Bit @ 12000 MHz
GeForce GTX 1650 Ti Max-Q 1024 @ 1.04 - 1.2 GHz128 Bit @ 10000 MHz
GeForce GTX 1650 Max-Q compare 1024 @ 1.02 - 1.25 GHz128 Bit @ 8000 MHz
ArchitekturMaxwellTuring
Pipelines2560 - unified1024 - unified
Kerntakt924 - 1038 (Boost) MHz1035 - 1200 (Boost) MHz
Speichertakt5000 MHz10000 MHz
Speicherbandbreite2x 192 Bit128 Bit
SpeichertypGDDR5GDDR6
Max. Speichergröße6 GB4 GB
Shared Memoryneinnein
APIDirectX 12_1, Shader 5.0DirectX 12_1, OpenGL 4.6
Stromverbrauch162 Watt35 Watt
Transistors0 Billion
Herstellungsprozess28 nm12 nm
FeaturesBattery Boost, GameStream, ShadowPlay, GPU Boost 2.0, Optimus, PhysX, CUDA, SLI, GeForce Experience
Notebookgrößegroß (17" z.B.)mittel (15.4" z.B.)
Erscheinungsdatum07.10.2014 02.04.2020
CodenameN18P-G62 Max-Q
Herstellerseitewww.nvidia.com

Benchmarks

Performance Rating - 3DMark 11 + Fire Strike + Time Spy - GeForce GTX 970M SLI
5.5 pt (17%)
Restrict / Search: Model: Max. age: years
3DMark - 3DMark Wild Life Unlimited
21348 Points (11%)
3DMark - 3DMark Fire Strike Standard Score
min: 10621     avg: 10865     median: 10741 (16%)     max: 11358 Points
min: 7292     avg: 7764     median: 7700 (12%)     max: 8659 Points
3DMark - 3DMark Fire Strike Standard Graphics
min: 14231     avg: 14776     median: 14759.5 (14%)     max: 15354 Points
min: 8024     avg: 8542     median: 8564 (8%)     max: 9573 Points
3DMark - 3DMark Ice Storm Graphics
min: 157047     avg: 276540     median: 303556 (34%)     max: 342001 Points
3DMark - 3DMark Time Spy Score
min: 3015     avg: 3309     median: 3235.5 (8%)     max: 3709 Points
3DMark - 3DMark Time Spy Graphics
min: 2886     avg: 3139     median: 3098 (6%)     max: 3526 Points
3DMark - 3DMark Ice Storm Unlimited Graphics
256573 Points (26%)
421834 Points (43%)
3DMark - 3DMark Ice Storm Extreme Graphics
256080 Points (30%)
34142 Points (4%)
3DMark - 3DMark Cloud Gate Score
min: 23191     avg: 25745     median: 25556.5 (24%)     max: 28674 Points
min: 18333     avg: 22116     median: 22895 (22%)     max: 26161 Points
3DMark - 3DMark Cloud Gate Graphics
min: 88044     avg: 96257     median: 96943.5 (24%)     max: 103095 Points
min: 29035     avg: 42978     median: 47657 (12%)     max: 53539 Points
3DMark 11 - 3DM11 Performance Score
min: 14203     avg: 14633     median: 14514.5 (18%)     max: 15300 Points
min: 10610     avg: 11524     median: 11398 (14%)     max: 13121 Points
3DMark 11 - 3DM11 Performance GPU
min: 18249     avg: 19109     median: 18870 (14%)     max: 20447 Points
min: 11055     avg: 11796     median: 11538 (9%)     max: 13343 Points
3DMark Vantage
3DM Vant. Perf. total + NVIDIA GeForce GTX 970M SLI
3DMark Vantage - 3DM Vant. Perf. total
min: 35318     avg: 36119     median: 36119 (10%)     max: 36920 Points
3DM Vant. Perf. total + NVIDIA GeForce GTX 1650 Ti Max-Q
31116 Points (9%)
3DM Vant. Perf. GPU no PhysX + NVIDIA GeForce GTX 970M SLI
3DMark Vantage - 3DM Vant. Perf. GPU no PhysX
min: 42916     avg: 44188     median: 44187.5 (24%)     max: 45459 Points
3DM Vant. Perf. GPU no PhysX + NVIDIA GeForce GTX 1650 Ti Max-Q
33179 Points (18%)
3DMark 06 3DMark 06 - Standard 1280x1024 + NVIDIA GeForce GTX 970M SLI
3DMark 06
min: 27179     avg: 28183     median: 28182.5 (37%)     max: 29186 Points
3DMark 06 - Standard 1280x1024 + NVIDIA GeForce GTX 1650 Ti Max-Q
30266 Points (40%)
Unigine Heaven 3.0 - Unigine Heaven 3.0 DX 11
168.5 fps (56%)
SPECviewperf 12
specvp12 sw-03 + NVIDIA GeForce GTX 970M SLI
SPECviewperf 12 - specvp12 sw-03
34 fps (8%)
specvp12 snx-02 + NVIDIA GeForce GTX 970M SLI
SPECviewperf 12 - specvp12 snx-02
4.3 fps (1%)
specvp12 showcase-01 + NVIDIA GeForce GTX 970M SLI
SPECviewperf 12 - specvp12 showcase-01
36.8 fps (6%)
specvp12 mediacal-01 + NVIDIA GeForce GTX 970M SLI
SPECviewperf 12 - specvp12 mediacal-01
18.9 fps (5%)
specvp12 maya-04 + NVIDIA GeForce GTX 970M SLI
SPECviewperf 12 - specvp12 maya-04
63.8 fps (17%)
specvp12 energy-01 + NVIDIA GeForce GTX 970M SLI
SPECviewperf 12 - specvp12 energy-01
3.8 fps (3%)
specvp12 creo-01 + NVIDIA GeForce GTX 970M SLI
SPECviewperf 12 - specvp12 creo-01
23 fps (9%)
specvp12 catia-04 + NVIDIA GeForce GTX 970M SLI
SPECviewperf 12 - specvp12 catia-04
31.4 fps (5%)
Cinebench R10 Cinebench R10 Shading (32bit) + NVIDIA GeForce GTX 970M SLI
Cinebench R10 - Cinebench R10 Shading (32bit)
min: 6823     avg: 7587     median: 7587 (5%)     max: 8351 Points
Cinebench R11.5 Cinebench R11.5 OpenGL 64 Bit + NVIDIA GeForce GTX 970M SLI
Cinebench R11.5 - Cinebench R11.5 OpenGL 64 Bit
min: 66.8     avg: 67.9     median: 67.8 (22%)     max: 69.3 fps
Cinebench R11.5 OpenGL 64 Bit + NVIDIA GeForce GTX 1650 Ti Max-Q
Cinebench R15
Cinebench R15 OpenGL 64 Bit + NVIDIA GeForce GTX 970M SLI
Cinebench R15 - Cinebench R15 OpenGL 64 Bit
min: 107.8     avg: 122.6     median: 119.6 (7%)     max: 143.3 fps
Cinebench R15 OpenGL 64 Bit + NVIDIA GeForce GTX 1650 Ti Max-Q
min: 83.9     avg: 132.8     median: 140 (8%)     max: 145 fps
Cinebench R15 OpenGL Ref. Match 64 Bit + NVIDIA GeForce GTX 970M SLI
Cinebench R15 - Cinebench R15 OpenGL Ref. Match 64 Bit
99.6 % (100%)
Cinebench R15 OpenGL Ref. Match 64 Bit + NVIDIA GeForce GTX 1650 Ti Max-Q
99.6 % (100%)
GFXBench 3.0 - GFXBench 3.0 Manhattan Offscreen
259 fps (11%)
LuxMark v2.0 64Bit - LuxMark v2.0 Room GPU
min: 2163     avg: 2187     median: 2187 (8%)     max: 2211 Samples/s
9546 Samples/s (34%)
LuxMark v2.0 64Bit - LuxMark v2.0 Sala GPU
min: 3744     avg: 3819     median: 3818.5 (7%)     max: 3893 Samples/s
10809 Samples/s (19%)
ComputeMark v2.1 - ComputeMark v2.1 Result
min: 5307     avg: 5328     median: 5327.5 (4%)     max: 5348 Points
6297 Points (5%)
Power Consumption - Furmark Stress Test Power Consumption - external Monitor *
min: 61.5     avg: 66.7     median: 65.2 (9%)     max: 75 Watt
Power Consumption - The Witcher 3 Power Consumption - external Monitor *
min: 59.8     avg: 63.3     median: 63 (9%)     max: 67.3 Watt
Power Consumption - Witcher 3 Power Consumption *
min: 60.6     avg: 72     median: 68.6 (15%)     max: 94 Watt
Power Consumption - Power Efficiency - Witcher 3 ultra
min: 0.3568     avg: 0.4     median: 0.4 (40%)     max: 0.522 fps per Watt
Power Consumption - Power Efficiency - Witcher 3 ultra external Monitor
min: 0.4161     avg: 0.4     median: 0.4 (37%)     max: 0.4716 fps per Watt
Emissions Witcher 3 Fan Noise + NVIDIA GeForce GTX 1650 Ti Max-Q
Emissions - Witcher 3 Fan Noise
min: 34.5     avg: 40.9     median: 42 (60%)     max: 47 dB(A)
Clock Speed - GPU Clock Witcher 3 ultra
min: 1340     avg: 1405     median: 1405 (55%)     max: 1470 MHz
Clock Speed - GPU Clock Speed Furmark
998 MHz (40%)

Average Benchmarks NVIDIA GeForce GTX 970M SLI → 100% n=17

Average Benchmarks NVIDIA GeForce GTX 1650 Ti Max-Q → 118% n=17

- Bereich der Benchmarkergebnisse für diese Grafikkarte
red legend - Durchschnittliche Benchmarkergebnisse für diese Grafikkarte
* Smaller numbers mean a higher performance
1 This benchmark is not used for the average calculation

Spiele-Benchmarks

Die folgenden Benchmarks basieren auf unseren Spieletests mit Testnotebooks. Die Performance dieser Grafikkarte bei den gelisteten Spielen ist abhängig von der verwendeten CPU, Speicherausstattung, Treiber und auch Betriebssystem. Dadurch müssen die untenstehenden Werte nicht repräsentativ sein. Detaillierte Informationen über das verwendete System sehen Sie nach einem Klick auf den fps-Wert.

low 1280x720
GeForce GTX 1650 Ti Max-Q:
63.7  fps
med. 1920x1080
GeForce GTX 1650 Ti Max-Q:
33  fps
high 1920x1080
GeForce GTX 1650 Ti Max-Q:
26.8  fps
ultra 1920x1080
GeForce GTX 1650 Ti Max-Q:
22.2  fps
low 1280x720
GeForce GTX 1650 Ti Max-Q:
70 77 ~ 74 fps
med. 1920x1080
GeForce GTX 1650 Ti Max-Q:
45 48 ~ 47 fps
high 1920x1080
GeForce GTX 1650 Ti Max-Q:
32 36 37 ~ 35 fps
ultra 1920x1080
GeForce GTX 1650 Ti Max-Q:
28 29 ~ 29 fps
QHD 2560x1440
GeForce GTX 1650 Ti Max-Q:
24  fps
4K 3840x2160
GeForce GTX 1650 Ti Max-Q:
14  fps
low 1280x720
GeForce GTX 1650 Ti Max-Q:
97.5 105.1 ~ 101 fps
med. 1920x1080
GeForce GTX 1650 Ti Max-Q:
42.5 46.9 ~ 45 fps
high 1920x1080
GeForce GTX 1650 Ti Max-Q:
40.5 44.8 ~ 43 fps
ultra 1920x1080
GeForce GTX 1650 Ti Max-Q:
35.7 39.6 ~ 38 fps
QHD 2560x1440
GeForce GTX 1650 Ti Max-Q:
25.4  fps
4K 3840x2160
GeForce GTX 1650 Ti Max-Q:
12.4  fps
low 1280x720
GeForce GTX 1650 Ti Max-Q:
100  fps
med. 1920x1080
GeForce GTX 1650 Ti Max-Q:
55.6  fps
high 1920x1080
GeForce GTX 1650 Ti Max-Q:
44.1  fps
ultra 1920x1080
GeForce GTX 1650 Ti Max-Q:
40.2  fps
QHD 2560x1440
GeForce GTX 1650 Ti Max-Q:
25.8  fps
4K 3840x2160
GeForce GTX 1650 Ti Max-Q:
10.6  fps
low 1280x720
GeForce GTX 1650 Ti Max-Q:
47 63 74 ~ 61 fps
med. 1920x1080
GeForce GTX 1650 Ti Max-Q:
30 38 45 ~ 38 fps
high 1920x1080
GeForce GTX 1650 Ti Max-Q:
19 24 32 ~ 25 fps
ultra 1920x1080
GeForce GTX 1650 Ti Max-Q:
5 12 14 ~ 10 fps
QHD 2560x1440
GeForce GTX 1650 Ti Max-Q:
12  fps
4K 3840x2160
GeForce GTX 1650 Ti Max-Q:
5  fps
low 1280x720
GeForce GTX 1650 Ti Max-Q:
70 89 ~ 80 fps
med. 1920x1080
GeForce GTX 1650 Ti Max-Q:
43 54 ~ 49 fps
high 1920x1080
GeForce GTX 1650 Ti Max-Q:
37 39 47 ~ 41 fps
ultra 1920x1080
GeForce GTX 1650 Ti Max-Q:
11 21 ~ 16 fps
QHD 2560x1440
GeForce GTX 1650 Ti Max-Q:
14  fps
FIFA 21

FIFA 21

2020
low 1280x720
GeForce GTX 1650 Ti Max-Q:
210  fps
med. 1920x1080
GeForce GTX 1650 Ti Max-Q:
202  fps
high 1920x1080
GeForce GTX 1650 Ti Max-Q:
192.9  fps
ultra 1920x1080
GeForce GTX 1650 Ti Max-Q:
165.2  fps
QHD 2560x1440
GeForce GTX 1650 Ti Max-Q:
129.6  fps
4K 3840x2160
GeForce GTX 1650 Ti Max-Q:
79.6  fps
low 1280x720
GeForce GTX 1650 Ti Max-Q:
222  fps
med. 1920x1080
GeForce GTX 1650 Ti Max-Q:
124  fps
high 1920x1080
GeForce GTX 1650 Ti Max-Q:
112.9  fps
ultra 1920x1080
GeForce GTX 1650 Ti Max-Q:
103.4  fps
QHD 2560x1440
GeForce GTX 1650 Ti Max-Q:
70  fps
4K 3840x2160
GeForce GTX 1650 Ti Max-Q:
30.7  fps
low 1280x720
GeForce GTX 1650 Ti Max-Q:
93.9  fps
med. 1920x1080
GeForce GTX 1650 Ti Max-Q:
46.2  fps
high 1920x1080
GeForce GTX 1650 Ti Max-Q:
43  fps
QHD 2560x1440
GeForce GTX 1650 Ti Max-Q:
27.9  fps
4K 3840x2160
GeForce GTX 1650 Ti Max-Q:
14.1  fps
low 1280x720
GeForce GTX 1650 Ti Max-Q:
94.8 115.7 ~ 105 fps
med. 1920x1080
GeForce GTX 1650 Ti Max-Q:
47.5 51.9 ~ 50 fps
high 1920x1080
GeForce GTX 1650 Ti Max-Q:
36.8 40.8 ~ 39 fps
ultra 1920x1080
GeForce GTX 1650 Ti Max-Q:
20.9 30.5 ~ 26 fps
QHD 2560x1440
GeForce GTX 1650 Ti Max-Q:
22.3  fps
low 1280x720
GeForce GTX 1650 Ti Max-Q:
154.1  fps
med. 1920x1080
GeForce GTX 1650 Ti Max-Q:
59.8  fps
high 1920x1080
GeForce GTX 1650 Ti Max-Q:
31.9  fps
ultra 1920x1080
GeForce GTX 1650 Ti Max-Q:
23.6  fps
low 1280x720
GeForce GTX 1650 Ti Max-Q:
80 99 ~ 90 fps
med. 1920x1080
GeForce GTX 1650 Ti Max-Q:
42 58 ~ 50 fps
high 1920x1080
GeForce GTX 1650 Ti Max-Q:
35 36 48 ~ 40 fps
ultra 1920x1080
GeForce GTX 1650 Ti Max-Q:
32 40 ~ 36 fps
QHD 2560x1440
GeForce GTX 1650 Ti Max-Q:
30  fps
4K 3840x2160
GeForce GTX 1650 Ti Max-Q:
8  fps
low 1280x720
GeForce GTX 1650 Ti Max-Q:
85.6 99.6 ~ 93 fps
med. 1920x1080
GeForce GTX 1650 Ti Max-Q:
53.6 60.9 ~ 57 fps
high 1920x1080
GeForce GTX 1650 Ti Max-Q:
50.7 56.4 ~ 54 fps
ultra 1920x1080
GeForce GTX 1650 Ti Max-Q:
49.5 54.4 ~ 52 fps
QHD 2560x1440
GeForce GTX 1650 Ti Max-Q:
35.9  fps
4K 3840x2160
GeForce GTX 1650 Ti Max-Q:
16.8  fps
F1 2020

F1 2020

2020
low 1280x720
GeForce GTX 1650 Ti Max-Q:
211  fps
med. 1920x1080
GeForce GTX 1650 Ti Max-Q:
107  fps
high 1920x1080
GeForce GTX 1650 Ti Max-Q:
82  fps
ultra 1920x1080
GeForce GTX 1650 Ti Max-Q:
57  fps
QHD 2560x1440
GeForce GTX 1650 Ti Max-Q:
41  fps
4K 3840x2160
GeForce GTX 1650 Ti Max-Q:
22  fps
low 1280x720
GeForce GTX 1650 Ti Max-Q:
162.9  fps
med. 1920x1080
GeForce GTX 1650 Ti Max-Q:
73.7  fps
high 1920x1080
GeForce GTX 1650 Ti Max-Q:
44.4  fps
ultra 1920x1080
GeForce GTX 1650 Ti Max-Q:
33.4  fps
QHD 2560x1440
GeForce GTX 1650 Ti Max-Q:
23.5  fps
4K 3840x2160
GeForce GTX 1650 Ti Max-Q:
13.5  fps
low 1280x720
GeForce GTX 1650 Ti Max-Q:
145.1  fps
med. 1920x1080
GeForce GTX 1650 Ti Max-Q:
91.2  fps
high 1920x1080
GeForce GTX 1650 Ti Max-Q:
52.6  fps
low 1280x720
GeForce GTX 1650 Ti Max-Q:
115.7  fps
med. 1920x1080
GeForce GTX 1650 Ti Max-Q:
50.1  fps
high 1920x1080
GeForce GTX 1650 Ti Max-Q:
41.8  fps
low 1280x720
GeForce GTX 1650 Ti Max-Q:
120.7  fps
med. 1920x1080
GeForce GTX 1650 Ti Max-Q:
71.2  fps
high 1920x1080
GeForce GTX 1650 Ti Max-Q:
52.8  fps
ultra 1920x1080
GeForce GTX 1650 Ti Max-Q:
47  fps
med. 1920x1080
GeForce GTX 1650 Ti Max-Q:
63.3  fps
high 1920x1080
GeForce GTX 1650 Ti Max-Q:
53.2  fps
ultra 1920x1080
GeForce GTX 1650 Ti Max-Q:
46  fps
low 1280x720
GeForce GTX 1650 Ti Max-Q:
61.8  fps
med. 1920x1080
GeForce GTX 1650 Ti Max-Q:
49.3  fps
high 1920x1080
GeForce GTX 1650 Ti Max-Q:
45.8  fps
ultra 1920x1080
GeForce GTX 1650 Ti Max-Q:
33.9  fps
GRID 2019

GRID 2019

2019
low 1280x720
GeForce GTX 1650 Ti Max-Q:
114  fps
med. 1920x1080
GeForce GTX 1650 Ti Max-Q:
76.9  fps
high 1920x1080
GeForce GTX 1650 Ti Max-Q:
64.3  fps
ultra 1920x1080
GeForce GTX 1650 Ti Max-Q:
27.5  fps
low 1280x720
GeForce GTX 1650 Ti Max-Q:
74  fps
med. 1920x1080
GeForce GTX 1650 Ti Max-Q:
45  fps
high 1920x1080
GeForce GTX 1650 Ti Max-Q:
34  fps
ultra 1920x1080
GeForce GTX 1650 Ti Max-Q:
22  fps
low 1280x720
GeForce GTX 1650 Ti Max-Q:
102.8  fps
med. 1920x1080
GeForce GTX 1650 Ti Max-Q:
52.6  fps
high 1920x1080
GeForce GTX 1650 Ti Max-Q:
34.7  fps
ultra 1920x1080
GeForce GTX 1650 Ti Max-Q:
26.1  fps
Control

Control

2019
low 1280x720
GeForce GTX 1650 Ti Max-Q:
104.7  fps
med. 1920x1080
GeForce GTX 1650 Ti Max-Q:
39.2  fps
high 1920x1080
GeForce GTX 1650 Ti Max-Q:
29.1  fps
F1 2019

F1 2019

2019
low 1280x720
GeForce GTX 1650 Ti Max-Q:
171  fps
med. 1920x1080
GeForce GTX 1650 Ti Max-Q:
89  fps
high 1920x1080
GeForce GTX 1650 Ti Max-Q:
71  fps
ultra 1920x1080
GeForce GTX 1650 Ti Max-Q:
62  fps
low 1280x720
GeForce GTX 1650 Ti Max-Q:
155.9 164.3 176 ~ 165 fps
med. 1920x1080
GeForce GTX 1650 Ti Max-Q:
56 57.5 60.3 ~ 58 fps
high 1920x1080
GeForce GTX 1650 Ti Max-Q:
33.4 36 36.5 ~ 35 fps
ultra 1920x1080
GeForce GTX 1650 Ti Max-Q:
18.6 21.6 31.4 ~ 24 fps
Anno 1800

Anno 1800

2019
low 1280x720
GeForce GTX 1650 Ti Max-Q:
89.4  fps
med. 1920x1080
GeForce GTX 1650 Ti Max-Q:
65.8  fps
high 1920x1080
GeForce GTX 1650 Ti Max-Q:
41.1  fps
ultra 1920x1080
GeForce GTX 1650 Ti Max-Q:
21.5  fps
low 1280x720
GeForce GTX 1650 Ti Max-Q:
93  fps
med. 1920x1080
GeForce GTX 1650 Ti Max-Q:
51  fps
high 1920x1080
GeForce GTX 1650 Ti Max-Q:
41  fps
ultra 1920x1080
GeForce GTX 1650 Ti Max-Q:
30  fps
low 1280x720
GeForce GTX 1650 Ti Max-Q:
195.9  fps
med. 1920x1080
GeForce GTX 1650 Ti Max-Q:
63.1  fps
high 1920x1080
GeForce GTX 1650 Ti Max-Q:
55.1  fps
ultra 1920x1080
GeForce GTX 1650 Ti Max-Q:
38.1  fps
low 1280x720
GeForce GTX 1650 Ti Max-Q:
89  fps
med. 1920x1080
GeForce GTX 1650 Ti Max-Q:
56  fps
high 1920x1080
GeForce GTX 1650 Ti Max-Q:
53  fps
ultra 1920x1080
GeForce GTX 1650 Ti Max-Q:
49  fps
low 1280x720
GeForce GTX 1650 Ti Max-Q:
83.1  fps
med. 1920x1080
GeForce GTX 1650 Ti Max-Q:
40.1  fps
high 1920x1080
GeForce GTX 1650 Ti Max-Q:
29.8  fps
ultra 1920x1080
GeForce GTX 1650 Ti Max-Q:
23.2  fps
low 1280x720
GeForce GTX 1650 Ti Max-Q:
143.7  fps
med. 1920x1080
GeForce GTX 1650 Ti Max-Q:
86.2  fps
high 1920x1080
GeForce GTX 1650 Ti Max-Q:
68.7  fps
ultra 1920x1080
GeForce GTX 1650 Ti Max-Q:
62.9  fps
low 1280x720
GeForce GTX 1650 Ti Max-Q:
63  fps
med. 1920x1080
GeForce GTX 1650 Ti Max-Q:
49  fps
high 1920x1080
GeForce GTX 1650 Ti Max-Q:
41  fps
ultra 1920x1080
GeForce GTX 1650 Ti Max-Q:
19  fps
low 1280x720
GeForce GTX 1650 Ti Max-Q:
97.2 102 106 112 115 ~ 106 fps
med. 1920x1080
GeForce GTX 1650 Ti Max-Q:
52.8 55 55 56 64 ~ 57 fps
high 1920x1080
GeForce GTX 1650 Ti Max-Q:
40 44 46 52.5 55 ~ 48 fps
ultra 1920x1080
GeForce GTX 1650 Ti Max-Q:
34 37 40 43.3 48 ~ 40 fps
4K 3840x2160
GeForce GTX 1650 Ti Max-Q:
15 15 ~ 15 fps
Strange Brigade

Strange Brigade

2018
low 1280x720
GeForce GTX 1650 Ti Max-Q:
167 188 196 ~ 184 fps
med. 1920x1080
GeForce GTX 1650 Ti Max-Q:
68.6 76.5 81.5 ~ 76 fps
high 1920x1080
GeForce GTX 1650 Ti Max-Q:
54.9 62.2 65.6 ~ 61 fps
ultra 1920x1080
GeForce GTX 1650 Ti Max-Q:
47.9 53.6 55.2 ~ 52 fps
QHD 2560x1440
GeForce GTX 1650 Ti Max-Q:
35  fps
4K 3840x2160
GeForce GTX 1650 Ti Max-Q:
21.4  fps
Far Cry 5

Far Cry 5

2018
low 1280x720
GeForce GTX 1650 Ti Max-Q:
90 102 115 ~ 102 fps
med. 1920x1080
GeForce GTX 1650 Ti Max-Q:
46 56 64 ~ 55 fps
high 1920x1080
GeForce GTX 1650 Ti Max-Q:
42 51 60 ~ 51 fps
ultra 1920x1080
GeForce GTX 1650 Ti Max-Q:
39 47 48 56 ~ 48 fps
QHD 2560x1440
GeForce GTX 1650 Ti Max-Q:
27 38 ~ 33 fps
4K 3840x2160
GeForce GTX 1650 Ti Max-Q:
14 17 ~ 16 fps
low 1280x720
GeForce GTX 1650 Ti Max-Q:
79 80.2 85.9 86.6 86.8 91.2 92.6 93.9 96.4 97.5 98 ~ 90 fps
med. 1920x1080
GeForce GTX 1650 Ti Max-Q:
71.5 71.9 72.8 73.5 78.2 79.2 79.4 80.7 83.5 83.9 87.5 ~ 78 fps
high 1920x1080
GeForce GTX 1650 Ti Max-Q:
60.5 62.6 62.7 63.1 66.4 66.7 67.5 69.7 70.6 70.8 72.3 ~ 67 fps
4K 3840x2160
GeForce GTX 1650 Ti Max-Q:
39.2 49.2 52.8 ~ 47 fps
low 1280x720
GeForce GTX 1650 Ti Max-Q:
72 90.1 94 ~ 85 fps
med. 1920x1080
GeForce GTX 1650 Ti Max-Q:
38.3 46.3 48.1 ~ 44 fps
high 1920x1080
GeForce GTX 1650 Ti Max-Q:
26.1 32.5 33.9 ~ 31 fps
QHD 2560x1440
GeForce GTX 1650 Ti Max-Q:
19.3  fps
4K 3840x2160
GeForce GTX 1650 Ti Max-Q:
10.1  fps
low 1280x720
100%
GeForce GTX 970M SLI:
107.6  fps
med. 1366x768
100%
GeForce GTX 970M SLI:
102.5  fps
high 1920x1080
100%
GeForce GTX 970M SLI:
90.7  fps
ultra 1920x1080
100%
GeForce GTX 970M SLI:
68.1  fps
4K 3840x2160
100%
GeForce GTX 970M SLI:
37.1  fps
low 1280x720
100%
GeForce GTX 970M SLI:
60.7  fps
med. 1366x768
100%
GeForce GTX 970M SLI:
60.3  fps
high 1920x1080
100%
GeForce GTX 970M SLI:
52.2  fps
ultra 1920x1080
100%
GeForce GTX 970M SLI:
50.2  fps
4K 3840x2160
100%
GeForce GTX 970M SLI:
25.1  fps
low 1280x720
100%
GeForce GTX 970M SLI:
161.3  fps
med. 1366x768
100%
GeForce GTX 970M SLI:
129.4  fps
high 1920x1080
100%
GeForce GTX 970M SLI:
71.9  fps
ultra 1920x1080
100%
GeForce GTX 970M SLI:
54.9  fps
4K 3840x2160
100%
GeForce GTX 970M SLI:
26.2  fps
low 1280x720
100%
GeForce GTX 970M SLI:
69  fps
med. 1920x1080
100%
GeForce GTX 970M SLI:
64  fps
high 1920x1080
100%
GeForce GTX 970M SLI:
63  fps
ultra 1920x1080
100%
GeForce GTX 970M SLI:
60  fps
4K 3840x2160
100%
GeForce GTX 970M SLI:
27  fps
XCOM 2

XCOM 2

2016
low 1280x720
100%
GeForce GTX 970M SLI:
94.6  fps
med. 1920x1080
100%
GeForce GTX 970M SLI:
80.2  fps
high 1920x1080
100%
GeForce GTX 970M SLI:
67.2  fps
ultra 1920x1080
100%
GeForce GTX 970M SLI:
31.7  fps
low 1024x768
100%
GeForce GTX 970M SLI:
78.7  fps
161%
GeForce GTX 1650 Ti Max-Q:
89.7 163.4 ~ 127 fps
med. 1366x768
100%
GeForce GTX 970M SLI:
72.4  fps
133%
GeForce GTX 1650 Ti Max-Q:
84.7 107.4 ~ 96 fps
high 1920x1080
100%
GeForce GTX 970M SLI:
71.4  fps
83%
GeForce GTX 1650 Ti Max-Q:
58.1 60.5 ~ 59 fps
ultra 1920x1080
100%
GeForce GTX 970M SLI:
68  fps
72%
GeForce GTX 1650 Ti Max-Q:
48.9 49.1 ~ 49 fps
4K 3840x2160
100%
GeForce GTX 970M SLI:
31.9  fps
66%
GeForce GTX 1650 Ti Max-Q:
19.9 22.9 ~ 21 fps
low 1024x768
100%
GeForce GTX 970M SLI:
234.5  fps
med. 1366x768
100%
GeForce GTX 970M SLI:
185.5  fps
high 1920x1080
100%
GeForce GTX 970M SLI:
110.7  fps
ultra 1920x1080
100%
GeForce GTX 970M SLI:
94.6  fps
4K 3840x2160
100%
GeForce GTX 970M SLI:
33.5  fps
low 1024x768
100%
GeForce GTX 970M SLI:
127.6  fps
med. 1366x768
100%
GeForce GTX 970M SLI:
104.5  fps
high 1920x1080
100%
GeForce GTX 970M SLI:
60.1  fps
ultra 1920x1080
100%
GeForce GTX 970M SLI:
51.7  fps
4K 3840x2160
100%
GeForce GTX 970M SLI:
21.3  fps
low 1024x768
100%
GeForce GTX 970M SLI:
199.8  fps
med. 1366x768
100%
GeForce GTX 970M SLI:
196.9  fps
high 1920x1080
100%
GeForce GTX 970M SLI:
127.1  fps
ultra 1920x1080
100%
GeForce GTX 970M SLI:
109.3  fps
4K 3840x2160
100%
GeForce GTX 970M SLI:
40.8  fps
low 1024x768
100%
GeForce GTX 970M SLI:
83.6  fps
med. 1366x768
100%
GeForce GTX 970M SLI:
81.4  fps
high 1920x1080
100%
GeForce GTX 970M SLI:
76.3  fps
ultra 1920x1080
100%
GeForce GTX 970M SLI:
37.6  fps
4K 3840x2160
100%
GeForce GTX 970M SLI:
30.8  fps
Fallout 4

Fallout 4

2015
low 1280x720
100%
GeForce GTX 970M SLI:
145.9  fps
med. 1366x768
100%
GeForce GTX 970M SLI:
139.2  fps
high 1920x1080
100%
GeForce GTX 970M SLI:
96  fps
ultra 1920x1080
100%
GeForce GTX 970M SLI:
78.4  fps
4K 3840x2160
100%
GeForce GTX 970M SLI:
32.4  fps
low 1024x768
100%
GeForce GTX 970M SLI:
141.1  fps
med. 1366x768
100%
GeForce GTX 970M SLI:
138.4  fps
high 1920x1080
100%
GeForce GTX 970M SLI:
109.2  fps
ultra 1920x1080
100%
GeForce GTX 970M SLI:
98.9  fps
4K 3840x2160
100%
GeForce GTX 970M SLI:
36  fps
Anno 2205

Anno 2205

2015
low 1024x768
100%
GeForce GTX 970M SLI:
116.3  fps
med. 1366x768
100%
GeForce GTX 970M SLI:
110.3  fps
high 1920x1080
100%
GeForce GTX 970M SLI:
55.6  fps
ultra 1920x1080
100%
GeForce GTX 970M SLI:
17.5  fps
4K 3840x2160
100%
GeForce GTX 970M SLI:
21.4  fps
FIFA 16

FIFA 16

2015
low 1280x720
100%
GeForce GTX 970M SLI:
302.4  fps
high 1366x768
100%
GeForce GTX 970M SLI:
247  fps
ultra 1920x1080
100%
GeForce GTX 970M SLI:
173.1  fps
4K 3840x2160
100%
GeForce GTX 970M SLI:
70.8  fps
Mad Max

Mad Max

2015
med. 1366x768
100%
GeForce GTX 970M SLI:
225  fps
high 1920x1080
100%
GeForce GTX 970M SLI:
157.4  fps
ultra 1920x1080
100%
GeForce GTX 970M SLI:
145.1  fps
4K 3840x2160
100%
GeForce GTX 970M SLI:
49.7  fps
low 1280x720
GeForce GTX 1650 Ti Max-Q:
118 128 130 137 140 140 142 143 143 144 147 ~ 137 fps
med. 1366x768
GeForce GTX 1650 Ti Max-Q:
112 116 117 118 118 119 121 124 124 127 129 ~ 120 fps
high 1920x1080
GeForce GTX 1650 Ti Max-Q:
107 107 109 111 111 112 113 115 117 117 121 ~ 113 fps
ultra 1920x1080
GeForce GTX 1650 Ti Max-Q:
101 103 104 104 105 106 107 108 108 109 110 ~ 106 fps
4K 3840x2160
GeForce GTX 1650 Ti Max-Q:
41.5 51.5 58.2 ~ 50 fps
low 1280x720
100%
GeForce GTX 970M SLI:
119  fps
med. 1366x768
100%
GeForce GTX 970M SLI:
108  fps
high 1920x1080
100%
GeForce GTX 970M SLI:
59 62 ~ 61 fps
ultra 1920x1080
100%
GeForce GTX 970M SLI:
39 44 ~ 42 fps
4K 3840x2160
100%
GeForce GTX 970M SLI:
18  fps
low 1024x768
100%
GeForce GTX 970M SLI:
205.1  fps
82%
GeForce GTX 1650 Ti Max-Q:
144.3 153 153.2 156.8 159.5 167.9 183 198.6 199 ~ 168 fps
med. 1366x768
100%
GeForce GTX 970M SLI:
144.7  fps
70%
GeForce GTX 1650 Ti Max-Q:
76.3 87.3 90 92 92 100.3 117 127 132 ~ 102 fps
high 1920x1080
100%
GeForce GTX 970M SLI:
84.8  fps
65%
GeForce GTX 1650 Ti Max-Q:
47.9 52.6 52.8 53.6 53.8 54.9 55 56.4 61 66 ~ 55 fps
ultra 1920x1080
100%
GeForce GTX 970M SLI:
47.6  fps
67%
GeForce GTX 1650 Ti Max-Q:
25.3 29.8 30.1 30.7 31.5 32.5 34.8 35 36.1 ~ 32 fps
4K 3840x2160
100%
GeForce GTX 970M SLI:
28.4  fps
70%
GeForce GTX 1650 Ti Max-Q:
16.8 19.3 21.3 24 ~ 20 fps
low 1024x768
100%
GeForce GTX 970M SLI:
374.4  fps
med. 1366x768
100%
GeForce GTX 970M SLI:
168  fps
high 1920x1080
100%
GeForce GTX 970M SLI:
135.6  fps
ultra 1920x1080
100%
GeForce GTX 970M SLI:
83.3  fps
4K 3840x2160
100%
GeForce GTX 970M SLI:
71.4  fps
GTA V

GTA V

2015
low 1024x768
GeForce GTX 1650 Ti Max-Q:
156 167 171 ~ 165 fps
med. 1366x768
GeForce GTX 1650 Ti Max-Q:
145 157 164 ~ 155 fps
high 1920x1080
GeForce GTX 1650 Ti Max-Q:
73.2 88.1 91.5 ~ 84 fps
ultra 1920x1080
GeForce GTX 1650 Ti Max-Q:
37.1 45.3 45.4 ~ 43 fps
QHD 2560x1440
GeForce GTX 1650 Ti Max-Q:
26  fps
4K 3840x2160
GeForce GTX 1650 Ti Max-Q:
24.8  fps
low 1024x768
100%
GeForce GTX 970M SLI:
163.1  fps
med. 1366x768
100%
GeForce GTX 970M SLI:
155  fps
high 1920x1080
100%
GeForce GTX 970M SLI:
102.5 143.1 ~ 123 fps
ultra 1920x1080
100%
GeForce GTX 970M SLI:
97.7 101.3 ~ 100 fps
Evolve

Evolve

2015
low 1024x768
100%
GeForce GTX 970M SLI:
189.3  fps
med. 1366x768
100%
GeForce GTX 970M SLI:
178.3  fps
high 1920x1080
100%
GeForce GTX 970M SLI:
130.7  fps
ultra 1920x1080
100%
GeForce GTX 970M SLI:
117.2  fps
low 1024x768
100%
GeForce GTX 970M SLI:
161.3  fps
med. 1366x768
100%
GeForce GTX 970M SLI:
147.8  fps
high 1920x1080
100%
GeForce GTX 970M SLI:
100.3 100.3 ~ 100 fps
ultra 1920x1080
100%
GeForce GTX 970M SLI:
69.8 70 ~ 70 fps
Far Cry 4

Far Cry 4

2014
low 1024x768
100%
GeForce GTX 970M SLI:
117.4  fps
med. 1366x768
100%
GeForce GTX 970M SLI:
114.3  fps
high 1920x1080
100%
GeForce GTX 970M SLI:
101.7  fps
ultra 1920x1080
100%
GeForce GTX 970M SLI:
89.9  fps
low 1024x768
100%
GeForce GTX 970M SLI:
117.1  fps
med. 1366x768
100%
GeForce GTX 970M SLI:
110.5  fps
high 1920x1080
100%
GeForce GTX 970M SLI:
83.6  fps
ultra 1920x1080
100%
GeForce GTX 970M SLI:
46  fps
low 1024x768
100%
GeForce GTX 970M SLI:
153.9  fps
med. 1366x768
100%
GeForce GTX 970M SLI:
115.4  fps
high 1920x1080
100%
GeForce GTX 970M SLI:
106.8  fps
ultra 1920x1080
100%
GeForce GTX 970M SLI:
65.6  fps
low 1024x768
100%
GeForce GTX 970M SLI:
159.4  fps
med. 1366x768
100%
GeForce GTX 970M SLI:
150.9  fps
high 1920x1080
100%
GeForce GTX 970M SLI:
115.2  fps
ultra 1920x1080
100%
GeForce GTX 970M SLI:
104.6  fps
F1 2014

F1 2014

2014
low 1024x768
100%
GeForce GTX 970M SLI:
118  fps
med. 1366x768
100%
GeForce GTX 970M SLI:
118  fps
high 1920x1080
100%
GeForce GTX 970M SLI:
118 118 ~ 118 fps
ultra 1920x1080
100%
GeForce GTX 970M SLI:
105 118 ~ 112 fps
low 1024x768
100%
GeForce GTX 970M SLI:
74.8  fps
med. 1366x768
100%
GeForce GTX 970M SLI:
73.8  fps
high 1920x1080
100%
GeForce GTX 970M SLI:
53.8  fps
low 1024x768
100%
GeForce GTX 970M SLI:
63.6  fps
med. 1366x768
100%
GeForce GTX 970M SLI:
62.9  fps
high 1920x1080
100%
GeForce GTX 970M SLI:
61.6 68.7 ~ 65 fps
ultra 1920x1080
100%
GeForce GTX 970M SLI:
61.1 68 ~ 65 fps
low 1024x768
100%
GeForce GTX 970M SLI:
264.9  fps
med. 1366x768
100%
GeForce GTX 970M SLI:
237.9  fps
high 1920x1080
100%
GeForce GTX 970M SLI:
153  fps
ultra 1920x1080
100%
GeForce GTX 970M SLI:
114.1  fps
low 1280x720
100%
GeForce GTX 970M SLI:
268.9  fps
med. 1344x756
100%
GeForce GTX 970M SLI:
209.4  fps
high 1920x1080
100%
GeForce GTX 970M SLI:
105.2 133.5 ~ 119 fps
ultra 1920x1080
100%
GeForce GTX 970M SLI:
89.9 106.5 ~ 98 fps
Fifa 15

Fifa 15

2014
low 1280x720
100%
GeForce GTX 970M SLI:
380.3  fps
high 1366x768
100%
GeForce GTX 970M SLI:
288.1  fps
ultra 1920x1080
100%
GeForce GTX 970M SLI:
211.7  fps
4K 3840x2160
100%
GeForce GTX 970M SLI:
96  fps
Sims 4

Sims 4

2014
low 1024x768
100%
GeForce GTX 970M SLI:
193.2  fps
med. 1366x768
100%
GeForce GTX 970M SLI:
157.7  fps
high 1920x1080
100%
GeForce GTX 970M SLI:
119.8  fps
ultra 1920x1080
100%
GeForce GTX 970M SLI:
104.8  fps
low 1024x768
100%
GeForce GTX 970M SLI:
35.2  fps
med. 1366x768
100%
GeForce GTX 970M SLI:
35.2  fps
high 1920x1080
100%
GeForce GTX 970M SLI:
35  fps
ultra 1920x1080
100%
GeForce GTX 970M SLI:
37.6  fps
low 1024x768
100%
GeForce GTX 970M SLI:
374.1  fps
med. 1366x768
100%
GeForce GTX 970M SLI:
207.4  fps
high 1920x1080
100%
GeForce GTX 970M SLI:
165.7  fps
ultra 1920x1080
100%
GeForce GTX 970M SLI:
118.8  fps
low 1024x768
100%
GeForce GTX 970M SLI:
103.6  fps
med. 1366x768
100%
GeForce GTX 970M SLI:
89.4  fps
high 1920x1080
100%
GeForce GTX 970M SLI:
63.9  fps
ultra 1920x1080
100%
GeForce GTX 970M SLI:
45.5  fps
low 1280x720
100%
GeForce GTX 970M SLI:
60  fps
med. 1280x720
100%
GeForce GTX 970M SLI:
60  fps
high 1920x1080
100%
GeForce GTX 970M SLI:
60  fps
ultra 1920x1080
100%
GeForce GTX 970M SLI:
55.7  fps
Thief

Thief

2014
low 1024x768
100%
GeForce GTX 970M SLI:
125.5  fps
med. 1366x768
100%
GeForce GTX 970M SLI:
119.7  fps
high 1366x768
100%
GeForce GTX 970M SLI:
98.5 115.1 ~ 107 fps
ultra 1920x1080
100%
GeForce GTX 970M SLI:
83.8 86.8 ~ 85 fps
low 1024x768
100%
GeForce GTX 970M SLI:
238.3  fps
med. 1366x768
100%
GeForce GTX 970M SLI:
204.1  fps
high 1366x768
100%
GeForce GTX 970M SLI:
140.2  fps
ultra 1920x1080
100%
GeForce GTX 970M SLI:
90.2  fps
low 1024x768
100%
GeForce GTX 970M SLI:
199.6  fps
med. 1366x768
100%
GeForce GTX 970M SLI:
199  fps
high 1366x768
100%
GeForce GTX 970M SLI:
196.6  fps
ultra 1920x1080
100%
GeForce GTX 970M SLI:
104.3  fps
4K 3840x2160
100%
GeForce GTX 970M SLI:
48.7  fps
low 1280x720
100%
GeForce GTX 970M SLI:
76.6  fps
med. 1366x768
100%
GeForce GTX 970M SLI:
88.9  fps
high 1366x768
100%
GeForce GTX 970M SLI:
90.9  fps
ultra 1920x1080
100%
GeForce GTX 970M SLI:
92.5  fps
Dota 2

Dota 2

2013
low 1024x768
100%
GeForce GTX 970M SLI:
119.7  fps
med. 1366x768
100%
GeForce GTX 970M SLI:
119.7  fps
ultra 1920x1080
100%
GeForce GTX 970M SLI:
119.4  fps
low 1024x768
100%
GeForce GTX 970M SLI:
139.7  fps
med. 1366x768
100%
GeForce GTX 970M SLI:
137  fps
high 1366x768
100%
GeForce GTX 970M SLI:
112.1 120.6 ~ 116 fps
ultra 1920x1080
100%
GeForce GTX 970M SLI:
79.2 82.6 ~ 81 fps
low 1280x720
100%
GeForce GTX 970M SLI:
290.2  fps
med. 1366x768
100%
GeForce GTX 970M SLI:
273.1  fps
high 1366x768
100%
GeForce GTX 970M SLI:
206.9 233.7 ~ 220 fps
ultra 1920x1080
100%
GeForce GTX 970M SLI:
130.1 132 ~ 131 fps
high 1366x768
100%
GeForce GTX 970M SLI:
138.1  fps
ultra 1920x1080
100%
GeForce GTX 970M SLI:
85.9  fps
low 1024x768
100%
GeForce GTX 970M SLI:
519  fps
med. 1366x768
100%
GeForce GTX 970M SLI:
465.4  fps
high 1366x768
100%
GeForce GTX 970M SLI:
351.8 363.7 ~ 358 fps
ultra 1920x1080
100%
GeForce GTX 970M SLI:
156.5 175.1 ~ 166 fps
Crysis 3

Crysis 3

2013
low 1024x768
100%
GeForce GTX 970M SLI:
154.4  fps
med. 1366x768
100%
GeForce GTX 970M SLI:
138.3  fps
high 1366x768
100%
GeForce GTX 970M SLI:
111.7  fps
ultra 1920x1080
100%
GeForce GTX 970M SLI:
56.3  fps
Far Cry 3

Far Cry 3

2012
low 1024x768
100%
GeForce GTX 970M SLI:
145.4  fps
med. 1366x768
100%
GeForce GTX 970M SLI:
137.9  fps
high 1366x768
100%
GeForce GTX 970M SLI:
117.1  fps
ultra 1920x1080
100%
GeForce GTX 970M SLI:
74.5  fps
low 1024x768
100%
GeForce GTX 970M SLI:
113.1  fps
med. 1366x768
100%
GeForce GTX 970M SLI:
108.3  fps
high 1366x768
100%
GeForce GTX 970M SLI:
99.3  fps
ultra 1920x1080
100%
GeForce GTX 970M SLI:
76.2  fps
low 1024x768
100%
GeForce GTX 970M SLI:
160.7  fps
high 1366x768
100%
GeForce GTX 970M SLI:
66.4 85.6 ~ 76 fps
ultra 1920x1080
100%
GeForce GTX 970M SLI:
62.5 78.2 ~ 70 fps
high 1366x768
100%
GeForce GTX 970M SLI:
182.8  fps
ultra 1920x1080
100%
GeForce GTX 970M SLI:
92.5  fps

Average Gaming NVIDIA GeForce GTX 970M SLI → 100%

Average Gaming 30-70 fps → 100%

Average Gaming NVIDIA GeForce GTX 1650 Ti Max-Q → 87%

Average Gaming 30-70 fps → 72%

NVIDIA GeForce GTX 970M SLINVIDIA GeForce GTX 1650 Ti Max-Q
lowmed.highultraQHD4Klowmed.highultraQHD4K
Cyberpunk 2077 1.063.73326.822.2
Immortals Fenyx Rising744735292414
Yakuza Like a Dragon10145433825.412.4
Call of Duty Black Ops Cold War10055.644.140.225.810.6
Assassin´s Creed Valhalla61382510125
Watch Dogs Legion8049411614
FIFA 21210202192.9165.2129.679.6
Star Wars Squadrons222124112.9103.47030.7
Mafia Definitive Edition93.946.24327.914.1
Serious Sam 410550392622.3
Crysis Remastered154.159.831.923.6
Horizon Zero Dawn90504036308
Death Stranding9357545235.916.8
F1 202021110782574122
Gears Tactics162.973.744.433.423.513.5
Doom Eternal145.191.252.6
Hunt Showdown115.750.141.8
Escape from Tarkov120.771.252.847
Star Wars Jedi Fallen Order63.353.246
Need for Speed Heat61.849.345.833.9
GRID 201911476.964.327.5
Ghost Recon Breakpoint74453422
Borderlands 3102.852.634.726.1
Control104.739.229.1
F1 2019171897162
Total War: Three Kingdoms165583524
Anno 180089.465.841.121.5
The Division 293514130
Dirt Rally 2.0195.963.155.138.1
Far Cry New Dawn89565349
Metro Exodus83.140.129.823.2
Apex Legends143.786.268.762.9
Assassin´s Creed Odyssey63494119
Shadow of the Tomb Raider10657484015
Strange Brigade1847661523521.4
Far Cry 51025551483316
X-Plane 11.1190786747
Final Fantasy XV Benchmark85443119.310.1
Rise of the Tomb Raider78.772.471.46831.912796594921
Dota 2 Reborn13712011310650
The Witcher 3205.1144.784.847.628.4168102553220
GTA V16515584432624.8
NVIDIA GeForce GTX 970M SLINVIDIA GeForce GTX 1650 Ti Max-Q
lowmed.highultraQHD4Klowmed.highultraQHD4K
< 30 fps
< 60 fps
< 120 fps
≥ 120 fps


1
1


1
1


2

1
1


1
1

< 30 fps
< 60 fps
< 120 fps
≥ 120 fps


25
16

24
14
4
4
28
9
1
13
18
4
1
10
5
1
1
16
3
1

Eine Liste mit weiteren Spielen und allen Grafikkarten finden Sie auf unserer Seite: Welches Spiel ist mit welcher Grafikkarte spielbar?

Add one or more devices and compare

In the following list you can select (and also search for) devices that should be added to the comparison. You can select more than one device.

restrict list:
v1.35
log 05. 06:48:09

#0 ran 0s before starting gpusingle class +0s ... 0s

#1 checking url part for id 5998 +0s ... 0s

#2 checking url part for id 10309 +0s ... 0s

#3 redirected to Ajax server, took 1767592089s time from redirect:0 +0s ... 0s

#4 did not recreate cache, as it is less than 5 days old! Created at Sun, 04 Jan 2026 05:18:59 +0100 +0s ... 0s

#5 composed specs +0.039s ... 0.039s

#6 did output specs +0s ... 0.04s

#7 start showIntegratedCPUs +0s ... 0.04s

#8 getting avg benchmarks for device 5998 +0.017s ... 0.057s

#9 got single benchmarks 5998 +0.006s ... 0.063s

#10 getting avg benchmarks for device 10309 +0s ... 0.063s

#11 got single benchmarks 10309 +0.013s ... 0.077s

#12 got avg benchmarks for devices +0s ... 0.077s

#13 min, max, avg, median took s +0.024s ... 0.1s

#14 before gaming benchmark output +0s ... 0.1s

#15 Got 637 rows for game benchmarks. +0.025s ... 0.125s

#16 composed SQL query for gamebenchmarks +0s ... 0.125s

#17 got data and put it in $dataArray +0.005s ... 0.13s

#18 benchmarks composed for output. +0.027s ... 0.157s

#19 calculated avg scores. +0s ... 0.157s

#20 return log +0.002s ... 0.159s

Teilen Sie diesen Artikel, um uns zu unterstützen. Jeder Link hilft!
Mail Logo
> Notebook Test, Laptop Test und News > Benchmarks / Technik > Benchmarks / Technik > Grafikkarten Vergleich - Head 2 Head
Autor: Klaus Hinum,  8.09.2017 (Update:  1.07.2023)