
Test OCZ Vertex 460 240 GB SSD (VTX460-25SAT3-240G)
Barfuß. Mit Barefoot 3 M10 an der Konkurrenz vorbei? Solide Benchmarks und ein attraktives Platzangebot zum günstigen Preis sind wohl eher die Attribute des Massenspeichers. Wir haben mit einer Low- und einer High-End-Plattform nachgemessen.
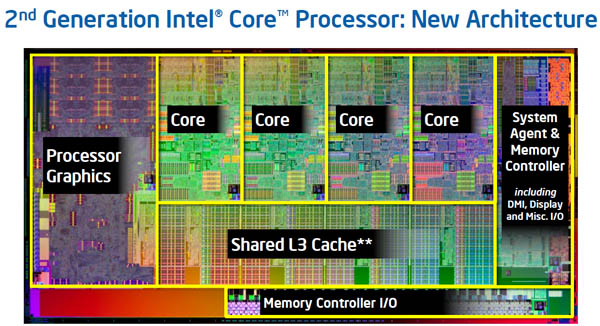
Intel Core i7-2600K, NVIDIA GeForce GTX 680