Testberichte für den Intel Core i5-8250U Prozessor
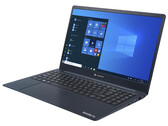
Dynabook Satellite Pro C50-E im Test: Business-Notebook mit gut abgehangener Hardware
Dynabook liefert mit dem Satellite Pro ein 15,6-Zoll-Business-Notebook, welches sich technisch nicht auf der Höhe der Zeit befindet: Im Inneren des Rechners stecken ein Kaby-Lake-Prozessor und eine SATA-SSD. Immerhin fallen die Akkulaufzeiten gut aus.
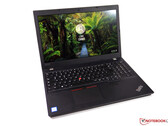
Intel Core i5-8250U, UHD Graphics 620, 15.6", 1.8 kgTest Lenovo ThinkPad L580 Laptop: Zuverlässiger Office-Rechner mit guter Tastatur
Wer einen günstigen Laptop für das Büro sucht, stößt unweigerlich auf Lenovos L-Serie. Wir testen das 15,6 Zoll große L580, das vor allem mit seinen guten Eingabegeräten überzeugen kann.
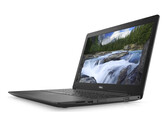
Intel Core i5-8250U, UHD Graphics 620, 15.6", 2 kgDell Latitude 3590 im Test: Office-Laptop mit großen Schwächen
Dell wirft seine neueste Inkarnation der Office-/Business-Serie 3000 auf den Markt und zu den schon bekannten Schwächen gesellen sich neue dazu. Jetzt ist es nicht mehr nur der Bildschirm, den wir eher in einem 400-Euro-Billignotebook verorten würden, sondern es gibt auch auf der technischen Seite Probleme. Was bleibt, sind sehr gute Akkulaufzeiten. UPDATE 08.07.2019: Das neue BIOS 1.9.8 verändert Thermik und Lüfterverhalten zum Positiven.
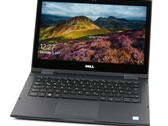
Intel Core i5-8250U, UHD Graphics 620, 15.6", 2.1 kgTest Dell Latitude 3390 (i5-8250U, FullHD, Touch, SSD) Convertible
Das Dell Latitude 3390 bietet als kompaktes Convertible im 13-Zoll-Format eine gute Leistung, um den Office-Alltag zu meistern. Leider zählen die Akkulaufzeiten nicht zu den großen Stärken des 2-in-1-Gerätes aus dem Hause Dell. Welche Vor- und Nachteile das Convertible noch so bereithält, haben wir in diesem Review für Sie herausgearbeitet.
Intel Core i5-8250U, UHD Graphics 620, 13.3", 1.6 kgTest LG Gram 14Z980 (i5-8250U) Laptop
Das Gram 14 ist ein paar hundert Gramm leichter als das XPS 13, bietet aber einen größeren 14-Zoll-Bildschirm. Um genau zu sein, ist es sogar eines der leichtesten Ultrabooks in dieser Größenklasse, das mit einer Intel-Core-U-Serie ausgestattet ist. Wo bleibt hier der Haken?
Intel Core i5-8250U, UHD Graphics 620, 14", 994 gLenovo Yoga Chromebook C630-81JX0008UX: Intel UHD Graphics 620, 15.60", 2 kg
Test » Test Lenovo Yoga Chromebook C630 Convertible
Lenovo V330-14IKB-81B0004MGE: Intel UHD Graphics 620, 14.00", 1.7 kg
Test » Test Lenovo V330-14IKB (i5, FHD) Laptop
Acer Swift 3 SF313-51-59SZ: Intel UHD Graphics 620, 13.30", 1.3 kg
Test » Test Acer Swift 3 SF313 (i5-8250U, 8 GB, SSD, FHD) Laptop
Lenovo V320-17IKB-81CN000MGE: Intel UHD Graphics 620, 17.30", 2.8 kg
Test » Test Lenovo V320-17IKB (i5-8250U, SSD, FHD) Laptop
Lenovo ThinkPad X1 Tablet G3-20KJ001NGE: Intel UHD Graphics 620, 13.00", 1.3 kg
Test » Test Lenovo ThinkPad X1 Tablet 2018 (i5, 3K-IPS) Convertible
HP Pavilion 15-cs0003ng: NVIDIA GeForce MX130, 15.60", 1.9 kg
Test » Test HP Pavilion 15 (i5-8250U, MX130) Laptop
Microsoft Surface Laptop 2-LQN-00004: Intel UHD Graphics 620, 13.50", 1.3 kg
Test » Test Microsoft Surface Laptop 2 (Core i5, 256 GB) Laptop
Toshiba Tecra A50-E-110: Intel UHD Graphics 620, 15.60", 2 kg
Test » Test Toshiba Tecra A50-E-110 (i5-8250U, UHD620) Laptop
Huawei MateBook D 14 W50F: Intel UHD Graphics 620, 14.00", 1.5 kg
Test » Test Huawei MateBook D 14 W50F (i5-8250U) Laptop
Microsoft Surface Pro 6, Core i5, 128 GB: Intel UHD Graphics 620, 12.30", 0.8 kg
Test » Test Microsoft Surface Pro 6 (2018) (i5, 128 GB, 8 GB) Convertible
Honor Magicbook: NVIDIA GeForce MX150, 14.00", 1.4 kg
Test » Test Honor Magicbook (Intel 8250U vs. AMD 2500U) Laptop
Lenovo Yoga C930-13IKB: Intel UHD Graphics 620, 13.90", 1.4 kg
Test » Test Lenovo Yoga C930-13IKB (i5-8250U, FHD) Convertible
Xiaomi Mi Notebook 15.6 (E58514D1D): NVIDIA GeForce MX110, 15.60", 2.2 kg
Test » Test Xiaomi Mi Notebook 15.6 (8250U, MX110) Laptop
Lenovo Yoga 530-14IKB-81EK00CWGE: Intel UHD Graphics 620, 14.00", 1.6 kg
Test » Test Lenovo Yoga 530-14IKB (i5-8250U, 8GB, 256GB-SSD) Convertible
Asus VivoBook Flip 14 TP412UA-DB51T: Intel UHD Graphics 620, 14.00", 1.5 kg
Test » Test Asus VivoBook Flip 14 TP412UA (i5-8250U) Convertible
HP ProBook x360 440 G1: Intel UHD Graphics 620, 14.00", 1.7 kg
Test » Test HP ProBook x360 440 G1 (i5-8250U, 256GB, FHD, Touch) Convertible
Lenovo IdeaPad 330S-15IKB-81F500N5GE: Intel UHD Graphics 620, 15.60", 1.9 kg
Test » Test Lenovo IdeaPad 330S-15IKB (i5-8250U, UHD620) Laptop
HP 15-da0405ng: NVIDIA GeForce MX110, 15.60", 1.8 kg
Test » Test HP 15 (i5-8250U, GeForce MX110, SSD, FHD) Laptop
Lenovo Ideapad 530S-15IKB: Intel UHD Graphics 620, 15.60", 1.7 kg
Test » Test Lenovo Ideapad 530S-15IKB (i5-8250U, Full-HD) Laptop
HP 14-ma0312ng: Intel UHD Graphics 620, 14.00", 1.5 kg
Test » Test HP 14 (i5-8250U, Intel Optane Memory, HD-Display) Laptop
Acer TravelMate P2510-G2-MG-50WE: NVIDIA GeForce MX130, 15.60", 2.1 kg
Test » Test Acer TravelMate P2510 (i5-8250U, MX130) Laptop
HP EliteBook x360 1030 G3: Intel UHD Graphics 620, 13.30", 1.3 kg
Test » Test HP EliteBook x360 1030 G3 (i5-8250U. FHD) Convertible
Lenovo ThinkPad X380 Yoga-20LH000LUS: Intel UHD Graphics 620, 13.30", 1.4 kg
Test » Test Lenovo ThinkPad X380 Yoga (i5-8250U, FHD) Convertible
Toshiba Tecra X40-E-10W: Intel UHD Graphics 620, 14.00", 1.3 kg
Test » Test Toshiba Tecra X40-E (i5-8250U, SSD, LTE, FHD) Laptop
Lenovo ThinkPad T480s-20L7002AUS: Intel UHD Graphics 620, 14.00", 1.4 kg
Test » Test Lenovo ThinkPad T480s (i5-8250U, FHD) Laptop
Fujitsu Lifebook U938: Intel UHD Graphics 620, 13.30", 0.9 kg
Test » Test Fujitsu Lifebook U938 (i5-8250U, LTE, SSD, Full-HD) Subnotebook
Fujitsu LifeBook U728: Intel UHD Graphics 620, 12.50", 1.1 kg
Test » Test Fujitsu LifeBook U728 (i5-8250U, FHD) Laptop
HP ProBook 650 G4 3UP57EA: Intel UHD Graphics 620, 15.60", 2.2 kg
Test » Test HP ProBook 650 G4 (i5-8250U, FHD IPS) Laptop
Acer Swift 5 SF514-52T-59HY: Intel UHD Graphics 620, 14.00", 0.9 kg
Test » Test Acer Swift 5 SF514 (i5-8250U, UHD 620) Laptop
Dell Inspiron 15 5579-9672: Intel UHD Graphics 620, 15.60", 2.1 kg
Test » Test Dell Inspiron 15 5579 (i5-8250U, SSD, IPS, Touch) Convertible
Fujitsu Lifebook T938: Intel UHD Graphics 620, 13.30", 1.3 kg
Test » Test Fujitsu Lifebook T938 (i5-8250U, UHD620) Laptop
Fujitsu Lifebook P728, Core i5-8250U: Intel UHD Graphics 620, 12.50", 1.2 kg
Test » Test Fujitsu Lifebook P728 (i5-8250U, UHD620) Laptop
Huawei Matebook X Pro i5: NVIDIA GeForce MX150, 13.90", 1.3 kg
Test » Test Huawei MateBook X Pro (i5-8250U, MX150) Laptop
Dell Latitude 3490: Intel UHD Graphics 620, 14.00", 1.8 kg
Test » Test Dell Latitude 3490 (Core i5, FHD) Laptop
Asus Zenbook UX3430UN-GV174T: NVIDIA GeForce MX150, 14.00", 1.3 kg
Test » Test Asus Zenbook UX3430UN (i5-8250U, MX150, 256-GB-SSD) Subnotebook
Asus VivoBook 15 X542UF-DM143T: NVIDIA GeForce MX130, 15.60", 2.3 kg
Test » Test Asus VivoBook 15 X542UF (i5-8250U, MX130, SSD, FHD) Laptop
Acer Aspire 5 A515-51G-509A: NVIDIA GeForce MX130, 15.60", 2.2 kg
Test » Test Acer Aspire 5 A515-51G-509A (8250U, MX130, FHD) Laptop
Fujitsu Lifebook E558 E5580MP581DE: Intel UHD Graphics 620, 15.60", 2 kg
Test » Test Fujitsu Lifebook E558 (i5-8250U, SSD, FHD) Laptop
Dell Latitude 5290: Intel UHD Graphics 620, 12.50", 1.4 kg
Test » Test Dell Latitude 5290 (i5-8250U, HD) Laptop
Fujitsu LifeBook U748: Intel UHD Graphics 620, 14.00", 1.6 kg
Test » Test Fujitsu LifeBook U748 (i5-8250U, FHD, Touch) Laptop
HP EliteBook 850 G5 3JX58EA: Intel UHD Graphics 620, 15.60", 1.8 kg
Test » Test HP EliteBook 850 G5 (i5-8250U, FHD) Laptop
Fujitsu Lifebook E548: Intel UHD Graphics 620, 14.00", 1.8 kg
Test » Test Fujitsu Lifebook E548 (i5-8250U, UHD620) Laptop
Acer Spin 3 SP314-51-548L: Intel UHD Graphics 620, 14.00", 1.7 kg
Test » Test Acer Spin 3 SP314-51 (i5-8250U, SSD, FHD) Convertible
Lenovo ThinkPad X1 Yoga 2018-20LD0015US: Intel UHD Graphics 620, 14.00", 1.4 kg
Test » Test Lenovo ThinkPad X1 Yoga 2018 (Core i5-8250U, FHD) Convertible
Lenovo ThinkPad L380-20M5000WGE: Intel UHD Graphics 620, 13.30", 1.4 kg
Test » Test Lenovo ThinkPad L380 (i5-8250U, UHD620) Laptop
HP EliteBook 840 G5-3JX66EA: Intel UHD Graphics 620, 14.00", 1.5 kg
Test » Test HP EliteBook 840 G5 (i5-8250U, SSD, Full-HD) Laptop
Lenovo ThinkPad L380 Yoga-20M7001BGE: Intel UHD Graphics 620, 13.30", 1.5 kg
Test » Test Lenovo ThinkPad L380 Yoga Convertible
HP ProBook 430 G5-3KX72ES: Intel UHD Graphics 620, 13.30", 1.5 kg
Test » Test HP ProBook 430 G5 (i5-8250U, FHD) Laptop
Asus ZenBook Flip 14 UX461UA: Intel UHD Graphics 620, 14.00", 1.4 kg
Test » Test Asus ZenBook Flip 14 UX461UA (i5-8250U, SSD, FHD) Convertible
HP Envy 17-ae143ng: NVIDIA GeForce MX150, 17.30", 3 kg
Test » Test HP Envy 17 (i5-8250U, MX150, SSD, FHD) Laptop
Xiaomi Mi Notebook Air 13.3 2018: NVIDIA GeForce MX150, 13.30", 1.3 kg
Test » Test Xiaomi Mi Notebook Air 13.3 2018 (i5-8250U MX150)
Dell Latitude 5590: Intel UHD Graphics 620, 15.60", 2 kg
Test » Test Dell Latitude 5590 (i5-8250U, IPS-FHD) Laptop
Lenovo ThinkPad L480-20LS001AGE: Intel UHD Graphics 620, 14.00", 1.7 kg
Test » Test Lenovo ThinkPad L480 (i5-8250U, UHD 620, IPS, SSD) Laptop
Lenovo ThinkPad E580-20KSCTO1WW: Intel UHD Graphics 620, 15.60", 1.9 kg
Test » Test Lenovo ThinkPad E580 (i5-8250U, UHD 620, SSD) Laptop
Lenovo ThinkPad E480-20KNCTO1WW: Intel UHD Graphics 620, 14.00", 1.8 kg
Test » Test Lenovo ThinkPad E480 (i5-8250U, UHD 620, SSD) Laptop
Lenovo ThinkPad X280-20KES01S00: Intel UHD Graphics 620, 12.50", 1.1 kg
Test » Test Lenovo ThinkPad X280 (i5-8250U, FHD) Laptop
HP ProBook 440 G5-3KX87ES: Intel UHD Graphics 620, 14.00", 1.6 kg
Test » Test HP ProBook 440 G5 (i5-8250U, FHD) Laptop
HP ProBook 450 G5-2UB53EA: Intel UHD Graphics 620, 15.60", 2.1 kg
Test » Test HP ProBook 450 G5 (FHD, i5-8250U) Laptop
Lenovo ThinkPad T480s-20L8S02D00: Intel UHD Graphics 620, 14.00", 1.4 kg
Test » Test Lenovo ThinkPad T480s (i5, WQHD) Laptop
Dell Inspiron 17-5770-0357: Intel UHD Graphics 620, 17.30", 2.7 kg
Test » Test Dell Inspiron 17-5770-0357 (8250U, SSD, HDD, FHD) Laptop
Lenovo IdeaPad 320-15IKBRN 81BG001KGE: NVIDIA GeForce MX150, 15.60", 2 kg
Test » Test Lenovo IdeaPad 320-15IKBRN (8250U, MX150, FHD) Laptop
Dell Inspiron 13-5379-9573: Intel UHD Graphics 620, 13.30", 1.6 kg
Test » Test Dell Inspiron 13 5379 (i5-8250U, UHD 620) Convertible
Asus VivoBook Flip 15 TP510UA-E8073T: Intel UHD Graphics 620, 15.60", 2.3 kg
Test » Test Asus VivoBook Flip 15 TP510UA (i5-8250U, SSD, FHD) Convertible
Dell XPS 13 9370 i5 UHD: Intel UHD Graphics 620, 13.30", 1.2 kg
Test » Test Dell XPS 13 9370 (i5-8250U, 4K UHD) Laptop
Lenovo Ideapad 720S-13IKB: Intel UHD Graphics 620, 13.30", 1.1 kg
Test » Test Lenovo Ideapad 720S-13IKB (i5-8250U, UHD 620) Laptop
Lenovo ThinkPad E480-20KQS00000: AMD Radeon RX 550 (Laptop), 14.00", 1.8 kg
Test » Test Lenovo ThinkPad E480 (i5-8250U, RX 550) Laptop
Dell XPS 13 9370 FHD i5: Intel UHD Graphics 620, 13.30", 1.2 kg
Test » Test Dell XPS 13 9370 (Core i5, FHD) Laptop
Asus VivoBook S14 S406UA-BV023T: Intel UHD Graphics 620, 14.00", 1.2 kg
Test » Test Asus VivoBook S14 S406UA (i5-8250U, SSD, HD) Laptop
Asus VivoBook 15 X510UQ-BQ534T: NVIDIA GeForce 940MX, 15.60", 1.6 kg
Test » Test Asus VivoBook 15 Laptop (i5-8250U, GeForce 940MX, FHD)
Schenker Slim 14 L17: Intel UHD Graphics 620, 14.00", 1.6 kg
Test » Test Schenker Slim 14 (Clevo N240WU, i5-8250U, UHD 620) Laptop
HP ProBook 470 G5: NVIDIA GeForce 930MX, 17.30", 2.5 kg
Test » Test HP ProBook 470 G5 (i5-8250U, 930MX, SSD, FHD) Laptop
HP Pavilion 15-cc107ng: NVIDIA GeForce 940MX, 15.60", 1.8 kg
Test » Test HP Pavilion 15 (i5-8250U, 940MX, FHD) Laptop
Lenovo Miix 520-12IKB 81CG: Intel UHD Graphics 620, 12.20", 1.2 kg
Test » Test Lenovo Miix 520 (i5-8250U, FHD) Convertible
Lenovo IdeaPad 320S-13IKB: NVIDIA GeForce MX150, 13.30", 1.2 kg
Test » Test Lenovo IdeaPad 320S-13IKBR (i5-8250U, MX150) Laptop
HP 17-bs103ng: AMD Radeon 530, 17.30", 2.6 kg
Test » Test HP 17-bs103ng (i5-8250U, Radeon 530, FHD) Laptop
Acer Spin 5 SP513-52N-54SF: Intel UHD Graphics 620, 13.30", 1.5 kg
Test » Test Acer Spin 5 SP513-52N-54SF (i5-8250U, FHD) Convertible
Dell XPS 13 i5-8250U: Intel UHD Graphics 620, 13.30", 1.3 kg
Test » Test Dell XPS 13 9360R (i5-8250U, QHD) Laptop
Dell Inspiron 13 7370: Intel UHD Graphics 620, 13.30", 1.4 kg
Test » Test Dell Inspiron 13 7370 (i5-8250U) Laptop
HP 15-bs103ng: AMD Radeon 520, 15.60", 2.1 kg
Test » Test HP 15-bs103ng (i5-8250U, Radeon 520, FHD) Laptop
Xiaomi Mi Notebook Pro i5: NVIDIA GeForce MX150, 15.60", 2 kg
Test » Test Xiaomi Mi Notebook Pro i5 Laptop
Acer Swift 3 SF315-51G-57E5: NVIDIA GeForce MX150, 15.60", 1.9 kg
Test » Test Acer Swift 3 SF315 (8250U, MX150, FHD) Laptop
HP Pavilion x360 14-cd0957nd: Intel UHD Graphics 620, 14.00", 1.6 kg
Externer Test » HP Pavilion x360 14-cd0957nd
Durabook R11: Intel UHD Graphics 620, 11.60", 1.2 kg
Externer Test » Durabook R11
Acer Enduro N7 EN714-51W-559L: Intel UHD Graphics 620, 14.00", 2.9 kg
Externer Test » Acer Enduro N7 EN714-51W-559L
Lenovo Yoga 530-14IKB-81EK00TNGE: Intel UHD Graphics 620, 14.00", 1.6 kg
Externer Test » Lenovo Yoga 530-14IKB-81EK00TNGE
Acer ChromeBook 714 CB714-1WT-52QC: Intel UHD Graphics 620, 14.00", 1.6 kg
Externer Test » Acer ChromeBook 714 CB714-1WT-52QC
Acer Spin 3 SP314-51-58JC: Intel UHD Graphics 620, 14.00", 1.7 kg
Externer Test » Acer Spin 3 SP314-51-58JC
HP Chromebook x360 14-da0500nd: Intel UHD Graphics 620, 14.00", 1.7 kg
Externer Test » HP Chromebook x360 14-da0500nd
Fujitsu LifeBook U748: Intel UHD Graphics 620, 14.00", 1.6 kg
Externer Test » Fujitsu LifeBook U748
HP 15-bs182nd: Intel UHD Graphics 620, 15.60", 1.9 kg
Externer Test » HP 15-bs182nd
Lenovo Ideapad 530s-14IKB-81EU00N8SP: Intel UHD Graphics 620, 14.00", 1.6 kg
Externer Test » Lenovo Ideapad 530s-14IKB-81EU00N8SP
HP Chromebook x360 14-da0001nf: Intel UHD Graphics 620, 14.00", 1.7 kg
Externer Test » HP Chromebook x360 14-da0001nf
Acer Chromebook 715 CB715-1WT-5368: Intel UHD Graphics 620, 15.60", 2 kg
Externer Test » Acer Chromebook 715 CB715-1WT-5368
Acer Aspire 5 A515-51-50Y5: Intel UHD Graphics 620, 15.60", 2.2 kg
Externer Test » Acer Aspire 5 A515-51-50Y5
Acer TravelMate X3 TMX3410-MG-59Z5: Intel UHD Graphics 620, 14.00", 1.6 kg
Externer Test » Acer TravelMate X3 TMX3410-MG-59Z5
Acer Aspire 3 A315-53-561Y: Intel UHD Graphics 620, 15.60", 2.1 kg
Externer Test » Acer Aspire 3 A315-53-561Y
Lenovo IdeaPad Flex 6 14-81EM000KUS: Intel UHD Graphics 620, 14.00", 1.7 kg
Externer Test » Lenovo IdeaPad Flex 6 14-81EM000KUS
Lenovo ThinkPad T490-20N3001EGE: Intel UHD Graphics 620, 14.00", 1.5 kg
Externer Test » Lenovo ThinkPad T490-20N3001EGE
Acer Aspire 3 A315-53-58FF: Intel UHD Graphics 620, 15.60", 2.1 kg
Externer Test » Acer Aspire 3 A315-53-58FF
Acer Aspire 3 A315-53-55FW: Intel UHD Graphics 620, 15.60", 2.1 kg
Externer Test » Acer Aspire 3 A315-53-55FW
Acer Aspire 3 A315-53G-5947: NVIDIA GeForce MX130, 15.60", 2.1 kg
Externer Test » Acer Aspire 3 A315-53G-5947
Asus Vivobook R560UD-EJ387: NVIDIA GeForce GTX 1050 Mobile, 15.60", 2 kg
Externer Test » Asus Vivobook R560UD-EJ387
Asus ZenBook UX430UA-GV257: Intel UHD Graphics 620, 14.00", 1.3 kg
Externer Test » Asus ZenBook UX430UA-GV257
Huawei MateBook D 15-53010BAJ : NVIDIA GeForce MX150, 15.60", 1.8 kg
Externer Test » Huawei MateBook D 53010BAJ
Microsoft Surface Laptop 2-LQN-00004: Intel UHD Graphics 620, 13.50", 1.3 kg
Externer Test » Microsoft Surface Laptop 2-LQN-00004
HP Pavilion 15-cs0814no: Intel UHD Graphics 620, 15.60", 1.9 kg
Externer Test » HP Pavilion 15-cs0814no
Acer Aspire 3 A315-53-589C: Intel UHD Graphics 620, 15.60", 2.4 kg
Externer Test » Acer Aspire 3 A315-53-589C
HP 15-da1031tx: NVIDIA GeForce MX110, 15.60", 1.8 kg
Externer Test » HP 15-da1031tx
Lenovo Ideapad 330-15IKBR-81DE02RCSP: Intel UHD Graphics 620, 15.60", 2.2 kg
Externer Test » Lenovo Ideapad 330-15IKBR-81DE02RCSP
Asus VivoBook 15 R564U-EJ122T: Intel UHD Graphics 620, 15.60", 1.7 kg
Externer Test » Asus VivoBook 15 R564U-EJ122T
Dell Latitude 13 3300-DN86T: Intel UHD Graphics 620, 13.30", 1.6 kg
Externer Test » Dell Latitude 13 3300-DN86T
HP 348 G5: Intel UHD Graphics 620, 14.00", 1.5 kg
Externer Test » HP 348 G5
Acer Aspire 3 A315-53-58EJ: Intel UHD Graphics 620, 15.60", 2.1 kg
Externer Test » Acer Aspire 3 A315-53-58EJ
Lenovo IdeaPad 530S-15IKB-81EV003XRU: NVIDIA GeForce MX150, 15.60", 1.7 kg
Externer Test » Lenovo IdeaPad 530S-15IKB-81EV003XRU
Lenovo Ideapad 330-15IKBR-81DE01D5SP: Intel UHD Graphics 620, 15.60", 2.2 kg
Externer Test » Lenovo Ideapad 330-15IKBR-81DE01D5SP
Lenovo Ideapad 530s-14IKB-81EU00LASP: NVIDIA GeForce MX130, 14.00", 1.6 kg
Externer Test » Lenovo Ideapad 530s-14IKB-81EU00LASP
Medion Akoya P6685-30025457: NVIDIA GeForce MX150, 15.60", 2.1 kg
Externer Test » Medion Akoya P6685-30025457
Dell Inspiron 14 N3476: Intel UHD Graphics 620, 14.00", 2 kg
Externer Test » Dell Inspiron 14 N3476
Lenovo Ideapad 530s-14IKBR-81EU00N7SP: Intel UHD Graphics 620, 14.00", 1.6 kg
Externer Test » Lenovo Ideapad 530s-14IKBR-81EU00N7SP
Acer Spin 3 SP314-51-548L: Intel UHD Graphics 620, 14.00", 1.7 kg
Externer Test » Acer Spin 3 SP314-51-548L
Lenovo IdeaPad 530S-15IKB 81EV00DQMH: NVIDIA GeForce MX150, 15.60", 1.7 kg
Externer Test » Lenovo IdeaPad 530S-15IKB 81EV00DQMH
Lenovo IdeaPad 530S-14IKB-81EU00SXMH: Intel UHD Graphics 630, 14.00", 1.6 kg
Externer Test » Lenovo IdeaPad 530S-14IKB-81EU00SXMH
Dell Inspiron 14 5482-cn54805: NVIDIA GeForce MX130, 14.00", 1.7 kg
Externer Test » Dell Inspiron 14 5482-cn54805
Asus VivoBook Flip 14 TP410UA-EC479T: Intel UHD Graphics 620, 14.00", 1.6 kg
Externer Test » Asus VivoBook Flip 14 TP410UA-EC479T
Acer Aspire 3 A315-53G-56SU: NVIDIA GeForce MX130, 15.60", 2.1 kg
Externer Test » Acer Aspire 3 A315-53G-56SU
Acer TravelMate X3 TMX3410-M-54G3: Intel UHD Graphics 620, 14.00", 1.6 kg
Externer Test » Acer TravelMate X3 TMX3410-M-54G3
Toshiba Tecra X40-E-10W: Intel UHD Graphics 620, 14.00", 1.3 kg
Externer Test » Toshiba Tecra X40-E-10W
Honor MagicBook VLT-W50: NVIDIA GeForce MX150, 14.00", 1.5 kg
Externer Test » Honor MagicBook VLT-W50
Huawei MateBook D 14 W50F: Intel UHD Graphics 620, 14.00", 1.5 kg
Externer Test » Huawei MateBook D 14 W50F
Asus VivoBook S13 S330UA-EY637T: Intel UHD Graphics 620, 13.30", 1.2 kg
Externer Test » Asus VivoBook S13 S330UA-EY637T
Asus X540UB-GQ491T: NVIDIA GeForce MX110, 15.60", 1.8 kg
Externer Test » Asus X540UB-GQ491T
HP Spectre 13-af000nw: Intel UHD Graphics 620, 13.30", 1.1 kg
Externer Test » HP Spectre 13-af000nw
HP Pavilion x360 14-CD006NW: Intel UHD Graphics 620, 14.00", 1.6 kg
Externer Test » HP Pavilion x360 14-CD006NW
Huawei Matebook D 15-53010FDQ: Intel UHD Graphics 620, 15.60", 1.9 kg
Externer Test » Huawei Matebook D 15-53010FDQ
Acer Chromebook Spin 13 CP713-1WN-52TK: Intel UHD Graphics 620, 13.50", 1.5 kg
Externer Test » Acer Chromebook Spin 13 CP713-1WN-52TK
Lenovo Ideapad 330-15IKBR-81DE019TPB: Intel UHD Graphics 620, 15.60", 2.2 kg
Externer Test » Lenovo Ideapad 330-15IKBR-81DE019TPB
Medion Akoya S4401-MD61268: Intel UHD Graphics 620, 14.00", 1.8 kg
Externer Test » Medion Akoya S4401-MD61268
Acer Spin 3 SP314-51-532E: Intel UHD Graphics 620, 14.00", 1.7 kg
Externer Test » Acer Spin 3 SP314-51-532E
Asus Vivobook R560UD-EJ362: NVIDIA GeForce GTX 1050 Mobile, 15.60", 2 kg
Externer Test » Asus Vivobook R560UD-EJ362
Acer Aspire 5 A515-51-52L5: Intel UHD Graphics 620, 15.60", 2.2 kg
Externer Test » Acer Aspire 5 A515-51-52L5
Xiaomi Mi Notebook 15.6 (E58514D1D): NVIDIA GeForce MX110, 15.60", 2.2 kg
Externer Test » Xiaomi Mi Notebook 15.6 (E58514D1D)
Lenovo Yoga Chromebook C630 81JX0005MX: Intel UHD Graphics 620, 15.60", 1.9 kg
Externer Test » Lenovo Yoga Chromebook C630 81JX0005MX
Dell Inspiron 15 3576-9HRPY: AMD Radeon 530, 15.60", 2.3 kg
Externer Test » Dell Inspiron 15 3576-9HRPY
Acer Aspire 3 A315-53G-51GB: NVIDIA GeForce MX130, 15.60", 2.1 kg
Externer Test » Acer Aspire 3 A315-53G-51GB
Acer Swift 3 SF315-52G-54DA: NVIDIA GeForce MX150, 15.60", 1.7 kg
Externer Test » Acer Swift 3 SF315-52G-54DA
Microsoft Surface Pro 6, Core i5, 256 GB: Intel UHD Graphics 620, 12.30", 0.8 kg
Externer Test » Microsoft Surface Pro 6, Core i5, 256 GB
HP 17-by1001ng: Intel UHD Graphics 620, 17.30", 2.5 kg
Externer Test » HP 17-by1001ng
Acer Aspire 5 A517-51-508X: NVIDIA GeForce MX150, 17.30", 3 kg
Externer Test » Acer Aspire 5 A517-51-508X
HP Envy 17-bw0001ng: NVIDIA GeForce MX150, 17.30", 2.9 kg
Externer Test » HP Envy 17-bw0001ng
Lenovo Ideapad 720S-13IKBR-81BV0098SP: Intel UHD Graphics 620, 13.30", 1.5 kg
Externer Test » Lenovo Ideapad 720S-13IKBR-81BV0098SP
HP 15-da0039ns: Intel UHD Graphics 620, 15.60", 2.1 kg
Externer Test » HP 15-da0039ns
Lenovo Yoga 530-14IKB-81EK00SNMX: Intel UHD Graphics 620, 14.00", 1.7 kg
Externer Test » Lenovo Yoga 530-14IKB-81EK00SNMX
Acer TravelMate X3 TMX3410-M-50QD: Intel UHD Graphics 620, 14.00", 1.6 kg
Externer Test » Acer TravelMate X3 TMX3410-M-50QD
Acer Chromebook Spin 13 CP713-1WN-5979: Intel UHD Graphics 620, 13.50", 1.6 kg
Externer Test » Acer Chromebook Spin 13 CP713-1WN-5979
HP Pavilion 15-cs0003ng: NVIDIA GeForce MX130, 15.60", 1.9 kg
Externer Test » HP Pavilion 15-cs0003ng
Dell Inspiron 15 7570-0CH38: NVIDIA GeForce 940MX, 15.60", 2 kg
Externer Test » Dell Inspiron 15 7570-0CH38
Lenovo Yoga Chromebook C630-81JX0008UX: Intel UHD Graphics 620, 15.60", 2 kg
Externer Test » Lenovo Yoga Chromebook C630-81JX0008UX
HP 15q-ds1000TU: Intel UHD Graphics 620, 15.60", 2 kg
Externer Test » HP 15q-ds1000TU
Asus F507UF-EJ044T: NVIDIA GeForce MX130, 15.60", 1.7 kg
Externer Test » Asus F507UF-EJ044T
Fujitsu Lifebook E558-E5580MP580DE: Intel UHD Graphics 620, 15.60", 2 kg
Externer Test » Fujitsu Lifebook E558-E5580MP580DE
Lenovo IdeaPad 330S-15IKB-81F500N5GE: Intel UHD Graphics 620, 15.60", 1.9 kg
Externer Test » Lenovo IdeaPad 330S-15IKB-81F500N5GE
Acer TravelMate X3 TMX3410-M-50NL: Intel UHD Graphics 620, 14.00", 1.6 kg
Externer Test » Acer TravelMate X3 TMX3410-M-50NL
Lenovo Ideapad 330-15IKB-81DE014NIN: AMD Radeon 530, 15.60", 2.2 kg
Externer Test » Lenovo Ideapad 330-15IKB-81DE014NIN
Asus Vivobook X407UA-BV489T: Intel UHD Graphics 620, 14.00", 1.5 kg
Externer Test » Asus Vivobook X407UA-BV489T
Acer Chromebook 13 CB713-1W-56VY: Intel UHD Graphics 620, 13.50", 1.6 kg
Externer Test » Acer Chromebook 13 CB713-1W-56VY
Asus VivoBook S14 S430UA-EB065T: Intel UHD Graphics 620, 14.00", 1.4 kg
Externer Test » Asus VivoBook S14 S430UA-EB065T
Lenovo Yoga C930-13IKB-81C4004AMX: Intel UHD Graphics 620, 13.90", 1.4 kg
Externer Test » Lenovo Yoga C930-13IKB-81C4004AMX
Acer Chromebook 13 CB713-1W-50YY: Intel UHD Graphics 620, 13.50", 1.6 kg
Externer Test » Acer Chromebook 13 CB713-1W-50YY
Dell Inspiron 13 5370 CN537008: Intel UHD Graphics 620, 13.30", 1.4 kg
Externer Test » Dell Inspiron 13 5370 CN537008
Lenovo Ideapad 330S-15IKBR-81F500V5SP: Intel UHD Graphics 620, 15.60", 1.9 kg
Externer Test » Lenovo Ideapad 330S-15IKBR-81F500V5SP
Acer Swift 3 SF313-51-59SZ: Intel UHD Graphics 620, 13.30", 1.3 kg
Externer Test » Acer Swift 3 SF313-51-59SZ
Lenovo Ideapad 720-13IKBR-81C3008YSP: Intel UHD Graphics 620, 13.30", 1.3 kg
Externer Test » Lenovo Ideapad 720-13IKBR-81C3008YSP
Asus VivoBook S14 S406UA-BV121T: Intel UHD Graphics 620, 14.00", 1.2 kg
Externer Test » Asus VivoBook S14 S406UA-BV121T
Asus ZenBook UX430UA-GV408T: Intel UHD Graphics 620, 14.00", 1.3 kg
Externer Test » Asus ZenBook UX430UA-GV408T
Lenovo Ideapad 330-15IKBR-81DE0208SP: Intel UHD Graphics 620, 15.60", 2.2 kg
Externer Test » Lenovo Ideapad 330-15IKBR-81DE0208SP
Asus ZenBook 13 UX331UA-EG120T: Intel UHD Graphics 620, 13.30", 1.1 kg
Externer Test » Asus ZenBook 13 UX331UA-EG120T
Dell Vostro 15 3578: AMD Radeon R5 M420, 15.60", 2.1 kg
Externer Test » Dell Vostro 15 3578
Huawei MateBook D 14 W50F-53010CQB: Intel UHD Graphics 620, 14.00", 1.5 kg
Externer Test » Huawei MateBook D W50F 53010CQB
MSI PS42 8RB-060: NVIDIA GeForce MX150, 14.00", 1.2 kg
Externer Test » MSI PS42 8RB-060
Acer Chromebook 13 CB713-1W-57G8: Intel UHD Graphics 620, 13.50", 1.6 kg
Externer Test » Acer Chromebook 13 CB713-1W-57G8
Lenovo Yoga 530-14IKBR-81EK00FYSP: Intel UHD Graphics 620, 14.00", 1.6 kg
Externer Test » Lenovo Yoga 530-14IKBR-81EK00FYSP
Lenovo Yoga 720-13IKBR-81C30090SP: Intel UHD Graphics 620, 13.30", 1.3 kg
Externer Test » Lenovo Yoga 720-13IKBR-81C30090SP
HP Pavilion x360 14-ba138ns: Intel UHD Graphics 620, 14.00", 1.7 kg
Externer Test » HP Pavilion x360 14-ba138ns
HP Pavilion 15-cs0004ns: NVIDIA GeForce MX130, 15.60", 1.9 kg
Externer Test » HP Pavilion 15-cs0004ns
HP Pavilion 15-cs0960nd: NVIDIA GeForce MX150, 15.60", 2 kg
Externer Test » HP Pavilion 15-cs0960nd
Asus ZenBook 14 UX433FN-A6090T: NVIDIA GeForce MX150, 14.00", 1.1 kg
Externer Test » Asus ZenBook 14 UX433FN-A6090T
Acer TravelMate X3410-MG-50LB: NVIDIA GeForce MX130, 14.00", 1.6 kg
Externer Test » Acer TravelMate X3410-MG-50LB
Lenovo Yoga 530-14IKB-81EK00A5MJ: NVIDIA GeForce MX130, 14.00", 1.6 kg
Externer Test » Lenovo Yoga 530-14IKB-81EK00A5MJ
Dell Latitude 5290-F9YR0 2-in-1: Intel UHD Graphics 620, 12.30", 1.3 kg
Externer Test » Dell Latitude 5290-F9YR0 2-in-1
Acer Spin 5 SP513-52NP-583A: Intel UHD Graphics 620, 13.30", 1.5 kg
Externer Test » Acer Spin 5 SP513-52NP-583A
LG Gram 14Z980-G.AA52B: Intel UHD Graphics 620, 14.00", 1 kg
Externer Test » LG Gram 14Z980-G.AA52B
HP ENVY 13-ah0001ns: NVIDIA GeForce MX150, 13.30", 1.3 kg
Externer Test » HP ENVY 13-ah0001ns
HP Pavilion x360 14-cd0010ns: Intel UHD Graphics 620, 14.00", 1.6 kg
Externer Test » HP Pavilion x360 14-cd0010ns
Asus Vivobook 15 X540UB-GQ352T: Intel UHD Graphics 620, 14.00", 1.9 kg
Externer Test » Asus Vivobook 15 X540UB-GQ352T
Huawei MateBook D 15 2018 53010BRU: NVIDIA GeForce MX150, 15.60", 1.9 kg
Externer Test » Huawei MateBook D 2018 53010BRU
Lenovo Yoga C930-13IKB: Intel UHD Graphics 620, 13.90", 1.4 kg
Externer Test » Lenovo Yoga C930-13IKB
Lenovo ThinkPad T480s-20L7002AUS: Intel UHD Graphics 620, 14.00", 1.4 kg
Externer Test » Lenovo ThinkPad T480s-20L7002AUS
Acer Chromebook Spin 13 CP713-1WN-54GA: Intel UHD Graphics 620, 13.50", 1.5 kg
Externer Test » Acer Chromebook Spin 13 CP713-1WN-54GA
Asus Vivobook X507UF-EJ078T: NVIDIA GeForce MX130, 15.60", 1.7 kg
Externer Test » Asus Vivobook X507UF-EJ078T
Asus Vivobook S15 S530UA-BQ290T: Intel UHD Graphics 620, 15.60", 1.8 kg
Externer Test » Asus Vivobook S15 S530UA-BQ290T
Acer Chromebook Spin 13 CP713-1WN-55HT: Intel UHD Graphics 620, 13.50", 1.5 kg
Externer Test » Acer Chromebook Spin 13 CP713-1WN-55HT
Acer Swift 3 SF314-54-524Y: Intel UHD Graphics 620, 14.00", 1.5 kg
Externer Test » Acer Swift 3 SF314-54-524Y
Asus ZenBook 13 UX331UA-AS51: Intel UHD Graphics 620, 13.30", 1.1 kg
Externer Test » Asus ZenBook 13 UX331UA-AS51
Lenovo ThinkPad E480-20KQS00000: AMD Radeon RX 550 (Laptop), 14.00", 1.8 kg
Externer Test » Lenovo ThinkPad E480-20KQS00000
Medion Akoya P6685-MD60989: NVIDIA GeForce MX150, 15.60", 2.1 kg
Externer Test » Medion Akoya P6685-MD60989
Dell Vostro 14 5471-48619955SLV: AMD Radeon 530, 14.00", 1.7 kg
Externer Test » Dell Vostro 14 5471-48619955SLV
Microsoft Surface Pro 6 i5 256GB: Intel UHD Graphics 620, 12.30", 1.1 kg
Externer Test » Microsoft Surface Pro 6 i5 256GB
Lenovo Ideapad 530S-14IKB-81EU00C6SP: Intel UHD Graphics 620, 14.00", 1.5 kg
Externer Test » Lenovo Ideapad 530S-14IKB-81EU00C6SP
HP Pavilion x360 14-CD0007NS: Intel UHD Graphics 620, 14.00", 1.6 kg
Externer Test » HP Pavilion x360 14-CD0007NS
HP 15-da0044ns: Intel UHD Graphics 620, 15.60", 2 kg
Externer Test » HP 15-da0044ns
HP Pavilion 14-ce0820nd: Intel UHD Graphics 620, 14.00", 1.6 kg
Externer Test » HP Pavilion 14-ce0820nd
Lenovo Ideapad 330S-14IKB-81F400PGGE: Intel UHD Graphics 620, 14.00", 1.7 kg
Externer Test » Lenovo Ideapad 330S-14IKB-81F400PGGE
Medion Akoya S6425-MD61072: Intel UHD Graphics 620, 15.60", 2 kg
Externer Test » Medion Akoya S6425-MD61072
Lenovo Yoga 730-13IKB-81CT: Intel UHD Graphics 620, 13.30", 1.2 kg
Externer Test » Lenovo Yoga 730-13IKB-81CT
HP Envy x360 15-cn0101ng: NVIDIA GeForce MX150, 15.60", 2.2 kg
Externer Test » HP Envy x360 15-cn0101ng
MSI PS42 8M-064: Intel UHD Graphics 620, 14.00", 1.2 kg
Externer Test » MSI PS42 8M-064
Lenovo Yoga 530-14IKB-81EK00CWGE: Intel UHD Graphics 620, 14.00", 1.6 kg
Externer Test » Lenovo Yoga 530-14IKB-81EK00CWGE
Microsoft Surface Laptop 2: Intel UHD Graphics 620, 13.50", 1.4 kg
Externer Test » Microsoft Surface Laptop 2
Lenovo Ideapad 520S-14IKBR-81BL007SSP: Intel UHD Graphics 620, 14.00", 1.7 kg
Externer Test » Lenovo Ideapad 520S-14IKBR-81BL007SSP
Lenovo Ideapad 330-15IKBR-81DE013QSP: Intel UHD Graphics 620, 15.60", 2.2 kg
Externer Test » Lenovo Ideapad 330-15IKBR-81DE013QSP
Lenovo Yoga 520-14IKBR-81C8008DSP: Intel UHD Graphics 620, 14.00", 1.8 kg
Externer Test » Lenovo Yoga 520-14IKBR-81C8008DSP
Lenovo Flex 6 14 81EM0008US: NVIDIA GeForce MX130, 14.00", 1.7 kg
Externer Test » Lenovo Flex 6 14 81EM0008US
Lenovo Yoga 720-13IKBR-81C3008VSP: Intel UHD Graphics 620, 13.30", 1.3 kg
Externer Test » Lenovo Yoga 720-13IKBR-81C3008VSP
Medion Akoya S6425-MD61073: Intel UHD Graphics 620, 15.60", 1.9 kg
Externer Test » Medion Akoya S6425-MD61073
HP ProBook 450 G5-2UB53EA: Intel UHD Graphics 620, 15.60", 2.1 kg
Externer Test » HP ProBook 450 G5-2UB53EA
Medion Akoya P6687-MD61005: NVIDIA GeForce MX150, 15.60", 2.3 kg
Externer Test » Medion Akoya P6687-MD61005
HP Pavilion 15-BC400NS: NVIDIA GeForce GTX 1050 Mobile, 15.60", 2.2 kg
Externer Test » HP Pavilion 15-BC400NS
HP Envy 13-AH0002NS: Intel UHD Graphics 620, 13.30", 1.3 kg
Externer Test » HP Envy 13-AH0002NS
Asus Vivobook S14 S406UA-BV041T: Intel UHD Graphics 620, 14.00", 1.2 kg
Externer Test » Asus Vivobook S14 S406UA-BV041T
Lenovo V330-15IKB-81AX00FGGE: Intel UHD Graphics 620, 15.60", 2 kg
Externer Test » Lenovo V330-15IKB-81AX00FGGE
Asus VivoBook S15 S530UA-DB51-YL: Intel UHD Graphics 620, 15.60", 1.8 kg
Externer Test » Asus VivoBook S15 S530UA-DB51-YL
Microsoft Surface Pro 6, Core i5, 128 GB: Intel UHD Graphics 620, 12.30", 0.8 kg
Externer Test » Microsoft Surface Pro 6, Core i5, 128 GB
Asus K560UD-BQ183T: NVIDIA GeForce GTX 1050 Mobile, 15.60", 2 kg
Externer Test » Asus K560UD-BQ183T
Lenovo Ideapad 530s-14IKB-81EU00AGFE: NVIDIA GeForce MX130, 14.00", 1.5 kg
Externer Test » Lenovo Ideapad 530s-14IKB-81EU00AGFE
HP Envy x360 15-cn0004ng: NVIDIA GeForce MX150, 15.60", 2.1 kg
Externer Test » HP Envy x360 15-cn0004ng
Lenovo Yoga Chromebook C630-81JX0002UK: Intel UHD Graphics 620, 15.60", 1.9 kg
Externer Test » Lenovo Yoga Chromebook C630-81JX0002UK
Asus F560UD: NVIDIA GeForce GTX 1050 Mobile, 15.60", 2 kg
Externer Test » Asus F560UD
Dell Inspiron 15 7570, GeForce MX130: NVIDIA GeForce MX130, 15.60", 2 kg
Externer Test » Dell Inspiron 15 7570, GeForce MX130
Lenovo Yoga 730-15IKB-81CU0043GE: NVIDIA GeForce GTX 1050 Mobile, 15.60", 1.9 kg
Externer Test » Lenovo Yoga 730-15IKB-81CU0043GE
Lenovo ThinkPad X1 Carbon G6-20KH0079GE: Intel UHD Graphics 620, 14.00", 1.1 kg
Externer Test » Lenovo ThinkPad X1 Carbon G6-20KH0079GE
HP Envy 13-ah0004ng: Intel UHD Graphics 620, 13.30", 1.3 kg
Externer Test » HP Envy 13-ah0004ng
Acer Swift 5 SF514-52TP-546Q: Intel UHD Graphics 620, 14.00", 1 kg
Externer Test » Acer Swift 5 SF514-52TP-546Q
Dell Vostro 14 5471-PJ1PN: Intel UHD Graphics 620, 14.00", 1.7 kg
Externer Test » Dell Vostro 14 5471-PJ1PN
Lenovo IdeaPad 330-15IKBR 81DE00WJMH: NVIDIA GeForce MX150, 15.60", 2.2 kg
Externer Test » Lenovo IdeaPad 330-15IKBR 81DE00WJMH
Acer Spin 5 SP513-52N-55NV: Intel UHD Graphics 620, 13.30", 1.5 kg
Externer Test » Acer Spin 5 SP513-52N-55NV
Honor Magicbook: NVIDIA GeForce MX150, 14.00", 1.4 kg
Externer Test » Honor Magicbook
Asus VivoBook S15 S530UF-BQ819T: NVIDIA GeForce MX130, 15.60", 1.8 kg
Externer Test » Asus VivoBook S15 S530UF-BQ819T
Lenovo ThinkPad E480-20KN001QGE: Intel UHD Graphics 620, 14.00", 1.8 kg
Externer Test » Lenovo ThinkPad E480-20KN001QGE
HP Pavilion x360 14-cd0087tu: Intel UHD Graphics 620, 14.00", 1.6 kg
Externer Test » HP Pavilion x360 14-cd0087tu
LG Gram 14Z980-G.AA52A1: Intel UHD Graphics 620, 14.00", 1 kg
Externer Test » LG Gram 14Z980-G.AA52A1
HP Pavilion x360 14-cd0008ns: Intel UHD Graphics 620, 14.00", 1.6 kg
Externer Test » HP Pavilion x360 14-cd0008ns
HP Pavilion 14-ce0010ns: NVIDIA GeForce MX130, 14.00", 1.7 kg
Externer Test » HP Pavilion 14-ce0010ns
HP 15-da0045ns: Intel UHD Graphics 620, 15.60", 1.8 kg
Externer Test » HP 15-da0045ns
HP Pavilion 15-cs0053cl: Intel UHD Graphics 620, 15.60", 1.8 kg
Externer Test » HP Pavilion 15-cs0053cl
Asus VivoBook 15 X542UA-GO946T: Intel UHD Graphics 620, 15.60", 2.3 kg
Externer Test » Asus VivoBook 15 X542UA-GO946T
Fujitsu Lifebook S938: Intel UHD Graphics 620, 13.30", 1.3 kg
Externer Test » Fujitsu Lifebook S938
HP Pavilion x360 14-cd0650nd: Intel UHD Graphics 620, 14.00", 1.6 kg
Externer Test » HP Pavilion x360 14-cd0650nd
Lenovo IdeaPad 720-15IKBR 81C7001VPB: Intel UHD Graphics 620, 15.60", 2.1 kg
Externer Test » Lenovo IdeaPad 720-15IKBR 81C7001VPB
HP Pavilion 15-cs0649nd: NVIDIA GeForce MX130, 15.60", 1.9 kg
Externer Test » HP Pavilion 15-cs0649nd
Asus VivoBook Flip TP412UA-EC053T: Intel UHD Graphics 620, 14.00", 1.6 kg
Externer Test » Asus VivoBook Flip TP412UA-EC053T
Acer Swift 3 SF314-54-54LB: Intel UHD Graphics 620, 14.00", 1.8 kg
Externer Test » Acer Swift 3 SF314-54-54LB
Acer Aspire 5 A515-51G-509A: NVIDIA GeForce MX130, 15.60", 2.2 kg
Externer Test » Acer Aspire 5 A515-51G-509A
Acer Aspire 5 A515-51-58HD: Intel UHD Graphics 620, 15.60", 2.2 kg
Externer Test » Acer Aspire 5 A515-51-58HD
Acer Aspire S 24 S24-880: Intel UHD Graphics 620, 23.80", 1.3 kg
Externer Test » Acer Aspire S 24 S24-880
Asus VivoBook S13 S330UN: NVIDIA GeForce MX150, 13.30", 1.2 kg
Externer Test » Asus VivoBook S13 S330UN
Acer Swift 3-SF314-54G: NVIDIA GeForce MX150, 14.00", 1.5 kg
Externer Test » Acer Swift 3-SF314-54G
HP Envy 13-ah0700ng: Intel UHD Graphics 620, 13.30", 1.2 kg
Externer Test » HP Envy 13-ah0700ng
HP ProBook 450 G5-2UB54EA: NVIDIA GeForce 930MX, 15.60", 2.1 kg
Externer Test » HP ProBook 450 G5-2UB54EA
HP 15-da0049ns: Intel UHD Graphics 620, 15.60", 1.8 kg
Externer Test » HP 15-da0049ns
LG Gram 13Z980-G: Intel UHD Graphics 620, 13.30", 1 kg
Externer Test » LG Gram 13Z980-G
HP 15-da0058ns: NVIDIA GeForce MX110, 15.60", 1.8 kg
Externer Test » HP 15-da0058ns
HP Pavilion 14-ce0002ns: NVIDIA GeForce MX130, 14.00", 1.6 kg
Externer Test » HP Pavilion 14-ce0002ns
HP Pavilion x360 14-cd0011ns: NVIDIA GeForce MX130, 14.00", 1.6 kg
Externer Test » HP Pavilion x360 14-cd0011ns
Lenovo Thinkpad X1 Carbon G6 2018-20KH006DSP: Intel UHD Graphics 620, 14.00", 1.1 kg
Externer Test » Lenovo Thinkpad X1 Carbon G6 2018-20KH006DSP
Acer Aspire 5 A517-51-5577: Intel UHD Graphics 620, 17.30", 2.9 kg
Externer Test » Acer Aspire 5 A517-51-5577
Lenovo Ideapad 520-15IKBR-81BF0074SP: NVIDIA GeForce MX150, 15.60", 2.2 kg
Externer Test » Lenovo Ideapad 520-15IKBR-81BF0074SP
HP Envy 13-ah0100nd: Intel UHD Graphics 620, 13.30", 1.3 kg
Externer Test » HP Envy 13-ah0100nd
Lenovo Yoga 530-14IKB-81EK00E1MH: Intel UHD Graphics 620, 15.60", 1.7 kg
Externer Test » Lenovo Yoga 530-14IKB-81EK00E1MH
Asus Zenbook UX430UA-GV265T: Intel UHD Graphics 620, 14.00", 1.3 kg
Externer Test » Asus Zenbook UX430UA-GV265T
Asus VivoBook S K510UN-BQ297T : NVIDIA GeForce MX150, 15.60", 1.7 kg
Externer Test » Asus VivoBook S K510UN-BQ297T
Acer Aspire Nitro 5 AN515-31-561Q: NVIDIA GeForce MX150, 15.60", 2.7 kg
Externer Test » Acer Aspire Nitro 5 AN515-31-561Q
Lenovo ThinkPad T580-20L9001YGE: Intel UHD Graphics 620, 15.60", 2.1 kg
Externer Test » Lenovo ThinkPad T580-20L9001YGE
HP EliteBook x360 1030 G3: Intel UHD Graphics 620, 13.30", 1.3 kg
Externer Test » HP EliteBook x360 1030 G3
Asus VivoBook F510UA-AH51: Intel UHD Graphics 620, 15.60", 1.7 kg
Externer Test » Asus VivoBook F510UA-AH51
HP 17-by0016ng: AMD Radeon 530, 17.30", 2.5 kg
Externer Test » HP 17-by0016ng
Lenovo Ideapad 530S-14IKB-81EU00CJUK: Intel UHD Graphics 620, 14.10", 1.5 kg
Externer Test » Lenovo Ideapad 530S-14IKB-81EU00CJUK
Lenovo ThinkPad X1 Tablet G3-20KJ001NGE: Intel UHD Graphics 620, 13.00", 1.3 kg
Externer Test » Lenovo ThinkPad X1 Tablet G3-20KJ001NGE
Acer Aspire E5-476-50SZ: Intel UHD Graphics 620, 14.00", 1.9 kg
Externer Test » Acer Aspire E5-476-50SZ
Asus VivoBook S14 S406UA-BV023T: Intel UHD Graphics 620, 14.00", 1.2 kg
Externer Test » Asus VivoBook S14 S406UA-BV023T
Acer Spin 5 SP513-52N-54SF: Intel UHD Graphics 620, 13.30", 1.5 kg
Externer Test » Acer Spin 5 SP513-52N-54SF
HP Elitebook 840 G5 3JX27EA: Intel UHD Graphics 620, 14.00", 1.5 kg
Externer Test » HP Elitebook 840 G5 3JX27EA
Lenovo Yoga 720-13IKBR-81C3008YSP: Intel UHD Graphics 620, 13.30", 1.3 kg
Externer Test » Lenovo Yoga 720-13IKBR-81C3008YSP
Lenovo Ideapad 320S-14IKBR-81BN0055SP: Intel UHD Graphics 620, 14.00", 1.7 kg
Externer Test » Lenovo Ideapad 320S-14IKBR-81BN0055SP
HP Pavilion 14-bf105ns: NVIDIA GeForce 940MX, 14.00", 1.6 kg
Externer Test » HP Pavilion 14-bf105ns
Lenovo Ideapad 320-15IKBRN-81BG00MNSP: NVIDIA GeForce MX150, 15.60", 2.2 kg
Externer Test » Lenovo Ideapad 320-15IKBRN-81BG00MNSP
HP Pavilion 14-ce0004ns: NVIDIA GeForce MX130, 14.00", 1.6 kg
Externer Test » HP Pavilion 14-ce0004ns
Dell Inspiron 15 5570 cn57005: Intel UHD Graphics 620, 15.60", 2.2 kg
Externer Test » Dell Inspiron 15 5570 cn57005
Acer Spin 5 SP513-52N-5210: Intel UHD Graphics 620, 13.30", 1.6 kg
Externer Test » Acer Spin 5 SP513-52N-5210
Acer Spin 3-314-51-54WS: Intel UHD Graphics 620, 14.00", 1.7 kg
Externer Test » Acer Spin 3-314-51-54WS
Lenovo Thinkpad L380-20M50013SP: Intel UHD Graphics 620, 13.30", 1.5 kg
Externer Test » Lenovo Thinkpad L380-20M50013SP
Lenovo Thinkpad L380 Yoga-20M7001BS: Intel UHD Graphics 620, 13.30", 1.6 kg
Externer Test » Lenovo Thinkpad L380 Yoga-20M7001BS
Lenovo Yoga 520-14IKBR-81C8008VSP: Intel UHD Graphics 620, 14.00", 1.8 kg
Externer Test » Lenovo Yoga 520-14IKBR-81C8008VSP
HP Zbook 15u G5 2ZC06EA : AMD Radeon Pro WX 3100, 15.60", 1.8 kg
Externer Test » HP Zbook 15u G5 2ZC06EA
Lenovo Thinkpad T480-20L50000SP: Intel UHD Graphics 620, 14.00", 1.7 kg
Externer Test » Lenovo Thinkpad T480-20L50000SP
HP Pavilion 15-bc401ns: NVIDIA GeForce GTX 1050 Mobile, 15.60", 2.2 kg
Externer Test » HP Pavilion 15-bc401ns
HP Elitebook 850 G5-3JX13EA: Intel UHD Graphics 620, 15.60", 1.8 kg
Externer Test » HP Elitebook 850 G5-3JX13EA
Asus VivoBook 15 X542UA-GQ266T: Intel UHD Graphics 620, 15.60", 2.3 kg
Externer Test » Asus VivoBook 15 X542UA-GQ266T
Asus Vivobook 17 A705UQ-BX109T: NVIDIA GeForce 940MX, 17.30", 2.1 kg
Externer Test » Asus Vivobook 17 A705UQ-BX109T
Medion Erazer P6689-MD61020: NVIDIA GeForce GTX 1050 Mobile, 15.60", 2.3 kg
Externer Test » Medion Erazer P6689-MD61020
Lenovo ThinkPad L580-20LW000VMH: Intel UHD Graphics 620, 15.60", 2 kg
Externer Test » Lenovo ThinkPad L580-20LW000VMH
Asus VivoBook S15 S510UN-BQ256T: NVIDIA GeForce MX150, 15.60", 1.7 kg
Externer Test » Asus VivoBook S15 S510UN-BQ256T
Lenovo Ideapad 520S-14IKBR-81BL005YMH: Intel UHD Graphics 620, 14.00", 1.7 kg
Externer Test » Lenovo Ideapad 520S-14IKBR-81BL005YMH
HP EliteBook 850 G5 3JX58EA: Intel UHD Graphics 620, 15.60", 1.8 kg
Externer Test » HP EliteBook 850 G5 3JX58EA
Lenovo ThinkPad L380-20M5000WGE: Intel UHD Graphics 620, 13.30", 1.4 kg
Externer Test » Lenovo ThinkPad L380-20M5000WGE
Lenovo ThinkPad L480-20LS001AGE: Intel UHD Graphics 620, 14.00", 1.7 kg
Externer Test » Lenovo ThinkPad L480-20LS001AGE
HP EliteBook 840 G5-3JX66EA: Intel UHD Graphics 620, 14.00", 1.5 kg
Externer Test » HP EliteBook 840 G5-3JX66EA
Asus VivoBook Flip 15 TP510UA-E8073T: Intel UHD Graphics 620, 15.60", 2.3 kg
Externer Test » Asus VivoBook Flip 15 TP510UA-E8073T
LG Gram 14Z980-U.AAW5U1: Intel UHD Graphics 620, 14.00", 1 kg
Externer Test » LG Gram 14Z980-U.AAW5U1
Fujitsu Lifebook T938: Intel UHD Graphics 620, 13.30", 1.3 kg
Externer Test » Fujitsu Lifebook T938
Lenovo ThinkPad L580-20LW000VGE: Intel UHD Graphics 620, 15.60", 2 kg
Externer Test » Lenovo ThinkPad L580-20LW000VGE
Acer Swift 3 SF315-52-58HG: Intel UHD Graphics 620, 15.60", 1.8 kg
Externer Test » Acer Swift 3 SF315-52-58HG
Lenovo ThinkPad E580-20KS0064MC: Intel UHD Graphics 620, 15.60", 2.1 kg
Externer Test » Lenovo ThinkPad E580-20KS0064MC
Acer Swift 5 SF514-52T-56ZX: Intel UHD Graphics 620, 14.00", 1 kg
Externer Test » Acer Swift 5 SF514-52T-56ZX
Asus Zenbook UX331UAL-EG050T: Intel UHD Graphics 620, 13.30", 1 kg
Externer Test » Asus Zenbook UX331UAL-EG050T
Lenovo V330-15IKB-81AX00CNSP: Intel UHD Graphics 620, 15.60", 2 kg
Externer Test » Lenovo V330-15IKB-81AX00CNSP
Lenovo Yoga 920-13IKB-80Y7008RSP: Intel UHD Graphics 620, 13.90", 1.4 kg
Externer Test » Lenovo Yoga 920-13IKB-80Y7008RSP
Lenovo Thinkpad E580 20KS004FSP: Intel UHD Graphics 620, 15.60", 2.1 kg
Externer Test » Lenovo Thinkpad E580 20KS004FSP
Acer Aspire 5 A515-51G-56UG: NVIDIA GeForce MX130, 15.60", 2.2 kg
Externer Test » Acer Aspire 5 A515-51G-56UG
LG Gram 15Z980-G.AA52: Intel UHD Graphics 620, 15.60", 1.1 kg
Externer Test » LG Gram 15Z980-G.AA52
Dell Inspiron 17-5770-0357: Intel UHD Graphics 620, 17.30", 2.7 kg
Externer Test » Dell Inspiron 17-5770-0357
Lenovo V330-14IKB-81B0004MGE: Intel UHD Graphics 620, 14.00", 1.7 kg
Externer Test » Lenovo V330-14IKB-81B0004MGE
Lenovo Flex 6-14IKB: NVIDIA GeForce MX130, 14.00", 1.7 kg
Externer Test » Lenovo Flex 6-14IKB
LG Gram 13Z980-A: Intel UHD Graphics 620, 13.30", 1 kg
Externer Test » LG Gram 13Z980-A
Dell Latitude 15 3590-6HFKG: Intel UHD Graphics 620, 15.60", 2.1 kg
Externer Test » Dell Latitude 15 3590-6HFKG
HP ProBook 440 G5-3KX87ES: Intel UHD Graphics 620, 14.00", 1.6 kg
Externer Test » HP ProBook 440 G5-3KX87ES
HP Spectre 13-af008tu: Intel UHD Graphics 620, 13.30", 1.1 kg
Externer Test » HP Spectre 13-af008tu
Acer Aspire A615-51G-59EA: NVIDIA GeForce MX150, 15.60", 2.1 kg
Externer Test » Acer Aspire A615-51G-59EA
Lenovo ThinkPad X380 Yoga-20LH000NGE: Intel UHD Graphics 620, 13.30", 1.4 kg
Externer Test » Lenovo ThinkPad X380 Yoga-20LH000NGE
Lenovo Ideapad 520-15IKBR-81BF008MMH: Intel UHD Graphics 620, 15.60", 2.2 kg
Externer Test » Lenovo Ideapad 520-15IKBR-81BF008MMH
Acer Swift 5 SF5-14-52T-580N: Intel UHD Graphics 620, 14.00", 1 kg
Externer Test » Acer Swift 5 SF5-14-52T-580N
Dell Inspiron 13 5370-0583: Intel UHD Graphics 620, 13.30", 1.4 kg
Externer Test » Dell Inspiron 13 5370-0583
Asus Zenbook UX331UA-90NB0GZ2-M02380: Intel UHD Graphics 620, 13.30", 1.1 kg
Externer Test » Asus Zenbook UX331UA-90NB0GZ2-M02380
Acer Chromebook Spin 13 CP713-1W: Intel UHD Graphics 620, 13.50", 1.5 kg
Externer Test » Acer Chromebook Spin 13 CP713-1W
Lenovo IdeaPad 520-15IKB-81BF00CXHV: NVIDIA GeForce MX150, 15.60", 2.2 kg
Externer Test » Lenovo IdeaPad 520-15IKB-81BF00CXHV
Lenovo Thinkpad E580-20KS003GHV: Intel UHD Graphics 620, 15.60", 2.1 kg
Externer Test » Lenovo Thinkpad E580-20KS003GHV
Medion Erazer P7651: NVIDIA GeForce GTX 1050 Mobile, 17.30", 2.7 kg
Externer Test » Medion Erazer P7651
Fujitsu Lifebook U938: Intel UHD Graphics 620, 13.30", 0.9 kg
Externer Test » Fujitsu Lifebook U938
HP ENVY 13-ad107ns: Intel UHD Graphics 620, 13.30", 1.3 kg
Externer Test » HP ENVY 13-ad107ns
Lenovo Ideapad 320-15IKB-81BG00HASP: Intel UHD Graphics 620, 15.60", 2.2 kg
Externer Test » Lenovo Ideapad 320-15IKB-81BG00HASP
Asus ZenBook 3 Deluxe UX490UAR-BE094T: Intel UHD Graphics 620, 14.00", 1.1 kg
Externer Test » Asus ZenBook 3 Deluxe UX490UAR-BE094T
Lenovo ThinkPad E480-20KNCTO1WW: Intel UHD Graphics 620, 14.00", 1.8 kg
Externer Test » Lenovo ThinkPad E480-20KNCTO1WW
Dell Vostro 14 5471: Intel UHD Graphics 620, 14.00", 1.7 kg
Externer Test » Dell Vostro 14 5471
Acer Swift 5 SF514-52T-56JV: Intel UHD Graphics 620, 14.00", 0.9 kg
Externer Test » Acer Swift 5 SF514-52T-56JV
Dell Latitude 3490: Intel UHD Graphics 620, 14.00", 1.8 kg
Externer Test » Dell Latitude 3490
Lenovo ThinkPad L380 Yoga-20M7001BGE: Intel UHD Graphics 620, 13.30", 1.5 kg
Externer Test » Lenovo ThinkPad L380 Yoga-20M7001BGE
Asus ZenBook Flip 14 UX461UA: Intel UHD Graphics 620, 14.00", 1.4 kg
Externer Test » Asus ZenBook Flip 14 UX461UA
Lenovo ThinkPad X1 Yoga 2018-20LD0015US: Intel UHD Graphics 620, 14.00", 1.4 kg
Externer Test » Lenovo ThinkPad X1 Yoga 2018-20LD0015US
Lenovo Ideapad 520S-14IKBR-81BL007MSP: Intel UHD Graphics 620, 14.00", 1.7 kg
Externer Test » Lenovo Ideapad 520S-14IKBR-81BL007MSP
HP Spectre x360 13-ae000ns: Intel UHD Graphics 620, 13.30", 1.3 kg
Externer Test » HP Spectre x360 13-ae000ns
HP Envy 13-ad110ns: Intel UHD Graphics 620, 13.30", 1.2 kg
Externer Test » HP Envy 13-ad110ns
Lenovo Yoga 920-13IKB-80Y80029GE Star Wars: Intel UHD Graphics 620, 13.30", 1.4 kg
Externer Test » Lenovo Yoga 920-13IKB-80Y80029GE Star Wars
Acer Nitro 5 Spin NP515-51-53DZ: NVIDIA GeForce GTX 1050 Mobile, 15.60", 2.2 kg
Externer Test » Acer Nitro 5 Spin NP515-51-53DZ
HP ProBook 430 G5-3KY87EA: Intel UHD Graphics 620, 13.30", 1.5 kg
Externer Test » HP ProBook 430 G5-3KY87EA
Lenovo Yoga 520-14IKB-81C8001DGE: Intel UHD Graphics 620, 14.00", 1.8 kg
Externer Test » Lenovo Yoga 520-14IKB-81C8001DGE
Asus UX410UA-GV354T: Intel UHD Graphics 620, 14.00", 1.4 kg
Externer Test » Asus UX410UA-GV354T
Lenovo V330-15IKB-81AX00AQCK: AMD Radeon 530, 15.60", 2 kg
Externer Test » Lenovo V330-15IKB-81AX00AQCK
Dell Inspiron 15 5570-0302: AMD Radeon 530, 15.60", 2.1 kg
Externer Test » Dell Inspiron 15 5570-0302
Lenovo ThinkPad X280-20KES01S00: Intel UHD Graphics 620, 12.50", 1.1 kg
Externer Test » Lenovo ThinkPad X280-20KES01S00
Asus Zenbook UX430UA-GV259T: Intel UHD Graphics 620, 14.00", 1.3 kg
Externer Test » Asus Zenbook UX430UA-GV259T
Asus Zenbook Flip 14 UX461UN-90NB0GD1-M00980: NVIDIA GeForce MX150, 14.00", 1.5 kg
Externer Test » Asus Zenbook Flip 14 UX461UN-90NB0GD1-M00980
Dell Latitude 7390-XPWYP 2-in-1: Intel UHD Graphics 620, 13.30", 1.4 kg
Externer Test » Dell Latitude 7390-XPWYP 2-in-1
Lenovo Yoga 730-13: Intel UHD Graphics 620, 13.30", 1.2 kg
Externer Test » Lenovo Yoga 730-13
Lenovo Yoga 530-14: Intel UHD Graphics 620, 14.00", 1.6 kg
Externer Test » Lenovo Yoga 530-14
Asus Zenbook Flip S UX370UA-C4331T: Intel UHD Graphics 620, 13.30", 1.1 kg
Externer Test » Asus Zenbook Flip S UX370UA-C4331T
Acer Aspire 5 A517-51-54UG: Intel UHD Graphics 620, 17.30", 2.9 kg
Externer Test » Acer Aspire 5 A517-51-54UG
Samsung Notebook 7 Spin NP730QAA-K01US: Intel UHD Graphics 620, 13.30", 1.5 kg
Externer Test » Samsung Notebook 7 Spin NP730QAA-K01US
Asus VivoBook Flip 14 TP410UR-EC135R: NVIDIA GeForce 930MX, 14.00", 1.6 kg
Externer Test » Asus VivoBook Flip 14 TP410UR-EC135R
Asus ZenBook 13 UX331UN-90NB0GY2-M02590: NVIDIA GeForce MX150, 13.30", 1.1 kg
Externer Test » Asus ZenBook 13 UX331UN-90NB0GY2-M02590
HP 15-bs127NS: Intel UHD Graphics 620, 15.60", 1.9 kg
Externer Test » HP 15-BS127NS
HP 15-bs123ns: AMD Radeon 520, 15.60", 1.9 kg
Externer Test » HP 15-bs123ns
HP Pavilion 15-ck015ns: NVIDIA GeForce 940MX, 15.60", 1.8 kg
Externer Test » HP Pavilion 15-ck015ns
Acer Swift 3 SF314-52G-50B3: NVIDIA GeForce MX150, 14.00", 1.7 kg
Externer Test » Acer Swift 3 SF314-52G-50B3
Acer Aspire 5 A515-51G-558H: NVIDIA GeForce MX130, 15.60", 2.2 kg
Externer Test » Acer Aspire 5 A515-51G-558H
HP Probook 440 G5-2RS30EA: Intel UHD Graphics 620, 14.00", 1.7 kg
Externer Test » HP Probook 440 G5-2RS30EA
HP 17-BS100NS: AMD Radeon 530, 17.30", 2.6 kg
Externer Test » HP 17-BS100NS
Lenovo Ideapad 320-15IKBRN-81BG00EWSP: NVIDIA GeForce MX150, 15.60", 2.2 kg
Externer Test » Lenovo Ideapad 320-15IKBRN-81BG00EWSP
HP ProBook 430 G5-2SY09EA: Intel UHD Graphics 620, 13.30", 1.5 kg
Externer Test » HP ProBook 430 G5-2SY09EA
Medion Akoya P6687-MD60882: NVIDIA GeForce MX150, 15.60", 2.3 kg
Externer Test » Medion Akoya P6687-MD60882
HP 15-bs119ns: Intel UHD Graphics 620, 15.60", 1.9 kg
Externer Test » HP 15-bs119ns
Acer Swift 5 SF514-52T-54QZ: Intel UHD Graphics 620, 14.00", 1 kg
Externer Test » Acer Swift 5 SF514-52T-54QZ
HP Pavilion 15-ck025nd: NVIDIA GeForce MX150, 15.60", 1.8 kg
Externer Test » HP Pavilion 15-ck025nd
Acer Spin 3 SP314-51-53XS: Intel UHD Graphics 620, 14.00", 1.7 kg
Externer Test » Acer Spin 3 SP314-51-53XS
Acer Aspire 5 A515-51G-55SC: NVIDIA GeForce MX130, 15.60", 2.2 kg
Externer Test » Acer Aspire 5 A515-51G-55SC
Lenovo IdeaPad 720S-14IKB 81BD003YMH: NVIDIA GeForce MX150, 14.00", 1.6 kg
Externer Test » Lenovo IdeaPad 720S-14IKB 81BD003YMH
Acer Swift 5 SF514-52T-565H: Intel UHD Graphics 620, 14.00", 1 kg
Externer Test » Acer Swift 5 SF514-52T-565H
Lenovo ThinkPad T480s-20L8S02D00: Intel UHD Graphics 620, 14.00", 1.4 kg
Externer Test » Lenovo ThinkPad T480s-20L8S02D00
HP ProBook 430 G5-3KY85EA: Intel UHD Graphics 620, 13.30", 1.5 kg
Externer Test » HP ProBook 430 G5-3KY85EA
Acer Spin 5 SP513-52N-58WW: Intel UHD Graphics 620, 13.30", 1.5 kg
Externer Test » Acer Spin 5 SP513-52N-58WW
Asus ZenBook 13 UX331UA-EG013T: Intel UHD Graphics 620, 13.30", 1.1 kg
Externer Test » Asus ZenBook 13 UX331UA-EG013T
Dell Inspiron 13-7373: Intel UHD Graphics 620, 13.30", 1.5 kg
Externer Test » Dell Inspiron 13-7373
Dell Inspiron 15-7573: Intel UHD Graphics 620, 15.60", 2.3 kg
Externer Test » Dell Inspiron 15-7573
Lenovo Yoga 720-13IKB-81C3008RGE: Intel UHD Graphics 620, 13.30", 1.3 kg
Externer Test » Lenovo Yoga 720-13IKB-81C3008RGE
Dell XPS 13 9370 FHD i5: Intel UHD Graphics 620, 13.30", 1.2 kg
Externer Test » Dell XPS 13 9370 FHD i5
Acer Swift 5 SF514-52T-51MW: Intel UHD Graphics 620, 14.00", 1 kg
Externer Test » Acer Swift 5 SF514-52T-51MW
Lenovo Yoga 920-13IKB-80Y7003JMX: Intel UHD Graphics 620, 13.90", 1.4 kg
Externer Test » Lenovo Yoga 920-13IKB-80Y7003JMX
Asus ZenBook UX430UN-GV033T: NVIDIA GeForce MX150, 14.00", 1.3 kg
Externer Test » Asus ZenBook UX430UN-GV033T
HP Pavilion 15-ck003nb: Intel UHD Graphics 620, 15.60", 1.9 kg
Externer Test » HP Pavilion 15-ck003nb
HP Spectre 13-ae001nc x360: Intel HD Graphics 620, 13.30", 1.3 kg
Externer Test » HP Spectre 13-ae001nc x360
Asus VivoBook S14 S410UN-EB177T: NVIDIA GeForce MX150, 14.00", 1.4 kg
Externer Test » Asus VivoBook S14 S410UN-EB177T
Dell XPS 13 i5-8250U: Intel UHD Graphics 620, 13.30", 1.3 kg
Externer Test » Dell XPS 13 i5-8250U
Lenovo Yoga 920-13IKB-80Y7002FFR: Intel HD Graphics 620, 13.30", 1.4 kg
Externer Test » Lenovo Yoga 920-13IKB-80Y7002FFR
Dell XPS 13 CNX37001: Intel UHD Graphics 620, 13.30", 1.2 kg
Externer Test » Dell XPS 13 CNX37001
HP Spectre 13-ae001nf x360: Intel UHD Graphics 620, 13.30", 1.3 kg
Externer Test » HP Spectre 13-ae001nf x360
Huawei Matebook X Pro i5: NVIDIA GeForce MX150, 13.90", 1.3 kg
Externer Test » Huawei Matebook X Pro, i5
HP Pavilion 15-ck012ns: Intel HD Graphics 620, 15.60", 1.8 kg
Externer Test » HP Pavilion 15-ck012ns
Lenovo ThinkPad E580-20KSCTO1WW: Intel UHD Graphics 620, 15.60", 1.9 kg
Externer Test » Lenovo ThinkPad E580-20KSCTO1WW
Acer Aspire Nitro 5 AN515-31-59RD: NVIDIA GeForce MX150, 15.60", 2.7 kg
Externer Test » Acer Aspire Nitro 5 AN515-31-59RD
Dell Inspiron 13-5379-9573: Intel UHD Graphics 620, 13.30", 1.6 kg
Externer Test » Dell Inspiron 13-5379-9573
Xiaomi Mi Notebook Air 13.3 2018: NVIDIA GeForce MX150, 13.30", 1.3 kg
Externer Test » Xiaomi Mi Notebook Air 13.3 2018
Acer Aspire E5-476G-5319: NVIDIA GeForce MX150, 14.00", 2.1 kg
Externer Test » Acer Aspire E5-476G-5319
Acer Swift 5 SF514-52T-52ZU: Intel UHD Graphics 620, 14.00", 1 kg
Externer Test » Acer Swift 5 SF514-52T-52ZU
Lenovo Ideapad 320s-14IKB-81BN002XMJ: NVIDIA GeForce 920MX, 14.00", 1.7 kg
Externer Test » Lenovo Ideapad 320s-14IKB-81BN002XMJ
HP Pavilion 14-bf109ns: Intel UHD Graphics 620, 14.00", 1.5 kg
Externer Test » HP Pavilion 14-bf109ns
HP Pavilion 14-ba135ns x360: Intel UHD Graphics 620, 14.00", 1.6 kg
Externer Test » HP Pavilion 14-ba135ns x360
HP Pavilion 14-bf106ns: NVIDIA GeForce 940MX, 14.00", 1.6 kg
Externer Test » HP Pavilion 14-bf106ns
Dell Inspiron 13 7370: Intel UHD Graphics 620, 13.30", 1.4 kg
Externer Test » Dell Inspiron 13 7370
HP Pavilion 15-ck000NS: Intel UHD Graphics 620, 15.60", 1.8 kg
Externer Test » HP Pavilion 15-CK000NS
Acer Aspire 5 A515-51G-59WL: NVIDIA GeForce MX150, 15.60", 2.2 kg
Externer Test » Acer Aspire 5 A515-51G-59WL
Lenovo Yoga 920-13IKB-80Y80032CK Star Wars Special Edition: Galactic Empire: Intel UHD Graphics 620, 13.90", 1.4 kg
Externer Test » Lenovo Yoga 920-13IKB-80Y80032CK Star Wars Special Edition: Galactic Empire
Acer Aspire E15 E5-576G-5762: NVIDIA GeForce MX150, 15.60", 2.4 kg
Externer Test » Acer Aspire E15 E5-576G-5762
Acer Swift 3 SF314-52-517Z: Intel UHD Graphics 620, 14.00", 1.6 kg
Externer Test » Acer Swift 3 SF314-52-517Z
Dell Inspiron 15 5579-9672: Intel UHD Graphics 620, 15.60", 2.1 kg
Externer Test » Dell Inspiron 15 5579-9672
Asus VivoBook S14 S410UN-EB123T: NVIDIA GeForce MX150, 14.00", 1.3 kg
Externer Test » Asus VivoBook S14 S410UN-EB123T
Asus ZenBook UX430UA-GV334T: Intel UHD Graphics 620, 14.00", 1.3 kg
Externer Test » Asus ZenBook UX430UA-GV334T
Lenovo Ideapad 720S-13IKB: Intel UHD Graphics 620, 13.30", 1.1 kg
Externer Test » Lenovo Ideapad 720S-13IKB
Lenovo ThinkPad X1 Carbon G6-20KG0025UK: Intel UHD Graphics 620, 14.00", 1.1 kg
Externer Test » Lenovo ThinkPad X1 Carbon G6
Dell XPS 13 9370 i5 UHD: Intel UHD Graphics 620, 13.30", 1.2 kg
Externer Test » Dell XPS 13 9370 i5 UHD
Dell Inspiron 13 5379-9573: Intel UHD Graphics 620, 13.30", 1.7 kg
Externer Test » Dell Inspiron 13 5379-9573
HP Pavilion 14-ba139ns x360: NVIDIA GeForce 940MX, 14.00", 1.6 kg
Externer Test » HP Pavilion 14-ba139ns x360
HP Envy 13-ad106ns: Intel UHD Graphics 620, 13.30", 1.2 kg
Externer Test » HP Envy 13-ad106ns
Lenovo Miix 520-12IKB 81CG: Intel UHD Graphics 620, 12.20", 1.2 kg
Externer Test » Lenovo Miix 520-12IKB 81CG
Dell Inspiron 17-7773-9955: NVIDIA GeForce MX150, 17.30", 2.9 kg
Externer Test » Dell Inspiron 17-7773-9955
Asus VivoBook Flip 15 TP510UQ-E8033T: NVIDIA GeForce 940MX, 15.60", 1.9 kg
Externer Test » Asus VivoBook Flip 15 TP510UQ-E8033T
HP Spectre 13-AF000no : Intel UHD Graphics 620, 13.30", 1.1 kg
Externer Test » HP Spectre 13-AF000no
Dell Inspiron 13-7370 2-in-1: Intel UHD Graphics 620, 13.30", 1.5 kg
Externer Test » Dell Inspiron 13-7370 2-in-1
Asus ZenBook UX330UA-AH55: Intel UHD Graphics 620, 13.30", 1.2 kg
Externer Test » Asus ZenBook UX330UA-AH55
Acer Swift 3 SF314-52-55UF: Intel UHD Graphics 620, 14.00", 1.6 kg
Externer Test » Acer Swift 3 SF314-52-55UF
Asus VivoBook X510UQ-BR594T: NVIDIA GeForce 940MX, 15.60", 1.7 kg
Externer Test » Asus VivoBook X510UQ-BR594T
HP Envy 13-ad101ns: Intel UHD Graphics 620, 13.30", 1.4 kg
Externer Test » HP Envy 13-ad101ns
HP 17-bs191nd: AMD Radeon 530, 17.30", 2.5 kg
Externer Test » HP 17-bs191nd
HP Envy 13-ad112nd: Intel UHD Graphics 620, 13.30", 1.3 kg
Externer Test » HP Envy 13-ad112nd
Acer Aspire E5-576G-5755: NVIDIA GeForce MX150, 15.60", 2.2 kg
Externer Test » Acer Aspire E5-576G-5755
Acer Spin 5 SP515-51N-54WQ: Intel UHD Graphics 620, 15.60", 2.2 kg
Externer Test » Acer Spin 5 SP515-51N-54WQ
Acer Aspire 5 A517-51G-582X: NVIDIA GeForce MX150, 17.30", 3 kg
Externer Test » Acer Aspire 5 A517-51G-582X
HP Pavilion 14-bf104ns: NVIDIA GeForce 940MX, 14.00", 1.5 kg
Externer Test » HP Pavilion 14-bf104ns
Asus Vivobook S15 S510UA-BR409T: Intel UHD Graphics 620, 15.60", 1.5 kg
Externer Test » Asus Vivobook S15 S510UA-BR409T
HP Envy 13-ad104ns: NVIDIA GeForce MX150, 13.30", 1.3 kg
Externer Test » HP Envy 13-ad104ns
Acer Aspire 5 A515-51G-50AC: NVIDIA GeForce MX150, 15.60", 2.2 kg
Externer Test » Acer Aspire 5 A515-51G-50AC
Acer Spin 5 SP513-52N-50Q7: Intel HD Graphics 620, 13.30", 1.6 kg
Externer Test » Acer Spin 5 SP513-52N-50Q7
HP Pavilion 15-ck001ns: NVIDIA GeForce 940MX, 15.60", 1.8 kg
Externer Test » HP Pavilion 15-ck001ns
Lenovo Ideapad 520s-14IKB-81BL005RMH: Intel UHD Graphics 620, 14.00", 1.7 kg
Externer Test » Lenovo Ideapad 520s-14IKB-81BL005RMH
Lenovo IdeaPad 320s-13IKB 81AK001VRK: Intel UHD Graphics 620, 13.30", 1.2 kg
Externer Test » Lenovo IdeaPad 320s-13IKB 81AK001VRK
Medion Akoya P6689: NVIDIA GeForce GTX 1050 Mobile, 15.60", 2.2 kg
Externer Test » Medion Akoya P6689
Asus ZENBOOK 13 UX331UA 90NB0GZ1-M00880: Intel HD Graphics 620, 13.30", 1.1 kg
Externer Test » Asus ZENBOOK 13 UX331UA 90NB0GZ1-M00880
Acer Aspire 5 A515-51G-500W: NVIDIA GeForce MX150, 15.60", 2.2 kg
Externer Test » Acer Aspire 5 A515-51G-500W
Xiaomi Mi Notebook Pro i5: NVIDIA GeForce MX150, 15.60", 2 kg
Externer Test » Xiaomi Mi Notebook Pro
Acer Spin 5 SP515-51N: Intel UHD Graphics 620, 15.60", 2.2 kg
Externer Test » Acer Spin 5 SP515-51N
Dell Inspiron 13 7370-9665: Intel UHD Graphics 620, 13.30", 1.4 kg
Externer Test » Dell Inspiron 13-7370-9665
Acer Swift 3 SF315-51G-57E5: NVIDIA GeForce MX150, 15.60", 1.9 kg
Externer Test » Acer Swift 3 SF315-51G-57E5
Acer Spin 5 SP513-52N-566U: Intel UHD Graphics 620, 13.30"
Externer Test » Acer Spin 5 SP513-52N-566U
Acer Swift 5 SF514-52T-59HY: Intel UHD Graphics 620, 14.00", 1 kg
Externer Test » Acer Swift 5 SF514-52T-59HY
Acer Swift 3 SF314-52G-5848: NVIDIA GeForce MX150, 14.00", 1.8 kg
Externer Test » Acer Swift 3 SF314-52G-5848
Acer Swift 3 SF314-52-584F : Intel UHD Graphics 620, 14.00", 1.7 kg
Externer Test » Acer Swift 3 SF314-52-584F
Acer Spin 5 SP513-52N-566U: Intel UHD Graphics 620, 13.30"
Artikel » Intel 8. Gen. Kaby Lake-R vs 7. Gen. Kaby Lake Performance-Vergleich
Lenovo Thinkpad L380-20M50013SP: Intel UHD Graphics 620, 13.30", 1.5 kg
» Lenovo-Laptop für 139€: ThinkPad mit 16GB RAM und Windows 11 zum Refurbished-Tiefpreis
Microsoft Surface Pro 6, Core i5, 128 GB: Intel UHD Graphics 620, 12.30", 0.8 kg
» Deal: Microsoft Surface Pro dank Rabattcode für 209 Euro im Refurbished-Angebot
» Lautloses Surface Pro für 209 Euro: Beliebtes Windows-Tablet im Refurbished-Deal sehr günstig
Lenovo ThinkPad X1 Yoga 2018-20LD0015US: Intel UHD Graphics 620, 14.00", 1.4 kg
» Für wenige Tage: Lenovo ThinkPad X1 Yoga G3 Convertible-Laptop mit 16 GB RAM günstig generalüberholt
HP EliteBook 830 G5-3JX69EA: Intel UHD Graphics 620, 13.30", 1.4 kg
» Nur heute: HP EliteBook 830 G6 Business-Laptop mit hellem Display, Core i5 und 16 GB zum Refurbished-Sparpreis
Lenovo ThinkPad X1 Tablet G3-20KJ001NGE: Intel UHD Graphics 620, 13.00", 1.3 kg
» Surface-Pro-Konkurrent: Lenovo 2-in-1 mit Core i7, 16 GB RAM, LTE im Refurbished-Deal für 389 Euro
Lenovo ThinkPad T480s-20L7002AUS: Intel UHD Graphics 620, 14.00", 1.4 kg
» Deal: Lenovo ThinkPad T480s Laptop mit erweiterbarem RAM und Windows 11 Pro für nur 179 Euro refurbished
Lenovo ThinkPad T480s-20L8S02D00: Intel UHD Graphics 620, 14.00", 1.4 kg
» Deal: Lenovo ThinkPad T480s Laptop mit erweiterbarem RAM und Windows 11 Pro für nur 179 Euro refurbished
Lenovo ThinkPad T480s-20L7002AUS: Intel UHD Graphics 620, 14.00", 1.4 kg
» Deal: Lenovo ThinkPad T480s mit 16GB RAM bekommt zusätzliche 23% Refurbished-Rabatt
Lenovo ThinkPad X280-20KES01S00: Intel UHD Graphics 620, 12.50", 1.1 kg
» Kompaktes Lenovo ThinkPad X280 mit 16 GB RAM und Windows 11 Pro für günstige 179 Euro im Refurbished-Deal
Lenovo ThinkPad X380 Yoga-20LH000LUS: Intel UHD Graphics 620, 13.30", 1.4 kg
» Deal: Lenovo ThinkPad X380 Yoga 13-Zoll-Convertible kostet im Refurbished-Deal nur 169 Euro
HP EliteBook 830 G5-3JX69EA: Intel UHD Graphics 620, 13.30", 1.4 kg
» HP EliteBook 830 G5 13-Zoll-Laptop mit erweiterbarem RAM für 149 Euro im Refurbished-Deal
Lenovo ThinkPad X1 Yoga 2018-20LD0015US: Intel UHD Graphics 620, 14.00", 1.4 kg
» Convertible-Deal: Lenovo ThinkPad X1 Yoga Gen 3 mit Core i7 und 16 GB RAM zum günstigen Refurbished-Preis
Fujitsu LifeBook U748: Intel UHD Graphics 620, 14.00", 1.6 kg
» Laptop-Deal: Fujitsu LifeBook U749 mit erweiterbaren 16 GB RAM, 100% sRGB und LTE für 199 Euro generalüberholt
Lenovo ThinkPad L380-20M5000WGE: Intel UHD Graphics 620, 13.30", 1.4 kg
» Notebook-Deal: Lenovo ThinkPad L380 mit Windows 11 Pro generalüberholt für günstige 139 Euro
Fujitsu LifeBook U748: Intel UHD Graphics 620, 14.00", 1.6 kg
» Deal: Fujitsu LifeBook U749 Business-Laptop mit aufrüstbaren 16 GB RAM, LTE und Windows 11 für 199 Euro refurbished
» Laptop-Deal: Fujitsu LifeBook U749 mit erweiterbaren 16 GB RAM, LTE und Windows 11 Pro für 229 Euro refurbished
HP EliteBook 840 G5-3JX66EA: Intel UHD Graphics 620, 14.00", 1.5 kg
» Nur heute: HP EliteBook 840 G6 Business-Notebook mit erweiterbaren 16 GB RAM für 249 Euro im Refurbished-Deal
Lenovo ThinkPad X280-20KES01S00: Intel UHD Graphics 620, 12.50", 1.1 kg
» Deal: Lenovo Thinkpad X280 Business-Laptop mit Windows 11 Pro für nur 143 Euro generalüberholt
Lenovo ThinkPad X380 Yoga-20LH000LUS: Intel UHD Graphics 620, 13.30", 1.4 kg
» Convertible-Deal: Lenovo ThinkPad x380 Yoga inklusive Stylus und Windows 11 Pro für 199 Euro refurbished
» Deal: Lenovo ThinkPad X380 Yoga mit Windows 11 Pro für unschlagbare 169 Euro gebraucht
Lenovo Yoga 730-13IKB-81CT: Intel UHD Graphics 620, 13.30", 1.2 kg
» YouTuber verpflanzt mechanische Tastatur in 13 Zoll Lenovo-Yoga-Laptop, nachdem die Originale zweimal ausfiel
Lenovo ThinkPad L380-20M5000WGE: Intel UHD Graphics 620, 13.30", 1.4 kg
» Deal: Lenovo ThinkPad L380 Laptop mit Windows 11 Pro als Refurbished-Schnäppchen für 139 Euro
Lenovo ThinkPad X380 Yoga-20LH000LUS: Intel UHD Graphics 620, 13.30", 1.4 kg
» Deal: Lenovo ThinkPad X380 Yoga Convertible mit 16GB RAM kostet gebraucht aktuell nur 219 Euro
Lenovo ThinkPad L380-20M5000WGE: Intel UHD Graphics 620, 13.30", 1.4 kg
» Lenovo ThinkPad L380 mit aufrüstbarem RAM, Core i5 und Windows 11 Pro für 149 Euro im Refurbished-Deal
Lenovo ThinkPad X1 Tablet G3-20KJ001NGE: Intel UHD Graphics 620, 13.00", 1.3 kg
» Refurbished-Deal: Lenovo ThinkPad X1 Tablet mit 3K-Touchscreen und Windows 11 Pro für nur 199 Euro
Lenovo ThinkPad L380-20M5000WGE: Intel UHD Graphics 620, 13.30", 1.4 kg
» Deal: Lenovo ThinkPad L380 mit aufrüstbarem RAM und Windows 11 Pro generalüberholt für 139 Euro
HP EliteBook x360 1030 G3: Intel UHD Graphics 620, 13.30", 1.3 kg
» Convertible mit hellem Display für 199 Euro: HP EliteBook x360 1030 generalüberholt deutlich reduziert
Lenovo ThinkPad X380 Yoga-20LH000LUS: Intel UHD Graphics 620, 13.30", 1.4 kg
» Deal: Lenovo ThinkPad X380 Yoga mit Stift und Windows 11 Pro generalüberholt für 199 Euro
Lenovo ThinkPad X1 Tablet G3-20KJ001NGE: Intel UHD Graphics 620, 13.00", 1.3 kg
» Deal: Lenovo ThinkPad X1 Tablet Gen 3 mit 3K-Display, Type-Cover und Windows 11 Pro für nur 199 Euro refurbished
Lenovo ThinkPad X280-20KES01S00: Intel UHD Graphics 620, 12.50", 1.1 kg
» Deal: Lenovo ThinkPad X280 Business-Laptop mit 16 GB RAM für nur 179 Euro generalüberholt
Microsoft Surface Pro 6, Core i5, 128 GB: Intel UHD Graphics 620, 12.30", 0.8 kg
» Deal: Lüfterloses Microsoft Surface Pro 6 mit Intel Core i5 für nur 249 Euro refurbished dank Gutscheincode
Fujitsu LifeBook U748: Intel UHD Graphics 620, 14.00", 1.6 kg
» Deal: Fujitsu LifeBook U748 Business-Laptop mit erweiterbaren 16 GB RAM, LTE und gutem Touchdisplay für günstige 219 Euro generalüberholt
HP EliteBook 840 G5-3JX66EA: Intel UHD Graphics 620, 14.00", 1.5 kg
» Deal: HP EliteBook 840 G5 Business-Notebook mit erweiterbaren 16 GB RAM für 239 Euro refurbished
Lenovo ThinkPad X380 Yoga-20LH000LUS: Intel UHD Graphics 620, 13.30", 1.4 kg
» Deal: Lenovo ThinkPad X380 Yoga Convertible-Laptop inklusive Stylus für nur 249 Euro generalüberholt
HP EliteBook 850 G5 3JX58EA: Intel UHD Graphics 620, 15.60", 1.8 kg
» Deal: HP EliteBook 850 G5 Business-Laptop mit aufrüstbarem RAM und LTE für 238 Euro refurbished
Fujitsu Lifebook E548: Intel UHD Graphics 620, 14.00", 1.8 kg
» Deal: Fujitsu LifeBook E449 Business-Laptop mit erweiterbarem RAM für sehr günstige 139 Euro refurbished
Microsoft Surface Pro 6, Core i5, 128 GB: Intel UHD Graphics 620, 12.30", 0.8 kg
» Deal: Lüfterloses Microsoft Surface Pro 6 mit Intel Core i5 und Type Cover für unter 280 Euro refurbished dank Gutscheincode
Fujitsu LifeBook U748: Intel UHD Graphics 620, 14.00", 1.6 kg
» Fujitsu LifeBook U748 Business-Laptop mit zwei RAM-Slots und LTE für nur 189 Euro im Refurbished-Deal
HP EliteBook 840 G5-3JX66EA: Intel UHD Graphics 620, 14.00", 1.5 kg
» HP EliteBook 840 G5: Business-Notebook mit Core i5 und 16GB RAM ab 199 Euro im Refurbished-Deal
Fujitsu Lifebook T938: Intel UHD Graphics 620, 13.30", 1.3 kg
» Wie ThinkPad Yoga: Fujitsu LifeBook T938 Convertible-Laptop mit aufrüstbarem RAM für sehr günstige 149 Euro inklusive Stylus im Refurbished-Deal
Lenovo ThinkPad X380 Yoga-20LH000LUS: Intel UHD Graphics 620, 13.30", 1.4 kg
» Refurbished-Deal: Lenovo ThinkPad X380 Yoga Convertible-Laptop inklusive Stylus für unschlagbar günstige 208 Euro
Fujitsu Lifebook T938: Intel UHD Graphics 620, 13.30", 1.3 kg
» Deal: Fujitsu Lifebook T939 Convertible-Laptop mit 16 GB aufrüstbaren RAM und Wechselakku refurbished für 269 Euro
Lenovo Miix 520-12IKB 81CG: Intel UHD Graphics 620, 12.20", 1.2 kg
» Deal: Surface Pro Alternative mit 16 GB RAM für sehr günstige 299 Euro – Lenovo Miix 520 inklusive Tastatur und Stift
Lenovo ThinkPad L580-20LW000VGE: Intel UHD Graphics 620, 15.60", 2 kg
» Lenovos ThinkPad L580 ist ein guter Office-Rechner