NVIDIA GeForce GTX 1650 Max-Q vs NVIDIA GeForce RTX 2080 Super Max-Q
NVIDIA GeForce GTX 1650 Max-Q ► remove from comparison
Die Nvidia GeForce GTX 1650 mit Max-Q Design ist eine mobile Grafikkarte für Laptops basierend auf der Turing Architektur. Sie ist gedacht für dünne und leichte Notebook und je nach Kühlungsdesign etwa 10-15% langsamer als eine normale GTX 1650 für Laptops . Sie basiert wie die Desktop-Version auf den TU117 Chip, nutzt jedoch alle 1024 Shader und wurde Ende April 2019 vorgestellt. Die GTX 1650 Serie bietet im Unterschied zu den stärkeren RTX 2000er Karten (z.B. RTX 2060 ) keine Raytracing und Tensor Kerne. Die Leistung sollte etwas oberhalb einer mobilen GTX 1050 Ti Max-Q sein, jedoch bei deutlich geringerem Stromverbrauch.
Mit dem Refresh im März 2020 ist auch eine GDDR6 Variante (N18P-G61, max. 4 GB) erhältlich.
Bei der Turing Architektur gab es auch auf der Ebene der CUDA-Kerne deutliche Verbesserungen. Float und INT Operationen können nun gleichzeitig ausgeführt werden, der Cache wurde vereinheitlicht und verbessert und Adaptive Shading eingeführt. Nvidia spricht dadurch von einer bis zu 50% höheren Leistung pro Kern im Vergleich zu Pascal.
Im Gegensatz zu den größeren Turing Chips (wie den TU116 der GTX 1660 Ti) bietet der TU117 nur die älteren NVENC Videoenkodierung der Pascal / Volta Generation.
Nvidia spezifiziert einen Stromverbrauch von 35 Watt TGP (Total Graphics Power) für die Grafikkarte und damit 15 Watt weniger als die normale (Max-P) Variante der GTX1650 . Der TU117 Chip wird bei TSMC im 12nm FFN Verfahren gefertigt.
NVIDIA GeForce RTX 2080 Super Max-Q ► remove from comparison
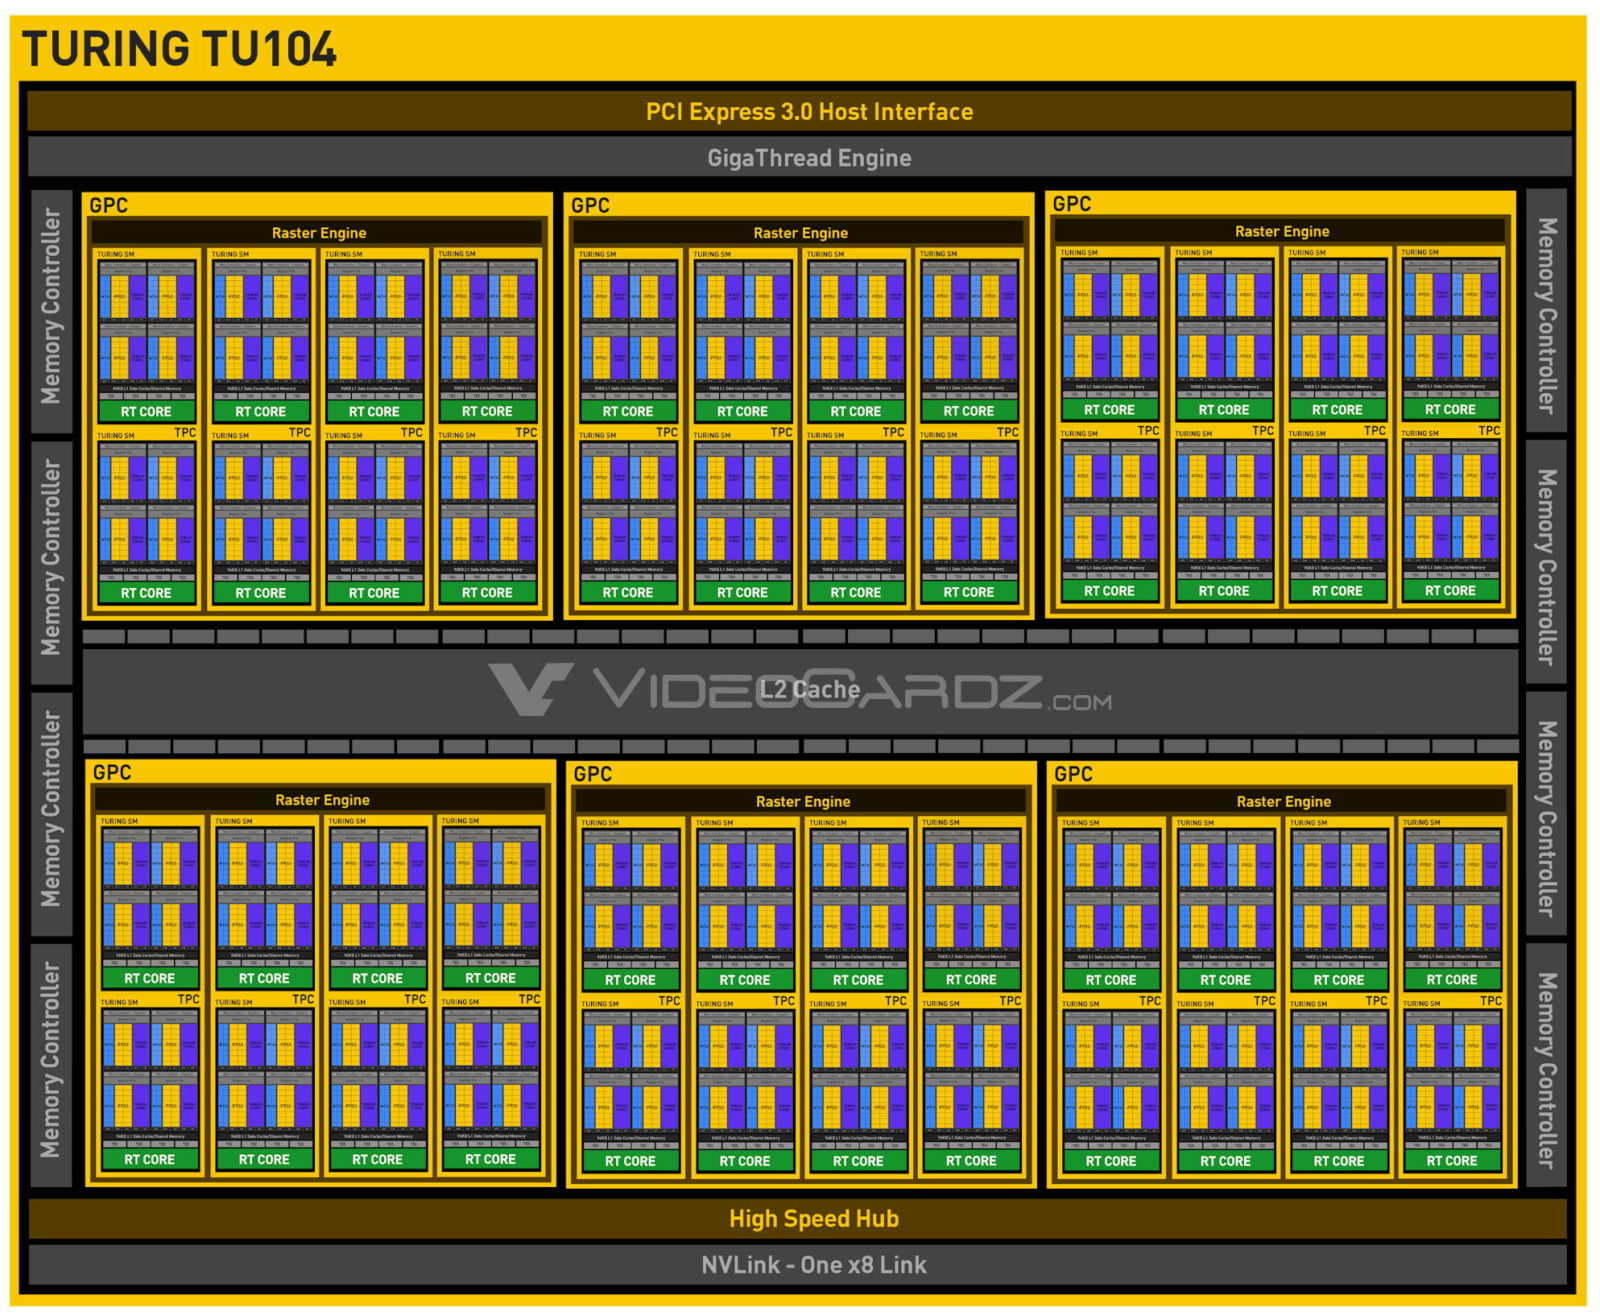
Die Nvidia GeForce RTX 2080 Super Max-Q (für Laptops) ist die Stromsparversion der mobilen GeForce RTX 2080 Super . Sie basiert auf den selben TU104-775-A1 Chip mit 3.072 Shader, jedoch bei deutlich reduzierten Taktraten und Stromverbrauch. Es gibt drei Varianten mit einem TGP (Stromverbrauch des Chips) von 80, 85 und 90 Watt. Die Taktung rangiert von 735 - 975 MHz für den Basistakt und 1.080 - 1.230 MHz im Boost. Die normale 2080 Super Mobile taktet mit 1.365 - 1.560 / 1.560 - 1.740 MHz bis zu 48% höher im Boost, die gleichnamige Desktop-Version ist nochmals schneller getaktet. Die GPU trägt den Codenamen N18E-G3R-A1 (für Refresh).
Mit dem Refresh wurden die Max-Q Technologien überarbeitet und bieten nun neben einer verbesserten Effizienz durch (neue Spannungswandler, Low-Power-GDDR6) auch zwei optionale Features. Der Notebookhersteller kann Dynamic Boost implementieren um Strom von der CPU zur GPU zu verlagern (TDP in 5 Watt Schritten). Weiters gibt es einen neuen "Dynamic Display Switch" für Advanced Optimus der G-SYNC und bis zu 4K 120 Hz ermöglichen.
Features
Der TU104-Chip wird in 12nm gefertigt und bietet eine Reihe neuer Features, wie DLSS (Deep Learning Super Sampling) und Real Time Ray Tracing. Dadurch lassen sich vor allem Beleuchtungseffekte sehr viel realistischer darstellen. Weiterhin gibt es Support für DisplayPort 1.4 (ready), HDMI 2.0b, HDR, Simultaneous Multi-Projection (SMP) sowie H.265 Video De- und Encoding (PlayReady 3.0).
Performance
Die Performance der mobilen GeForce RTX 2080 Super Max-Q ist stark abhängig vom verbauten Notebook und kann sich in unseren ersten Tests nur minimal von der alten RTX 2080 Max-Q absetzen. Damit erreicht sie meist nur die Performance einer normalen RTX 2070 für Notebooks . Damit eignet sich die Grafikkarte am besten für 1440p bei maximalen Details in anspruchsvollen Spielen wie Red Dead Redemption 2, Control oder Borderlands 3. Weniger anspruchsvolle Spiele wie F1 2019 können auch in 4k mit maximalen Details flüssig gespielt werden. Detaillierte Spielebenchmarks finden Sie am Ende dieser Seite.
Durch den verringerten Stromverbrauch von 80 - 90 Watt TGP eignet sich die RTX 2080 Super Max-Q auch für dünnere Gaming-Notebooks.
NVIDIA GeForce GTX 1650 Max-Q NVIDIA GeForce RTX 2080 Super Max-Q GeForce RTX 2000 Serie Codename N18P-G0 / N18P-G61 N18E-G3 Architektur Turing Turing Pipelines 1024 - unified 3072 - unified TMUs 64 ROPs 32 Kerntakt 1020 - 1245 (Boost) MHz 975 - 1230 (Boost) MHz Speichertakt 8000 effective = 1750 MHz 11000 MHz Speicherbandbreite 128 Bit 256 Bit Speichertyp GDDR5, GDDR6 GDDR6 Max. Speichergröße 4 GB 8 GB Shared Memory nein nein Memory Bandwidth 112.1 GB/s API DirectX 12_1, OpenGL 4.6 DirectX 12_1, OpenGL 4.6 Stromverbrauch 35 Watt 90 Watt Herstellungsprozess 12 nm 12 nm PCIe 3.0 Notebookgröße mittel (15.4" z.B.) groß (17" z.B.) Erscheinungsdatum 23.04.2019 02.04.2020 Herstellerseite www.nvidia.com Transistors 13.6 Billion Features NVLink, DLSS, Raytraycing, VR Ready, G-SYNC, Vulkan, Multi Monitor, 650 Watt system power recommended
Benchmarks Performance Rating - 3DMark 11 + Fire Strike + Time Spy - GeForce GTX 1650 Max-Q
3.5 pt (11%)
...
NVIDIA GeForce GTX 1650 Max-Q
...
max:
3DMark - 3DMark Time Spy Score
min: 2859 avg: 3130 median: 3070 (9%) max: 3494 Points
min: 7475 avg: 8204 median: 8075 (23%) max: 9051 Points
GPU TDP ? TDP 91 W 69% 100%
3DMark - 3DMark Time Spy Graphics
min: 2836 avg: 2998 median: 3016 (8%) max: 3238 Points
min: 7372 avg: 8210 median: 8331 (22%) max: 8979 Points
GPU TDP ? TDP 91 W 66% 100%
3DMark - 3DMark Ice Storm Unlimited Graphics
min: 370469 avg: 377330 median: 373879 (42%) max: 391093 Points
GPU TDP ? TDP 40 W 95% 100%
min: 443119 avg: 465029 median: 468363 (53%) max: 483604 Points
GPU TDP ? TDP 40 W 100% 93%
3DMark - 3DMark Ice Storm Extreme Graphics
min: 40461 avg: 62256 median: 59656 (8%) max: 86650 Points
GPU TDP ? TDP 40 W 100% 55%
3DMark - 3DMark Cloud Gate Score
min: 14259 avg: 20728 median: 20883 (22%) max: 29013 Points
GPU TDP ? TDP 40 W 87% 100%
min: 32880 avg: 42751 median: 44534 (48%) max: 53680 Points
GPU TDP ? TDP 40 W 100% 81%
3DMark - 3DMark Cloud Gate Graphics
min: 21759 avg: 39625 median: 45243.5 (12%) max: 53981 Points
GPU TDP ? TDP 40 W 100% 77%
min: 101976 avg: 126108 median: 127741 (34%) max: 140750 Points
GPU TDP ? TDP 40 W 100% 42%
3DMark - 3DMark Fire Strike Standard Score
min: 6300 avg: 7026 median: 7004.5 (12%) max: 7784 Points
GPU TDP ? TDP 40 W 89% 100%
min: 17053 avg: 18565 median: 18578.5 (33%) max: 20173 Points
GPU TDP ? TDP 40 W TDP 91 W 63% 40% 100%
3DMark - 3DMark Fire Strike Standard Graphics
min: 6985 avg: 7853 median: 7779 (9%) max: 8618 Points
GPU TDP ? TDP 40 W 93% 100%
min: 19655 avg: 21743 median: 21902.5 (25%) max: 23649 Points
GPU TDP ? TDP 40 W TDP 91 W 62% 37% 100%
3DMark - 3DMark Ice Storm Graphics
min: 40513 avg: 68009 median: 64975.5 (8%) max: 101571 Points
GPU TDP ? TDP 40 W 100% 53%
3DMark 11 - 3DM11 Performance Score
min: 9381 avg: 10635 median: 10471 (15%) max: 11966 Points
GPU TDP ? TDP 40 W 97% 100%
min: 20888 avg: 23821 median: 24119 (33%) max: 26066 Points
GPU TDP ? TDP 40 W TDP 91 W 62% 42% 100%
3DMark 11 - 3DM11 Performance GPU
min: 10248 avg: 11171 median: 11082.5 (10%) max: 12259 Points
GPU TDP ? TDP 40 W 100% 97%
min: 26292 avg: 29663 median: 29636.5 (25%) max: 32995 Points
GPU TDP ? TDP 40 W TDP 91 W 60% 35% 100%
3DMark Vantage + NVIDIA GeForce GTX 1650 Max-Q 3DMark Vantage - 3DM Vant. Perf. total
30957 Points (9%)
3DM Vant. Perf. total + NVIDIA GeForce RTX 2080 Super Max-Q
60306 Points (17%)
3DM Vant. Perf. GPU no PhysX + NVIDIA GeForce GTX 1650 Max-Q 3DMark Vantage - 3DM Vant. Perf. GPU no PhysX
33321 Points (19%)
3DM Vant. Perf. GPU no PhysX + NVIDIA GeForce RTX 2080 Super Max-Q
69467 Points (39%)
3DMark 06 3DMark 06 - Standard 1280x1024 + NVIDIA GeForce GTX 1650 Max-Q
min: 31487 avg: 32041 median: 32040.5 (42%) max: 32594 Points
3DMark 06 - Standard 1280x1024 + NVIDIA GeForce RTX 2080 Super Max-Q
38265 Points (50%)
SPECviewperf 13 specvp13 sw-04 + NVIDIA GeForce GTX 1650 Max-Q SPECviewperf 13 - specvp13 sw-04
53 fps (14%)
specvp13 sw-04 + NVIDIA GeForce RTX 2080 Super Max-Q
min: 88.7 avg: 88.8 median: 88.8 (24%) max: 88.9 fps
specvp13 snx-03 + NVIDIA GeForce GTX 1650 Max-Q SPECviewperf 13 - specvp13 snx-03
10.7 fps (1%)
specvp13 snx-03 + NVIDIA GeForce RTX 2080 Super Max-Q
min: 20.88 avg: 21.1 median: 21.1 (2%) max: 21.33 fps
specvp13 showcase-02 + NVIDIA GeForce GTX 1650 Max-Q SPECviewperf 13 - specvp13 showcase-02
33.7 fps (7%)
specvp13 showcase-02 + NVIDIA GeForce RTX 2080 Super Max-Q
96.2 fps (21%)
specvp13 medical-02 + NVIDIA GeForce GTX 1650 Max-Q SPECviewperf 13 - specvp13 medical-02
22.8 fps (5%)
specvp13 medical-02 + NVIDIA GeForce RTX 2080 Super Max-Q
min: 53.1 avg: 55.5 median: 55.5 (12%) max: 57.9 fps
specvp13 maya-05 + NVIDIA GeForce GTX 1650 Max-Q SPECviewperf 13 - specvp13 maya-05
88.2 fps (10%)
specvp13 maya-05 + NVIDIA GeForce RTX 2080 Super Max-Q
min: 210.2 avg: 212.8 median: 212.8 (24%) max: 215.4 fps
specvp13 creo-02 + NVIDIA GeForce GTX 1650 Max-Q SPECviewperf 13 - specvp13 creo-02
68.9 fps (10%)
specvp13 creo-02 + NVIDIA GeForce RTX 2080 Super Max-Q
min: 170 avg: 173.6 median: 173.6 (25%) max: 177.2 fps
specvp13 catia-05 + NVIDIA GeForce GTX 1650 Max-Q SPECviewperf 13 - specvp13 catia-05
53.9 fps (6%)
specvp13 catia-05 + NVIDIA GeForce RTX 2080 Super Max-Q
min: 132.3 avg: 136.4 median: 136.4 (15%) max: 140.4 fps
specvp13 3dsmax-06 + NVIDIA GeForce GTX 1650 Max-Q SPECviewperf 13 - specvp13 3dsmax-06
71.3 fps (12%)
specvp13 3dsmax-06 + NVIDIA GeForce RTX 2080 Super Max-Q
min: 175.5 avg: 176.1 median: 176.1 (31%) max: 176.6 fps
specvp13 energy-02 + NVIDIA GeForce RTX 2080 Super Max-Q SPECviewperf 13 - specvp13 energy-02
min: 17.49 avg: 17.7 median: 17.7 (6%) max: 17.92 fps
Cinebench R10 Cinebench R10 Shading (32bit) + NVIDIA GeForce GTX 1650 Max-Q Cinebench R10 - Cinebench R10 Shading (32bit)
min: 5121 avg: 5968 median: 5967.5 (4%) max: 6814 Points
Cinebench R10 Shading (32bit) + NVIDIA GeForce RTX 2080 Super Max-Q
13620 Points (10%)
Cinebench R11.5 Cinebench R11.5 OpenGL 64 Bit + NVIDIA GeForce GTX 1650 Max-Q Cinebench R11.5 - Cinebench R11.5 OpenGL 64 Bit
76.1 fps (26%)
Cinebench R11.5 OpenGL 64 Bit + NVIDIA GeForce RTX 2080 Super Max-Q
82.1 fps (28%)
Cinebench R15 + NVIDIA GeForce GTX 1650 Max-Q Cinebench R15 - Cinebench R15 OpenGL 64 Bit
min: 85.3 avg: 110 median: 108.1 (6%) max: 143.6 fps
GPU TDP ? TDP 40 W 74% 100%
Cinebench R15 OpenGL 64 Bit + NVIDIA GeForce RTX 2080 Super Max-Q
min: 114 avg: 140.1 median: 142 (8%) max: 152.1 fps
GPU TDP ? TDP 40 W TDP 91 W 84% 100% 95%
Cinebench R15 OpenGL Ref. Match 64 Bit + NVIDIA GeForce GTX 1650 Max-Q Cinebench R15 - Cinebench R15 OpenGL Ref. Match 64 Bit
99.6 % (100%)
GPU TDP ? TDP 40 W 100% 100%
Cinebench R15 OpenGL Ref. Match 64 Bit + NVIDIA GeForce RTX 2080 Super Max-Q
99.6 % (100%)
GPU TDP ? TDP 40 W TDP 91 W 100% 100% 100%
GFXBench - GFXBench Car Chase Offscreen
154.2 fps (17%)
368.4 fps (41%)
LuxMark v2.0 64Bit - LuxMark v2.0 Room GPU
1589 Samples/s (7%)
LuxMark v2.0 64Bit - LuxMark v2.0 Sala GPU
3068 Samples/s (5%)
ComputeMark v2.1 - ComputeMark v2.1 Result
5833 Points (6%)
16221 Points (18%)
Power Consumption - Furmark Stress Test Power Consumption - external Monitor *
161 Watt (23%)
Power Consumption - The Witcher 3 Power Consumption - external Monitor *
149 Watt (21%)
Power Consumption - Witcher 3 Power Consumption *
min: 60 avg: 71.7 median: 73 (16%) max: 90.1 Watt
min: 140 avg: 150.1 median: 146.1 (32%) max: 170 Watt
GPU TDP ? TDP 91 W 118% 100%
Power Consumption - Witcher 3 ultra Power Efficiency
min: 0.3818 avg: 0.4 median: 0.4 (43%) max: 0.485 fps per Watt
min: 0.4418 avg: 0.6 median: 0.6 (56%) max: 0.635 fps per Watt
GPU TDP ? TDP 91 W 87% 100%
Power Consumption - Witcher 3 ultra Power Efficiency - external Monitor
0.6 fps per Watt (49%)
Emissions Witcher 3 Fan Noise + NVIDIA GeForce GTX 1650 Max-Q Emissions - Witcher 3 Fan Noise
min: 25.2 avg: 38.8 median: 39.8 (64%) max: 44.7 dB(A)
GPU TDP ? TDP 40 W 90% 100%
Witcher 3 Fan Noise + NVIDIA GeForce RTX 2080 Super Max-Q
min: 41 avg: 48.1 median: 48 (77%) max: 54 dB(A)
GPU TDP ? TDP 40 W TDP 91 W 78% 79% 100%
Clock Speed - GPU Clock Witcher 3 ultra
min: 1350 avg: 1378 median: 1389 (54%) max: 1395 MHz
min: 1215 avg: 1371 median: 1387.5 (54%) max: 1506 MHz
GPU TDP ? TDP 91 W 90% 100%
Clock Speed - GPU Clock Speed Furmark
819 MHz (32%)
Average Benchmarks NVIDIA GeForce GTX 1650 Max-Q → 100% n=27 Average Benchmarks NVIDIA GeForce RTX 2080 Super Max-Q → 215% n=27
- Bereich der Benchmarkergebnisse für diese Grafikkarte
- Durchschnittliche Benchmarkergebnisse für diese Grafikkarte
* Smaller numbers mean a higher performance
1 This benchmark is not used for the average calculation
Spiele-Benchmarks Die folgenden Benchmarks basieren auf unseren Spieletests mit Testnotebooks. Die Performance dieser Grafikkarte bei den gelisteten Spielen ist abhängig von der verwendeten CPU, Speicherausstattung, Treiber und auch Betriebssystem. Dadurch müssen die untenstehenden Werte nicht repräsentativ sein. Detaillierte Informationen über das verwendete System sehen Sie nach einem Klick auf den fps-Wert.
GeForce RTX 2080 Super Max-Q:
148 fps
GeForce RTX 2080 Super Max-Q:
109 fps
GeForce RTX 2080 Super Max-Q:
90 fps
GeForce RTX 2080 Super Max-Q:
74 76 [X] SCHENKER Key 15 Comet Lake Leistungsmodus
Intel Core i7-10875H 2.3GHz
GeForce RTX 2080 Super Max-Q
~ 75 fps
GeForce RTX 2080 Super Max-Q:
139.8 166.1 ~ 153 fps
GeForce RTX 2080 Super Max-Q:
118.7 123.5 ~ 121 fps
GeForce RTX 2080 Super Max-Q:
108.6 114.5 ~ 112 fps
GeForce RTX 2080 Super Max-Q:
104.5 112.8 ~ 109 fps
GeForce RTX 2080 Super Max-Q:
219 253 268 ~ 247 fps
GeForce RTX 2080 Super Max-Q:
167 174 184 ~ 175 fps
GeForce RTX 2080 Super Max-Q:
149 150 161 ~ 153 fps
GeForce RTX 2080 Super Max-Q:
102 115 118 119 [X] Razer Blade 15 RTX 2080 Super Max-Q GPU: Hoch
Intel Core i7-10875H 2.3GHz
GeForce RTX 2080 Super Max-Q
min:
99 fps, max:
137 fps
126 [X] SCHENKER Key 15 Comet Lake Leistungsmodus
Intel Core i7-10875H 2.3GHz
GeForce RTX 2080 Super Max-Q
min:
108 fps, max:
148 fps
~ 116 fps
GeForce RTX 2080 Super Max-Q:
89 fps
GeForce RTX 2080 Super Max-Q:
51 fps
GeForce RTX 2080 Super Max-Q:
78.4 82.9 84.3 89.7 92.7 [X] SCHENKER Key 15 Comet Lake Leistungsmodus
Intel Core i7-10875H 2.3GHz
GeForce RTX 2080 Super Max-Q
~ 86 fps
GeForce RTX 2080 Super Max-Q:
54 57.9 ~ 56 fps
GeForce RTX 2080 Super Max-Q:
28.1 30.3 ~ 29 fps
GeForce RTX 2080 Super Max-Q:
140 144.4 147 152.1 155.1 163.7 [X] SCHENKER Key 15 Comet Lake Leistungsmodus
Intel Core i7-10875H 2.3GHz
GeForce RTX 2080 Super Max-Q
165.2 [X] Asus ROG Zephyrus Duo 15 GX550LXS Turbo
Intel Core i9-10980HK 2.4GHz
GeForce RTX 2080 Super Max-Q
177.7 ~ 156 fps
GeForce RTX 2080 Super Max-Q:
108 116.7 131.2 [X] Asus ROG Zephyrus Duo 15 GX550LXS Intel Core i9-10980HK 2.4GHz
GeForce RTX 2080 Super Max-Q
~ 119 fps
GeForce RTX 2080 Super Max-Q:
58 64 73.3 [X] Asus ROG Zephyrus Duo 15 GX550LXS Intel Core i9-10980HK 2.4GHz
GeForce RTX 2080 Super Max-Q
~ 65 fps
100%
GeForce GTX 1650 Max-Q:
114.8 fps
181%
GeForce RTX 2080 Super Max-Q:
207.4 fps
100%
GeForce GTX 1650 Max-Q:
45.6 fps
263%
GeForce RTX 2080 Super Max-Q:
119 121.4 ~ 120 fps
100%
GeForce GTX 1650 Max-Q:
35.3 fps
289%
GeForce RTX 2080 Super Max-Q:
101 102 ~ 102 fps
GeForce RTX 2080 Super Max-Q:
68.8 fps
GeForce RTX 2080 Super Max-Q:
32.4 fps
GeForce RTX 2080 Super Max-Q:
121 fps
GeForce RTX 2080 Super Max-Q:
121 121 ~ 121 fps
GeForce RTX 2080 Super Max-Q:
120 121 ~ 121 fps
GeForce RTX 2080 Super Max-Q:
119 120 ~ 120 fps
GeForce RTX 2080 Super Max-Q:
83.1 fps
GeForce RTX 2080 Super Max-Q:
39.7 fps
100%
GeForce GTX 1650 Max-Q:
54.4 56.3 ~ 55 fps
100%
GeForce GTX 1650 Max-Q:
40.1 43.5 ~ 42 fps
100%
GeForce GTX 1650 Max-Q:
26.5 29.3 ~ 28 fps
100%
GeForce GTX 1650 Max-Q:
16.2 18.6 ~ 17 fps
GeForce RTX 2080 Super Max-Q:
35 36.2 37 ~ 36 fps
100%
GeForce GTX 1650 Max-Q:
50.4 57.2 ~ 54 fps
100%
GeForce GTX 1650 Max-Q:
40.3 49.7 ~ 45 fps
100%
GeForce GTX 1650 Max-Q:
39.6 44.4 ~ 42 fps
GeForce RTX 2080 Super Max-Q:
72.2 76.2 ~ 74 fps
100%
GeForce GTX 1650 Max-Q:
12.7 fps
315%
GeForce RTX 2080 Super Max-Q:
36.8 42.7 ~ 40 fps
100%
GeForce GTX 1650 Max-Q:
67.6 68.9 ~ 68 fps
150%
GeForce RTX 2080 Super Max-Q:
101.9 [X] MSI GS66 10SGS Intel Core i7-10750H 2.6GHz
GeForce RTX 2080 Super Max-Q
min:
86 fps, max:
118 fps
fps
100%
GeForce GTX 1650 Max-Q:
50.6 52.2 ~ 51 fps
182%
GeForce RTX 2080 Super Max-Q:
92 [X] MSI GS66 10SGS Intel Core i7-10750H 2.6GHz
GeForce RTX 2080 Super Max-Q
min:
66 fps, max:
110 fps
93 ~ 93 fps
100%
GeForce GTX 1650 Max-Q:
44 46.8 ~ 45 fps
189%
GeForce RTX 2080 Super Max-Q:
84 [X] MSI GS66 10SGS Intel Core i7-10750H 2.6GHz
GeForce RTX 2080 Super Max-Q
min:
66 fps, max:
107 fps
86.6 ~ 85 fps
100%
GeForce GTX 1650 Max-Q:
37.2 40.6 ~ 39 fps
205%
GeForce RTX 2080 Super Max-Q:
76.9 [X] MSI GS66 10SGS Intel Core i7-10750H 2.6GHz
GeForce RTX 2080 Super Max-Q
min:
59 fps, max:
89 fps
83.3 ~ 80 fps
GeForce RTX 2080 Super Max-Q:
66.9 fps
GeForce RTX 2080 Super Max-Q:
40.9 fps
100%
GeForce GTX 1650 Max-Q:
85 94.1 ~ 90 fps
188%
GeForce RTX 2080 Super Max-Q:
165.5 172.3 ~ 169 fps
100%
GeForce GTX 1650 Max-Q:
54.8 59 ~ 57 fps
100%
GeForce GTX 1650 Max-Q:
44.1 49.8 ~ 47 fps
100%
GeForce GTX 1650 Max-Q:
38.4 40.6 ~ 40 fps
100%
GeForce GTX 1650 Max-Q:
92.4 121.5 ~ 107 fps
163%
GeForce RTX 2080 Super Max-Q:
174.8 fps
100%
GeForce GTX 1650 Max-Q:
60 65.9 ~ 63 fps
167%
GeForce RTX 2080 Super Max-Q:
85.9 125 ~ 105 fps
100%
GeForce GTX 1650 Max-Q:
47.6 53.4 ~ 51 fps
184%
GeForce RTX 2080 Super Max-Q:
77.7 111 ~ 94 fps
100%
GeForce GTX 1650 Max-Q:
35.2 36.7 ~ 36 fps
203%
GeForce RTX 2080 Super Max-Q:
72 74 ~ 73 fps
GeForce RTX 2080 Super Max-Q:
66.4 fps
GeForce RTX 2080 Super Max-Q:
46.9 fps
100%
GeForce GTX 1650 Max-Q:
63 75 ~ 69 fps
181%
GeForce RTX 2080 Super Max-Q:
117 [X] MSI GS66 10SGS Intel Core i7-10750H 2.6GHz
GeForce RTX 2080 Super Max-Q
min:
60 fps, max:
199 fps
128 130 ~ 125 fps
100%
GeForce GTX 1650 Max-Q:
41 43 ~ 42 fps
231%
GeForce RTX 2080 Super Max-Q:
93 95 96 [X] MSI GS66 10SGS Intel Core i7-10750H 2.6GHz
GeForce RTX 2080 Super Max-Q
min:
62 fps, max:
148 fps
102 ~ 97 fps
100%
GeForce GTX 1650 Max-Q:
39 41 ~ 40 fps
220%
GeForce RTX 2080 Super Max-Q:
86 [X] MSI GS66 10SGS Intel Core i7-10750H 2.6GHz
GeForce RTX 2080 Super Max-Q
min:
60 fps, max:
133 fps
87 88 92 ~ 88 fps
100%
GeForce GTX 1650 Max-Q:
24 26 ~ 25 fps
268%
GeForce RTX 2080 Super Max-Q:
65 [X] MSI GS66 10SGS Intel Core i7-10750H 2.6GHz
GeForce RTX 2080 Super Max-Q
min:
51 fps, max:
96 fps
65 66 70 ~ 67 fps
GeForce RTX 2080 Super Max-Q:
49 53 ~ 51 fps
GeForce RTX 2080 Super Max-Q:
29 31 ~ 30 fps
100%
GeForce GTX 1650 Max-Q:
150 198.6 ~ 174 fps
100%
GeForce GTX 1650 Max-Q:
118 127.9 ~ 123 fps
204%
GeForce RTX 2080 Super Max-Q:
251 fps
100%
GeForce GTX 1650 Max-Q:
115 121.5 ~ 118 fps
194%
GeForce RTX 2080 Super Max-Q:
217 241 ~ 229 fps
100%
GeForce GTX 1650 Max-Q:
114 117.7 ~ 116 fps
196%
GeForce RTX 2080 Super Max-Q:
213 240 ~ 227 fps
GeForce RTX 2080 Super Max-Q:
189 239 ~ 214 fps
GeForce RTX 2080 Super Max-Q:
114 190 ~ 152 fps
100%
GeForce GTX 1650 Max-Q:
86 103.1 ~ 95 fps
137%
GeForce RTX 2080 Super Max-Q:
128.3 132.5 ~ 130 fps
100%
GeForce GTX 1650 Max-Q:
50.5 53.6 ~ 52 fps
100%
GeForce GTX 1650 Max-Q:
33.2 34.9 ~ 34 fps
100%
GeForce GTX 1650 Max-Q:
25.1 26 ~ 26 fps
GeForce RTX 2080 Super Max-Q:
49.1 51.7 ~ 50 fps
GeForce RTX 2080 Super Max-Q:
26.6 26.9 ~ 27 fps
100%
GeForce GTX 1650 Max-Q:
102.8 120 ~ 111 fps
200%
GeForce RTX 2080 Super Max-Q:
221.7 fps
100%
GeForce GTX 1650 Max-Q:
36.1 39.9 ~ 38 fps
268%
GeForce RTX 2080 Super Max-Q:
96.6 107 ~ 102 fps
100%
GeForce GTX 1650 Max-Q:
26.3 29.1 ~ 28 fps
264%
GeForce RTX 2080 Super Max-Q:
71 71.1 79.8 ~ 74 fps
GeForce RTX 2080 Super Max-Q:
46.1 48.4 ~ 47 fps
GeForce RTX 2080 Super Max-Q:
22 24.9 ~ 23 fps
100%
GeForce GTX 1650 Max-Q:
127 fps
161%
GeForce RTX 2080 Super Max-Q:
205 [X] MSI GS66 10SGS Intel Core i7-10750H 2.6GHz
GeForce RTX 2080 Super Max-Q
min:
167 fps, max:
228 fps
fps
100%
GeForce GTX 1650 Max-Q:
83 84 ~ 84 fps
204%
GeForce RTX 2080 Super Max-Q:
168 [X] MSI GS66 10SGS Intel Core i7-10750H 2.6GHz
GeForce RTX 2080 Super Max-Q
min:
139 fps, max:
183 fps
174 ~ 171 fps
100%
GeForce GTX 1650 Max-Q:
65 69 ~ 67 fps
215%
GeForce RTX 2080 Super Max-Q:
141 147 [X] MSI GS66 10SGS Intel Core i7-10750H 2.6GHz
GeForce RTX 2080 Super Max-Q
min:
122 fps, max:
160 fps
~ 144 fps
100%
GeForce GTX 1650 Max-Q:
41 46 ~ 44 fps
318%
GeForce RTX 2080 Super Max-Q:
138 142 [X] MSI GS66 10SGS Intel Core i7-10750H 2.6GHz
GeForce RTX 2080 Super Max-Q
min:
123 fps, max:
154 fps
~ 140 fps
100%
GeForce GTX 1650 Max-Q:
35 fps
349%
GeForce RTX 2080 Super Max-Q:
122 fps
100%
GeForce GTX 1650 Max-Q:
20 fps
370%
GeForce RTX 2080 Super Max-Q:
74 fps
100%
GeForce GTX 1650 Max-Q:
150.1 fps
100%
GeForce GTX 1650 Max-Q:
52.4 fps
100%
GeForce GTX 1650 Max-Q:
31.9 fps
100%
GeForce GTX 1650 Max-Q:
23 fps
278%
GeForce RTX 2080 Super Max-Q:
61 62.5 64.1 [X] MSI GS66 10SGS Intel Core i7-10750H 2.6GHz
GeForce RTX 2080 Super Max-Q
min:
56 fps, max:
78 fps
69 ~ 64 fps
GeForce RTX 2080 Super Max-Q:
39.9 fps
GeForce RTX 2080 Super Max-Q:
19.6 fps
100%
GeForce GTX 1650 Max-Q:
103 fps
100%
GeForce GTX 1650 Max-Q:
43 46.5 ~ 45 fps
280%
GeForce RTX 2080 Super Max-Q:
126 fps
100%
GeForce GTX 1650 Max-Q:
36.6 39.7 ~ 38 fps
274%
GeForce RTX 2080 Super Max-Q:
102 106 ~ 104 fps
100%
GeForce GTX 1650 Max-Q:
35.8 38.9 ~ 37 fps
276%
GeForce RTX 2080 Super Max-Q:
101 103 ~ 102 fps
100%
GeForce GTX 1650 Max-Q:
22.4 fps
295%
GeForce RTX 2080 Super Max-Q:
63.8 68.4 ~ 66 fps
100%
GeForce GTX 1650 Max-Q:
7.4 fps
446%
GeForce RTX 2080 Super Max-Q:
30.9 34.1 ~ 33 fps
100%
GeForce GTX 1650 Max-Q:
60.4 fps
263%
GeForce RTX 2080 Super Max-Q:
159 fps
100%
GeForce GTX 1650 Max-Q:
52.2 56.8 ~ 55 fps
175%
GeForce RTX 2080 Super Max-Q:
94 98.2 ~ 96 fps
100%
GeForce GTX 1650 Max-Q:
34.7 36.2 ~ 35 fps
217%
GeForce RTX 2080 Super Max-Q:
74.4 76.7 ~ 76 fps
100%
GeForce GTX 1650 Max-Q:
18 19.2 ~ 19 fps
237%
GeForce RTX 2080 Super Max-Q:
44.4 44.9 ~ 45 fps
100%
GeForce GTX 1650 Max-Q:
13.8 fps
281%
GeForce RTX 2080 Super Max-Q:
38.8 fps
100%
GeForce GTX 1650 Max-Q:
8.4 fps
276%
GeForce RTX 2080 Super Max-Q:
23.2 fps
100%
GeForce GTX 1650 Max-Q:
82 fps
201%
GeForce RTX 2080 Super Max-Q:
165 fps
100%
GeForce GTX 1650 Max-Q:
51 56 ~ 54 fps
228%
GeForce RTX 2080 Super Max-Q:
117 129 ~ 123 fps
100%
GeForce GTX 1650 Max-Q:
41 45 ~ 43 fps
242%
GeForce RTX 2080 Super Max-Q:
96 112 ~ 104 fps
100%
GeForce GTX 1650 Max-Q:
30 32 ~ 31 fps
248%
GeForce RTX 2080 Super Max-Q:
73 80 ~ 77 fps
100%
GeForce GTX 1650 Max-Q:
20 fps
295%
GeForce RTX 2080 Super Max-Q:
59 fps
100%
GeForce GTX 1650 Max-Q:
9 fps
344%
GeForce RTX 2080 Super Max-Q:
31 fps
100%
GeForce GTX 1650 Max-Q:
154 fps
164%
GeForce RTX 2080 Super Max-Q:
252 [X] MSI GS66 10SGS Intel Core i7-10750H 2.6GHz
GeForce RTX 2080 Super Max-Q
min:
246 fps, max:
259 fps
fps
100%
GeForce GTX 1650 Max-Q:
64 81.6 ~ 73 fps
229%
GeForce RTX 2080 Super Max-Q:
166 168.4 [X] MSI GS66 10SGS Intel Core i7-10750H 2.6GHz
GeForce RTX 2080 Super Max-Q
min:
143 fps, max:
192 fps
~ 167 fps
100%
GeForce GTX 1650 Max-Q:
51.1 68.8 ~ 60 fps
267%
GeForce RTX 2080 Super Max-Q:
158.5 [X] MSI GS66 10SGS Intel Core i7-10750H 2.6GHz
GeForce RTX 2080 Super Max-Q
min:
133 fps, max:
176 fps
162 ~ 160 fps
100%
GeForce GTX 1650 Max-Q:
31.7 38.7 ~ 35 fps
269%
GeForce RTX 2080 Super Max-Q:
90 [X] MSI GS66 10SGS Intel Core i7-10750H 2.6GHz
GeForce RTX 2080 Super Max-Q
min:
72 fps, max:
105 fps
98.8 ~ 94 fps
100%
GeForce GTX 1650 Max-Q:
23.1 fps
331%
GeForce RTX 2080 Super Max-Q:
76.4 fps
100%
GeForce GTX 1650 Max-Q:
51.3 fps
100%
GeForce GTX 1650 Max-Q:
44.6 49.4 ~ 47 fps
100%
GeForce GTX 1650 Max-Q:
40.9 42.6 ~ 42 fps
100%
GeForce GTX 1650 Max-Q:
30.3 34.9 ~ 33 fps
100%
GeForce GTX 1650 Max-Q:
22.6 fps
100%
GeForce GTX 1650 Max-Q:
13.1 fps
100%
GeForce GTX 1650 Max-Q:
39 72 ~ 56 fps
100%
GeForce GTX 1650 Max-Q:
21 52 53 ~ 42 fps
245%
GeForce RTX 2080 Super Max-Q:
103 fps
100%
GeForce GTX 1650 Max-Q:
20 49 50 ~ 40 fps
245%
GeForce RTX 2080 Super Max-Q:
97 98 ~ 98 fps
100%
GeForce GTX 1650 Max-Q:
19 46 46 ~ 37 fps
243%
GeForce RTX 2080 Super Max-Q:
87 92 ~ 90 fps
100%
GeForce GTX 1650 Max-Q:
32 fps
234%
GeForce RTX 2080 Super Max-Q:
71 78 ~ 75 fps
100%
GeForce GTX 1650 Max-Q:
16 fps
288%
GeForce RTX 2080 Super Max-Q:
43 48 ~ 46 fps
100%
GeForce GTX 1650 Max-Q:
73.3 fps
187%
GeForce RTX 2080 Super Max-Q:
131 143.3 [X] MSI GS66 10SGS Intel Core i7-10750H 2.6GHz
GeForce RTX 2080 Super Max-Q
min:
79.8 fps, max:
209.6 fps
~ 137 fps
100%
GeForce GTX 1650 Max-Q:
35.4 36.9 ~ 36 fps
269%
GeForce RTX 2080 Super Max-Q:
93.2 96.2 [X] MSI GS66 10SGS Intel Core i7-10750H 2.6GHz
GeForce RTX 2080 Super Max-Q
min:
46.1 fps, max:
169 fps
101 ~ 97 fps
100%
GeForce GTX 1650 Max-Q:
26.4 27.5 ~ 27 fps
274%
GeForce RTX 2080 Super Max-Q:
70.3 74.4 [X] MSI GS66 10SGS Intel Core i7-10750H 2.6GHz
GeForce RTX 2080 Super Max-Q
min:
34.6 fps, max:
131.1 fps
77.8 ~ 74 fps
100%
GeForce GTX 1650 Max-Q:
21.6 22.6 ~ 22 fps
273%
GeForce RTX 2080 Super Max-Q:
57.2 59 [X] MSI GS66 10SGS Intel Core i7-10750H 2.6GHz
GeForce RTX 2080 Super Max-Q
min:
30.4 fps, max:
106.3 fps
63.4 ~ 60 fps
100%
GeForce GTX 1650 Max-Q:
16.4 fps
312%
GeForce RTX 2080 Super Max-Q:
51.2 fps
100%
GeForce GTX 1650 Max-Q:
9.9 fps
319%
GeForce RTX 2080 Super Max-Q:
31.6 fps
100%
GeForce GTX 1650 Max-Q:
143.9 144 ~ 144 fps
208%
GeForce RTX 2080 Super Max-Q:
299 [X] MSI GS66 10SGS Intel Core i7-10750H 2.6GHz
GeForce RTX 2080 Super Max-Q
min:
296 fps, max:
301 fps
fps
267%
GeForce RTX 2080 Super Max-Q:
194 196 [X] MSI GS66 10SGS Intel Core i7-10750H 2.6GHz
GeForce RTX 2080 Super Max-Q
min:
180 fps, max:
219 fps
~ 195 fps
271%
GeForce RTX 2080 Super Max-Q:
148.8 [X] MSI GS66 10SGS Intel Core i7-10750H 2.6GHz
GeForce RTX 2080 Super Max-Q
min:
139 fps, max:
162 fps
165 ~ 157 fps
272%
GeForce RTX 2080 Super Max-Q:
147.6 [X] MSI GS66 10SGS Intel Core i7-10750H 2.6GHz
GeForce RTX 2080 Super Max-Q
min:
136 fps, max:
161 fps
163 ~ 155 fps
100%
GeForce GTX 1650 Max-Q:
39.7 fps
297%
GeForce RTX 2080 Super Max-Q:
118 fps
100%
GeForce GTX 1650 Max-Q:
21.9 fps
297%
GeForce RTX 2080 Super Max-Q:
65 fps
100%
GeForce GTX 1650 Max-Q:
59 fps
258%
GeForce RTX 2080 Super Max-Q:
152 fps
100%
GeForce GTX 1650 Max-Q:
42.6 fps
265%
GeForce RTX 2080 Super Max-Q:
113 fps
100%
GeForce GTX 1650 Max-Q:
39.7 fps
264%
GeForce RTX 2080 Super Max-Q:
105 fps
100%
GeForce GTX 1650 Max-Q:
26.2 fps
282%
GeForce RTX 2080 Super Max-Q:
73.9 fps
100%
GeForce GTX 1650 Max-Q:
13.2 fps
313%
GeForce RTX 2080 Super Max-Q:
41.3 fps
100%
GeForce GTX 1650 Max-Q:
67.4 fps
166%
GeForce RTX 2080 Super Max-Q:
112 fps
100%
GeForce GTX 1650 Max-Q:
53.4 fps
204%
GeForce RTX 2080 Super Max-Q:
109 fps
100%
GeForce GTX 1650 Max-Q:
47.1 fps
219%
GeForce RTX 2080 Super Max-Q:
103 fps
100%
GeForce GTX 1650 Max-Q:
29.3 fps
280%
GeForce RTX 2080 Super Max-Q:
82.1 fps
100%
GeForce GTX 1650 Max-Q:
9.7 fps
445%
GeForce RTX 2080 Super Max-Q:
43.2 fps
GeForce RTX 2080 Super Max-Q:
154.3 173 ~ 164 fps
100%
GeForce GTX 1650 Max-Q:
63.6 fps
215%
GeForce RTX 2080 Super Max-Q:
124.7 139 148 ~ 137 fps
100%
GeForce GTX 1650 Max-Q:
54.1 fps
100%
GeForce GTX 1650 Max-Q:
49.3 fps
100%
GeForce GTX 1650 Max-Q:
36.1 fps
266%
GeForce RTX 2080 Super Max-Q:
95.4 96.1 ~ 96 fps
100%
GeForce GTX 1650 Max-Q:
19.4 fps
289%
GeForce RTX 2080 Super Max-Q:
52.6 58.7 ~ 56 fps
100%
GeForce GTX 1650 Max-Q:
136 fps
100%
GeForce GTX 1650 Max-Q:
84 fps
100%
GeForce GTX 1650 Max-Q:
60.6 fps
100%
GeForce GTX 1650 Max-Q:
40.7 fps
100%
GeForce GTX 1650 Max-Q:
53.1 fps
163%
GeForce RTX 2080 Super Max-Q:
86.7 fps
100%
GeForce GTX 1650 Max-Q:
47.6 fps
165%
GeForce RTX 2080 Super Max-Q:
78.6 fps
100%
GeForce GTX 1650 Max-Q:
44.4 fps
173%
GeForce RTX 2080 Super Max-Q:
77 fps
100%
GeForce GTX 1650 Max-Q:
28.6 fps
266%
GeForce RTX 2080 Super Max-Q:
76 fps
100%
GeForce GTX 1650 Max-Q:
14.1 fps
327%
GeForce RTX 2080 Super Max-Q:
46.1 fps
100%
GeForce GTX 1650 Max-Q:
62.7 fps
100%
GeForce GTX 1650 Max-Q:
58.5 fps
100%
GeForce GTX 1650 Max-Q:
50.9 fps
100%
GeForce GTX 1650 Max-Q:
32.7 fps
100%
GeForce GTX 1650 Max-Q:
10.9 fps
GeForce RTX 2080 Super Max-Q:
102 [X] MSI GS66 10SGS Intel Core i7-10750H 2.6GHz
GeForce RTX 2080 Super Max-Q
min:
48 fps, max:
161 fps
fps
100%
GeForce GTX 1650 Max-Q:
49 fps
184%
GeForce RTX 2080 Super Max-Q:
87 [X] MSI GS66 10SGS Intel Core i7-10750H 2.6GHz
GeForce RTX 2080 Super Max-Q
min:
39 fps, max:
143 fps
92 ~ 90 fps
100%
GeForce GTX 1650 Max-Q:
41 fps
188%
GeForce RTX 2080 Super Max-Q:
75 [X] MSI GS66 10SGS Intel Core i7-10750H 2.6GHz
GeForce RTX 2080 Super Max-Q
min:
33 fps, max:
139 fps
78 ~ 77 fps
100%
GeForce GTX 1650 Max-Q:
20 fps
280%
GeForce RTX 2080 Super Max-Q:
54 [X] MSI GS66 10SGS Intel Core i7-10750H 2.6GHz
GeForce RTX 2080 Super Max-Q
min:
35 fps, max:
89 fps
58 ~ 56 fps
100%
GeForce GTX 1650 Max-Q:
17 fps
312%
GeForce RTX 2080 Super Max-Q:
53 fps
100%
GeForce GTX 1650 Max-Q:
8 fps
400%
GeForce RTX 2080 Super Max-Q:
32 fps
100%
GeForce GTX 1650 Max-Q:
112 fps
100%
GeForce GTX 1650 Max-Q:
74 fps
100%
GeForce GTX 1650 Max-Q:
69 fps
100%
GeForce GTX 1650 Max-Q:
55 fps
100%
GeForce GTX 1650 Max-Q:
195 fps
100%
GeForce GTX 1650 Max-Q:
179 fps
100%
GeForce GTX 1650 Max-Q:
173 fps
100%
GeForce GTX 1650 Max-Q:
124 fps
100%
GeForce GTX 1650 Max-Q:
64.8 fps
111%
GeForce RTX 2080 Super Max-Q:
103 117 138 [X] MSI GS66 10SGS Intel Core i7-10750H 2.6GHz
GeForce RTX 2080 Super Max-Q
min:
101 fps, max:
175 fps
139 150 ~ 129 fps
253%
GeForce RTX 2080 Super Max-Q:
89 91 [X] Asus ROG Zephyrus Duo 15 GX550LXS Turbo
Intel Core i9-10980HK 2.4GHz
GeForce RTX 2080 Super Max-Q
92 92 [X] Razer Blade 15 RTX 2080 Super Max-Q GPU: Hoch
Intel Core i7-10875H 2.3GHz
GeForce RTX 2080 Super Max-Q
93 96 [X] MSI GS66 10SGS Intel Core i7-10750H 2.6GHz
GeForce RTX 2080 Super Max-Q
min:
81 fps, max:
156 fps
97 99 103 [X] SCHENKER Key 15 Comet Lake Leistungsmodus
Intel Core i7-10875H 2.3GHz
GeForce RTX 2080 Super Max-Q
106 ~ 96 fps
100%
GeForce GTX 1650 Max-Q:
24 fps
288%
GeForce RTX 2080 Super Max-Q:
63 67 72 75 [X] Asus ROG Zephyrus Duo 15 GX550LXS Intel Core i9-10980HK 2.4GHz
GeForce RTX 2080 Super Max-Q
~ 69 fps
100%
GeForce GTX 1650 Max-Q:
12 fps
308%
GeForce RTX 2080 Super Max-Q:
32 36 39 41 [X] Asus ROG Zephyrus Duo 15 GX550LXS Intel Core i9-10980HK 2.4GHz
GeForce RTX 2080 Super Max-Q
~ 37 fps
100%
GeForce GTX 1650 Max-Q:
46.3 fps
227%
GeForce RTX 2080 Super Max-Q:
105 fps
100%
GeForce GTX 1650 Max-Q:
40.1 fps
244%
GeForce RTX 2080 Super Max-Q:
97.7 fps
100%
GeForce GTX 1650 Max-Q:
31.4 fps
287%
GeForce RTX 2080 Super Max-Q:
90 fps
100%
GeForce GTX 1650 Max-Q:
19.2 fps
330%
GeForce RTX 2080 Super Max-Q:
63.3 fps
100%
GeForce GTX 1650 Max-Q:
8.9 fps
358%
GeForce RTX 2080 Super Max-Q:
31.9 fps
100%
GeForce GTX 1650 Max-Q:
59.3 fps
100%
GeForce GTX 1650 Max-Q:
49.1 fps
100%
GeForce GTX 1650 Max-Q:
42 fps
100%
GeForce GTX 1650 Max-Q:
26.4 fps
100%
GeForce GTX 1650 Max-Q:
13 fps
100%
GeForce GTX 1650 Max-Q:
47 91 ~ 69 fps
197%
GeForce RTX 2080 Super Max-Q:
111 143 154 ~ 136 fps
100%
GeForce GTX 1650 Max-Q:
24 52 ~ 38 fps
295%
GeForce RTX 2080 Super Max-Q:
100 115 122 ~ 112 fps
100%
GeForce GTX 1650 Max-Q:
22 48 ~ 35 fps
306%
GeForce RTX 2080 Super Max-Q:
96 108 116 ~ 107 fps
100%
GeForce GTX 1650 Max-Q:
21 45 ~ 33 fps
306%
GeForce RTX 2080 Super Max-Q:
91 101 102 110 ~ 101 fps
GeForce RTX 2080 Super Max-Q:
77 fps
GeForce RTX 2080 Super Max-Q:
42 fps
100%
GeForce GTX 1650 Max-Q:
414.6 fps
100%
GeForce GTX 1650 Max-Q:
160.1 fps
100%
GeForce GTX 1650 Max-Q:
59.4 fps
GeForce RTX 2080 Super Max-Q:
67 fps
100%
GeForce GTX 1650 Max-Q:
48.1 fps
247%
GeForce RTX 2080 Super Max-Q:
119 fps
100%
GeForce GTX 1650 Max-Q:
38 fps
263%
GeForce RTX 2080 Super Max-Q:
100 fps
100%
GeForce GTX 1650 Max-Q:
26.4 fps
273%
GeForce RTX 2080 Super Max-Q:
72 fps
100%
GeForce GTX 1650 Max-Q:
18.5 fps
303%
GeForce RTX 2080 Super Max-Q:
56.1 fps
100%
GeForce GTX 1650 Max-Q:
9.4 fps
339%
GeForce RTX 2080 Super Max-Q:
31.9 fps
100%
GeForce GTX 1650 Max-Q:
51.7 91.2 ~ 71 fps
251%
GeForce RTX 2080 Super Max-Q:
103 fps
255%
GeForce RTX 2080 Super Max-Q:
67 80.8 ~ 74 fps
100%
GeForce GTX 1650 Max-Q:
23.4 fps
100%
GeForce GTX 1650 Max-Q:
8.7 9.6 ~ 9 fps
418%
GeForce RTX 2080 Super Max-Q:
37.6 fps
100%
GeForce GTX 1650 Max-Q:
138 fps
88%
GeForce RTX 2080 Super Max-Q:
121 fps
100%
GeForce GTX 1650 Max-Q:
79.9 fps
143%
GeForce RTX 2080 Super Max-Q:
114 fps
100%
GeForce GTX 1650 Max-Q:
59.1 fps
168%
GeForce RTX 2080 Super Max-Q:
99.5 fps
100%
GeForce GTX 1650 Max-Q:
36.2 fps
222%
GeForce RTX 2080 Super Max-Q:
80.3 fps
100%
GeForce GTX 1650 Max-Q:
10.9 fps
408%
GeForce RTX 2080 Super Max-Q:
44.5 fps
100%
GeForce GTX 1650 Max-Q:
72.2 fps
100%
GeForce GTX 1650 Max-Q:
62.3 fps
100%
GeForce GTX 1650 Max-Q:
46.5 fps
100%
GeForce GTX 1650 Max-Q:
29.4 fps
100%
GeForce GTX 1650 Max-Q:
5.6 fps
100%
GeForce GTX 1650 Max-Q:
72.3 fps
100%
GeForce GTX 1650 Max-Q:
61.8 fps
100%
GeForce GTX 1650 Max-Q:
58.9 fps
100%
GeForce GTX 1650 Max-Q:
38.6 fps
100%
GeForce GTX 1650 Max-Q:
19.1 fps
100%
GeForce GTX 1650 Max-Q:
61.1 fps
100%
GeForce GTX 1650 Max-Q:
48.6 fps
100%
GeForce GTX 1650 Max-Q:
37.3 fps
100%
GeForce GTX 1650 Max-Q:
24.5 fps
100%
GeForce GTX 1650 Max-Q:
12.2 fps
100%
GeForce GTX 1650 Max-Q:
64 fps
100%
GeForce GTX 1650 Max-Q:
47 fps
100%
GeForce GTX 1650 Max-Q:
35 fps
100%
GeForce GTX 1650 Max-Q:
14 fps
100%
GeForce GTX 1650 Max-Q:
84.6 fps
100%
GeForce GTX 1650 Max-Q:
70.8 fps
100%
GeForce GTX 1650 Max-Q:
52.6 fps
100%
GeForce GTX 1650 Max-Q:
16.6 fps
100%
GeForce GTX 1650 Max-Q:
42.7 fps
100%
GeForce GTX 1650 Max-Q:
97.5 fps
100%
GeForce GTX 1650 Max-Q:
77.3 fps
100%
GeForce GTX 1650 Max-Q:
67.1 fps
100%
GeForce GTX 1650 Max-Q:
23.6 fps
100%
GeForce GTX 1650 Max-Q:
48.5 fps
100%
GeForce GTX 1650 Max-Q:
44.4 fps
100%
GeForce GTX 1650 Max-Q:
21.7 fps
100%
GeForce GTX 1650 Max-Q:
14.6 fps
100%
GeForce GTX 1650 Max-Q:
66.8 fps
100%
GeForce GTX 1650 Max-Q:
63.8 fps
100%
GeForce GTX 1650 Max-Q:
49.4 fps
100%
GeForce GTX 1650 Max-Q:
19.1 fps
100%
GeForce GTX 1650 Max-Q:
146 fps
100%
GeForce GTX 1650 Max-Q:
78.8 fps
100%
GeForce GTX 1650 Max-Q:
65.2 fps
100%
GeForce GTX 1650 Max-Q:
21.5 fps
100%
GeForce GTX 1650 Max-Q:
53.9 fps
100%
GeForce GTX 1650 Max-Q:
44.8 fps
100%
GeForce GTX 1650 Max-Q:
21.2 fps
100%
GeForce GTX 1650 Max-Q:
43 fps
100%
GeForce GTX 1650 Max-Q:
22.9 fps
100%
GeForce GTX 1650 Max-Q:
14.1 fps
100%
GeForce GTX 1650 Max-Q:
54.7 fps
100%
GeForce GTX 1650 Max-Q:
49.9 fps
100%
GeForce GTX 1650 Max-Q:
17.5 fps
100%
GeForce GTX 1650 Max-Q:
119 fps
100%
GeForce GTX 1650 Max-Q:
69.5 fps
100%
GeForce GTX 1650 Max-Q:
39.1 fps
100%
GeForce GTX 1650 Max-Q:
79.6 fps
100%
GeForce GTX 1650 Max-Q:
77.4 fps
100%
GeForce GTX 1650 Max-Q:
23.9 fps
100%
GeForce GTX 1650 Max-Q:
60.3 fps
100%
GeForce GTX 1650 Max-Q:
42.5 fps
100%
GeForce GTX 1650 Max-Q:
36.9 fps
100%
GeForce GTX 1650 Max-Q:
134.6 fps
100%
GeForce GTX 1650 Max-Q:
93 fps
100%
GeForce GTX 1650 Max-Q:
50.9 fps
100%
GeForce GTX 1650 Max-Q:
41.7 fps
100%
GeForce GTX 1650 Max-Q:
18.3 fps
100%
GeForce GTX 1650 Max-Q:
115 fps
100%
GeForce GTX 1650 Max-Q:
101 fps
100%
GeForce GTX 1650 Max-Q:
40 fps
100%
GeForce GTX 1650 Max-Q:
179 fps
100%
GeForce GTX 1650 Max-Q:
144.1 fps
100%
GeForce GTX 1650 Max-Q:
117.7 fps
100%
GeForce GTX 1650 Max-Q:
104.2 fps
GeForce RTX 2080 Super Max-Q:
102 fps
100%
GeForce GTX 1650 Max-Q:
121 fps
100%
GeForce GTX 1650 Max-Q:
75 fps
100%
GeForce GTX 1650 Max-Q:
64 fps
100%
GeForce GTX 1650 Max-Q:
38 fps
274%
GeForce RTX 2080 Super Max-Q:
74.3 75.1 75.8 82.6 83.4 87.7 88.6 [X] Razer Blade 15 RTX 2080 Super Max-Q GPU: Hoch
Intel Core i7-10875H 2.3GHz
GeForce RTX 2080 Super Max-Q
88.8 90.2 95.8 [X] Asus ROG Zephyrus Duo 15 GX550LXS Turbo
Intel Core i9-10980HK 2.4GHz
GeForce RTX 2080 Super Max-Q
96 [X] SCHENKER Key 15 Comet Lake Leistungsmodus
Intel Core i7-10875H 2.3GHz
GeForce RTX 2080 Super Max-Q
~ 85 fps
100%
GeForce GTX 1650 Max-Q:
17.5 17.6 ~ 18 fps
300%
GeForce RTX 2080 Super Max-Q:
49.8 53.5 54.3 [X] Asus ROG Zephyrus Duo 15 GX550LXS Turbo
Intel Core i9-10980HK 2.4GHz
GeForce RTX 2080 Super Max-Q
58.2 ~ 54 fps
100%
GeForce GTX 1650 Max-Q:
162.7 fps
111%
GeForce RTX 2080 Super Max-Q:
179 180 [X] MSI Creator 17 A10SGS Intel Core i7-10875H 2.3GHz
GeForce RTX 2080 Super Max-Q
min:
3.47 fps, P1:
143 fps, max:
253 fps
~ 180 fps
100%
GeForce GTX 1650 Max-Q:
142.8 fps
121%
GeForce RTX 2080 Super Max-Q:
172 174 [X] MSI Creator 17 A10SGS Intel Core i7-10875H 2.3GHz
GeForce RTX 2080 Super Max-Q
min:
5.72 fps, P1:
125 fps, max:
348 fps
~ 173 fps
100%
GeForce GTX 1650 Max-Q:
76.5 fps
203%
GeForce RTX 2080 Super Max-Q:
153 157 [X] MSI Creator 17 A10SGS Intel Core i7-10875H 2.3GHz
GeForce RTX 2080 Super Max-Q
min:
7.17 fps, P1:
100 fps, max:
309 fps
~ 155 fps
100%
GeForce GTX 1650 Max-Q:
36 fps
239%
GeForce RTX 2080 Super Max-Q:
85.3 85.8 ~ 86 fps
GeForce RTX 2080 Super Max-Q:
71.5 [X] MSI Creator 17 A10SGS Intel Core i7-10875H 2.3GHz
GeForce RTX 2080 Super Max-Q
min:
26.5 fps, P1:
52.6 fps, max:
150 fps
fps
140%
GeForce RTX 2080 Super Max-Q:
347.4 400 [X] Asus ROG Zephyrus Duo 15 GX550LXS Turbo
Intel Core i9-10980HK 2.4GHz
GeForce RTX 2080 Super Max-Q
425.1 426.3 ~ 400 fps
163%
GeForce RTX 2080 Super Max-Q:
330.2 344.4 [X] Asus ROG Zephyrus Duo 15 GX550LXS Turbo
Intel Core i9-10980HK 2.4GHz
GeForce RTX 2080 Super Max-Q
349.2 364.5 ~ 347 fps
168%
GeForce RTX 2080 Super Max-Q:
300.5 319.9 [X] Asus ROG Zephyrus Duo 15 GX550LXS Turbo
Intel Core i9-10980HK 2.4GHz
GeForce RTX 2080 Super Max-Q
323.7 324.2 ~ 317 fps
232%
GeForce RTX 2080 Super Max-Q:
170.2 173 173.1 181.1 [X] Asus ROG Zephyrus Duo 15 GX550LXS Turbo
Intel Core i9-10980HK 2.4GHz
GeForce RTX 2080 Super Max-Q
~ 174 fps
100%
GeForce GTX 1650 Max-Q:
367.2 fps
100%
GeForce GTX 1650 Max-Q:
253.9 fps
100%
GeForce GTX 1650 Max-Q:
191.5 fps
100%
GeForce GTX 1650 Max-Q:
92.7 fps
100%
GeForce GTX 1650 Max-Q:
309.6 fps
100%
GeForce GTX 1650 Max-Q:
294.4 fps
100%
GeForce GTX 1650 Max-Q:
258.6 fps
100%
GeForce GTX 1650 Max-Q:
166.6 fps
Average Gaming NVIDIA GeForce GTX 1650 Max-Q → 100% Average Gaming 30-70 fps → 100%
Average Gaming NVIDIA GeForce RTX 2080 Super Max-Q → 241% Average Gaming 30-70 fps → 315%
 Deutsch
 English
 Español
 Français
 Italiano
 Nederlands
 Polski
 Português
 Русский
 Türkçe
 Svenska
 Chinese
 Magyar