NVIDIA GeForce GTX 1050 Ti Max-Q vs AMD Radeon RX Vega M GL / 870 vs NVIDIA GeForce GTX 1070 SLI (Desktop)
NVIDIA GeForce GTX 1050 Ti Max-Q ► remove from comparison
Die Nvidia GeForce GTX 1050 Ti mit Max-Q Design ist eine Mittelklasse-GPU basierend auf der Pascal-Architektur und wurde im Januar 2018 vorgestellt. Anders als die schnelleren Modelle basiert die GTX 1050 Ti auf dem GP107-Chip, der im 14-nm-Verfahren bei Samsung hergestellt wird.
Im Vergleich zur normalen GTX 1050 Ti gibt es noch weitere Unterschiede als den Takt. Der Treiber wurde auf Effizienz (und nicht Leistung) optimiert (nur für die Max-Q Modelle), optimierte Spannungswandler für 1V Betreib, high-end Kühlungsmethoden und eine 40 dB Grenze für die Lüfterlautstärke (mit Taktanpasssungen um dies jederzeit zu gewährleisten) zeichnen die Max-Q Variante aus.
Features
Der GP107-Chip wird in einem 14-nm-FinFET-Prozess bei Samsung gefertigt und bietet eine Reihe neuer Features, unter anderem Support für DisplayPort 1.4 (ready), HDMI 2.0b, HDR, Simultaneous Multi-Projection (SMP) sowie verbessertes H.265 Video De- und Encoding (PlayReady 3.0). Eine genaue Auflistung der Verbesserungen und Features der neuen Pascal Desktop-GPUs finden Sie in unserem Pascal-Architektur-Artikel .
Performance
Die exakte Performance der GeForce GTX 1050 Ti Max-Q kann sich in Abhängigkeit von der Kühlung des jeweiligen Notebooks stark unterscheiden. Im Optimalfall ist die Leistung etwa 10 bis 15 % unterhalb der normalen GTX 1050 Ti angesiedelt. Dadurch eignet sich die Grafikkarte am besten für Full HD (1920 x 1080) bei hoher aber nicht maximaler Detailstufe.
Leistungsaufnahme
Die Leistungsaufnahme der GeForce GTX 1050 Ti Max-Q ist von Nvidia mit 40 - 46 Watt spezifiziert und damit deutlich unterhalb der normalen Notebook GTX 1050 Ti (64 Watt). Selbst die normale GTX 1050 ist mit 53 Watt höher spezifziert. Damit eignet sich die Grafikkarte auch für dünne und leichte 14-Zoll Notebooks.
AMD Radeon RX Vega M GL / 870 ► remove from comparison
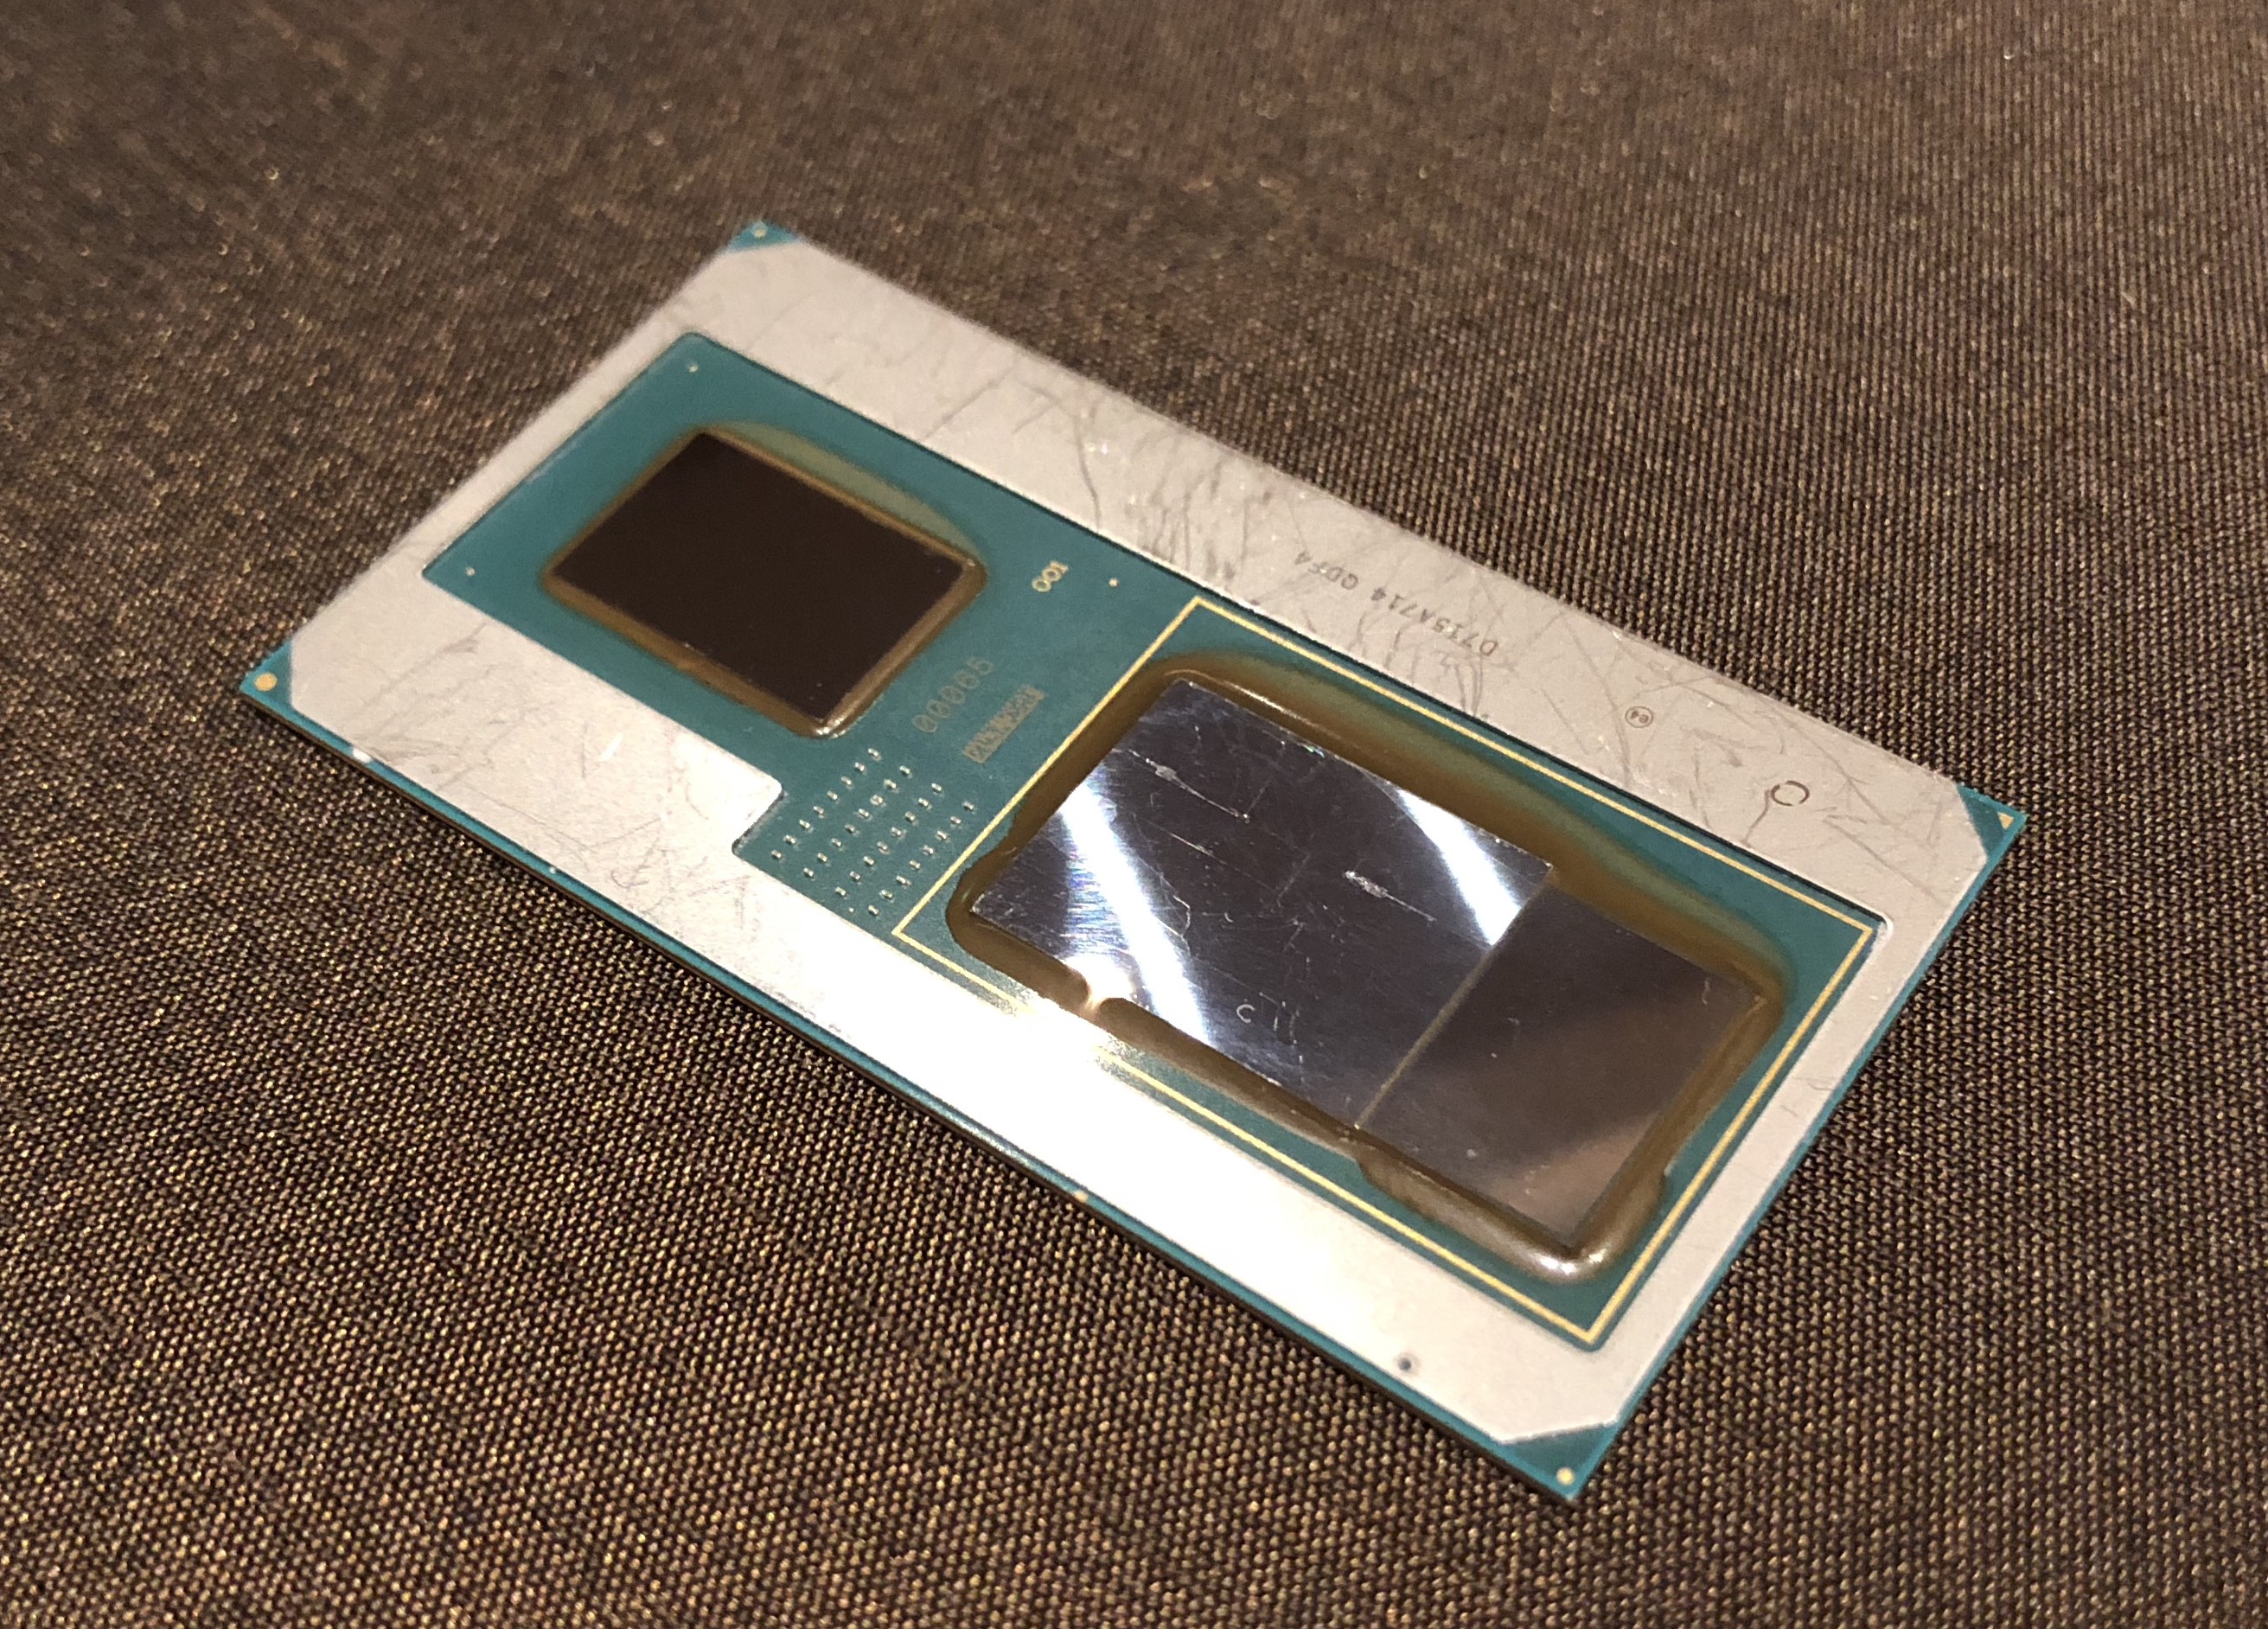
Die AMD Radeon RX Vega M GL bzw. Radeon RX Vega 870 (laut Dell) ist die integrierte Grafikkarte in den schwächeren Intel Kaby-Lake-G SoCs, wie dem Core i7-8706G, i7-8706G oder i5-8305G. Sie wurde Anfang 2018 von Intel vorgestellt und befindet sich direkt auf dem selben Package wie der Kaby-Lake Prozessor und 4 GB HBM2 Grafikspeicher. Nach ersten veröffentlichten Benchmarks von Intel sollte die Leistung zwischen einer GTX 1050 und GTX 1050 Ti liegen. Die Treiber werden von Intel veröffentlicht, sind jedoch anscheinend nur leicht modifizierte AMD Treiber. Die Vega M GL nutzt 20 CUs (1280 Shader) bei einer Taktrate von 931 bis 1011 MHz (Boost).
Anscheinend ist die Grafikkarte eine Mischung aus Polaris (Shader?) und Vega (zumindest dem Speicherkontroller). Nähere Informationen gibt es nicht, jedoch gibt sich die GPU als Polaris 22 aus und unterstützt auch nicht die selben DirectX 12 Features wie die Vega Desktop Grafikkarten. Mehr Informationen zur Vega Architektur finden Sie in unserem Raven Ridge Architekturartikel .
Der Stromverbrauch sollte ähnlich einer dedizierten Vega Mobile GPU sein, wobei die Kaby-Lake-G Kombination eventuell durch eine gemeinsame Stromversorgung effizienter arbeiten kann.
NVIDIA GeForce GTX 1070 SLI (Desktop) ► remove from comparison
Die Nvidia GeForce GTX 1070 SLI (Desktop) bezeichnet einen SLI-Verbund aus zwei High-End GeForce GTX 1070 Grafikkarten für Desktops . Die GPUs nutzen denselben GP104-Chip mit 1.920 CUDA-Kernen wie das Desktop-Modell. Beide Karten rendern jeweils abwechselnd ein Bild (AFR), wodurch sich die Leistung gegenüber einer einzelnen GPU im Optimalfall fast verdoppelt. Der je 8 GB große Grafikspeicher verdoppelt sich durch den Einsatz beider Karten nicht, da jeweils die selben Daten gespeichert werden.
Features
Der GP104-Chip wird in einem 16nm-FinFET-Prozess bei TSMC gefertigt und bietet eine Reihe neuer Features, unter anderem Support für DisplayPort 1.4 (ready), HDMI 2.0b, HDR, Simultaneous Multi-Projection (SMP) sowie verbessertes H.265 Video De- und Encoding (PlayReady 3.0). Eine genaue Auflistung der Verbesserungen und Features der neuen Pascal Desktop-GPUs finden Sie in unserem Pascal-Architektur-Artikel
Performance
Die Performance der GTX 1070 SLI ist stark abhängig vom Treibersupport und den Spielen. Im Optimalfall wird die Performance einer einzelnen GTX 1070, wie schon bei den Vorgängern, fast verdoppelt, in anderen Fällen kann der Verbund auch deutlich schlechter oder gar nicht skalieren. Des Weiteren können mehr oder weniger ausgeprägte Mikroruckler die gefühlte Performance beeinträchtigen. Dennoch lassen sich die meisten Spiele des Jahres 2016 in maximalen Einstellungen und 4K-Auflösung flüssig darstellen.
Leistungsaufnahme
Im SLI-Verbund verdoppelt sich der Stromverbrauch gegenüber einer einzelnen GTX 1070, sodass beide Karten zusammen vermutlich etwa 300 Watt aufnehmen dürften.
NVIDIA GeForce GTX 1050 Ti Max-Q AMD Radeon RX Vega M GL / 870 NVIDIA GeForce GTX 1070 SLI (Desktop) GeForce GTX 1000 Serie Codename N17P-G1 Max-Q Vega Kaby Lake-G Pascal GP104 SLI Architektur Pascal Vega Pascal Pipelines 768 - unified 1280 - unified 3840 - unified Kerntakt 1151 – 1290 - 1290 – 1417 (Boost) MHz 931 - 1011 (Boost) MHz 1506 - 1683 (Boost) MHz Speichertakt 7000 MHz 8000 MHz Speicherbandbreite 128 Bit 256 Bit Speichertyp GDDR5 HBM2 GDDR5 Max. Speichergröße 4 GB 4 GB 2x 8192 MB Shared Memory nein nein nein API DirectX 12_1, OpenGL 4.5 DirectX 12_1 DirectX 12_1, OpenGL 4.5 Stromverbrauch 40 - 46 Watt 65 Watt 300 Watt Herstellungsprozess 16 nm 14 nm 16 nm Features Multi-Projection, VR Ready, G-SYNC, Vulkan, Multi Monitor Tiled Rasterization, Shared Memory (up to Dual-Channel DDR4-2400) Multi-Projection, VR Ready, G-SYNC, Vulkan, Multi Monitor, CUDA, 3D Vision, PhysX, GeForce Experience, Surround, GameStream, GPU Boost 2.0, Adaptive Vertical Sync, SLI Notebookgröße mittel (15.4" z.B.) mittel (15.4" z.B.) Erscheinungsdatum 03.01.2018 07.01.2018 16.08.2016 Herstellerseite www.nvidia.com Transistors 14.4 Billion
Benchmarks Performance Rating - 3DMark 11 + Fire Strike + Time Spy - GeForce GTX 1050 Ti Max-Q
3.3 pt (10%)
...
NVIDIA GeForce GTX 1050 Ti Max-Q
...
max:
Performance Rating - 3DMark 11 + Fire Strike + Time Spy - Vega M GL / 870
3.3 pt (10%)
...
AMD Radeon RX Vega M GL / 870
...
max:
Performance Rating - 3DMark 11 + Fire Strike + Time Spy - GeForce GTX 1070 SLI (Desktop)
15.6 pt (47%)
...
NVIDIA GeForce GTX 1070 SLI (Desktop)
max:
3DMark - 3DMark Time Spy Score
min: 2361 avg: 2453 median: 2485 (7%) max: 2513 Points
min: 2121 avg: 2199 median: 2225 (6%) max: 2252 Points
10595 Points (31%)
3DMark - 3DMark Time Spy Graphics
min: 2196 avg: 2245 median: 2261 (6%) max: 2278 Points
min: 2031 avg: 2070 median: 2072 (5%) max: 2108 Points
11429 Points (30%)
3DMark - 3DMark Ice Storm Unlimited Graphics
324705 Points (37%)
min: 261434 avg: 290539 median: 299071 (34%) max: 311111 Points
373694 Points (42%)
3DMark - 3DMark Ice Storm Extreme Graphics
39641 Points (5%)
min: 46963 avg: 106261 median: 106261 (14%) max: 165559 Points
319308 Points (41%)
3DMark - 3DMark Cloud Gate Score
min: 20755 avg: 24100 median: 24021 (26%) max: 28253 Points
min: 15911 avg: 19226 median: 19473 (21%) max: 21322 Points
44914 Points (48%)
3DMark - 3DMark Cloud Gate Graphics
min: 41871 avg: 46017 median: 46952 (12%) max: 50801 Points
min: 37915 avg: 40459 median: 38812 (10%) max: 44796 Points
140180 Points (37%)
3DMark - 3DMark Fire Strike Standard Score
min: 6175 avg: 6548 median: 6688 (12%) max: 6753 Points
min: 5879 avg: 6114 median: 6225 (11%) max: 6280 Points
21076 Points (37%)
3DMark - 3DMark Fire Strike Standard Graphics
min: 6957 avg: 7281 median: 7324 (8%) max: 7428 Points
min: 7059 avg: 7254 median: 7329 (8%) max: 7355 Points
34226 Points (39%)
3DMark - 3DMark Ice Storm Graphics
min: 41029 avg: 73224 median: 60442 (7%) max: 118202 Points
min: 74196 avg: 127123 median: 127123 (15%) max: 180050 Points
320858 Points (38%)
3DMark 11 - 3DM11 Performance Score
min: 8250 avg: 8936 median: 9106 (13%) max: 9414 Points
min: 9104 avg: 9465 median: 9380 (13%) max: 9890 Points
26494 Points (37%)
3DMark 11 - 3DM11 Performance GPU
min: 8317 avg: 8781 median: 8752 (8%) max: 9079 Points
min: 9632 avg: 9910 median: 9862 (8%) max: 10118 Points
42691 Points (37%)
3DMark Vantage + NVIDIA GeForce GTX 1050 Ti Max-Q 3DMark Vantage - 3DM Vant. Perf. total
min: 24827 avg: 29504 median: 29503.5 (9%) max: 34180 Points
3DM Vant. Perf. GPU no PhysX + NVIDIA GeForce GTX 1050 Ti Max-Q 3DMark Vantage - 3DM Vant. Perf. GPU no PhysX
min: 25707 avg: 29448 median: 29448 (17%) max: 33189 Points
3DMark 03 - 3DMark 03 - Standard
133872 Points (70%)
3DMark 05 - 3DMark 05 - Standard
38635 Points (42%)
3DMark 06 3DMark 06 - Standard 1280x1024 + NVIDIA GeForce GTX 1050 Ti Max-Q
min: 26796 avg: 28797 median: 28797 (38%) max: 30798 Points
3DMark 06 - Standard 1280x1024 + AMD Radeon RX Vega M GL / 870
16707 Points (22%)
3DMark 06 - Standard 1280x1024 + NVIDIA GeForce GTX 1070 SLI (Desktop)
30179 Points (39%)
3DMark 06 - Standard 1024x768 + NVIDIA GeForce GTX 1050 Ti Max-Q
34786 Points (45%)
Unigine Valley 1.0 - Unigine Valley 1.0 DX
40.1 fps (13%)
97.7 fps (32%)
Unigine Heaven 2.1 - Heaven 2.1 high
86 fps (16%)
SPECviewperf 12 + AMD Radeon RX Vega M GL / 870 SPECviewperf 12 - specvp12 sw-03
53 fps (13%)
specvp12 sw-03 + NVIDIA GeForce GTX 1070 SLI (Desktop)
40.6 fps (10%)
specvp12 snx-02 + AMD Radeon RX Vega M GL / 870 SPECviewperf 12 - specvp12 snx-02
16.5 fps (2%)
specvp12 snx-02 + NVIDIA GeForce GTX 1070 SLI (Desktop)
6.4 fps (1%)
specvp12 showcase-01 + AMD Radeon RX Vega M GL / 870 SPECviewperf 12 - specvp12 showcase-01
30.6 fps (7%)
specvp12 showcase-01 + NVIDIA GeForce GTX 1070 SLI (Desktop)
81.9 fps (18%)
specvp12 mediacal-01 + AMD Radeon RX Vega M GL / 870 SPECviewperf 12 - specvp12 mediacal-01
15.6 fps (4%)
specvp12 mediacal-01 + NVIDIA GeForce GTX 1070 SLI (Desktop)
33.9 fps (9%)
specvp12 maya-04 + AMD Radeon RX Vega M GL / 870 SPECviewperf 12 - specvp12 maya-04
39.9 fps (11%)
specvp12 maya-04 + NVIDIA GeForce GTX 1070 SLI (Desktop)
82.8 fps (23%)
specvp12 energy-01 + AMD Radeon RX Vega M GL / 870 SPECviewperf 12 - specvp12 energy-01
2.7 fps (2%)
specvp12 energy-01 + NVIDIA GeForce GTX 1070 SLI (Desktop)
7.2 fps (6%)
specvp12 creo-01 + AMD Radeon RX Vega M GL / 870 SPECviewperf 12 - specvp12 creo-01
37 fps (15%)
specvp12 creo-01 + NVIDIA GeForce GTX 1070 SLI (Desktop)
33.4 fps (13%)
specvp12 catia-04 + AMD Radeon RX Vega M GL / 870 SPECviewperf 12 - specvp12 catia-04
55.5 fps (9%)
specvp12 catia-04 + NVIDIA GeForce GTX 1070 SLI (Desktop)
61.5 fps (10%)
specvp12 3dsmax-05 + NVIDIA GeForce GTX 1070 SLI (Desktop) SPECviewperf 12 - specvp12 3dsmax-05
97.1 fps (17%)
Cinebench R10 Cinebench R10 Shading (32bit) + NVIDIA GeForce GTX 1050 Ti Max-Q Cinebench R10 - Cinebench R10 Shading (32bit)
min: 4597 avg: 5340 median: 4972 (4%) max: 6451 Points
Cinebench R10 Shading (32bit) + AMD Radeon RX Vega M GL / 870
min: 9486 avg: 9791 median: 9791 (7%) max: 10096 Points
Cinebench R11.5 Cinebench R11.5 OpenGL 64 Bit + NVIDIA GeForce GTX 1050 Ti Max-Q Cinebench R11.5 - Cinebench R11.5 OpenGL 64 Bit
min: 66.9 avg: 71.7 median: 71.7 (25%) max: 76.5 fps
Cinebench R11.5 OpenGL 64 Bit + AMD Radeon RX Vega M GL / 870
min: 96.2 avg: 102.6 median: 104.3 (36%) max: 107.4 fps
Cinebench R15 + NVIDIA GeForce GTX 1050 Ti Max-Q Cinebench R15 - Cinebench R15 OpenGL 64 Bit
min: 92.1 avg: 105.4 median: 102 (6%) max: 120.7 fps
Cinebench R15 OpenGL 64 Bit + AMD Radeon RX Vega M GL / 870
min: 98.6 avg: 116.4 median: 120.7 (7%) max: 125.5 fps
Cinebench R15 OpenGL Ref. Match 64 Bit + NVIDIA GeForce GTX 1050 Ti Max-Q Cinebench R15 - Cinebench R15 OpenGL Ref. Match 64 Bit
99.6 % (100%)
Cinebench R15 OpenGL Ref. Match 64 Bit + AMD Radeon RX Vega M GL / 870
98 % (98%)
GFXBench - GFXBench 5.0 Aztec Ruins High Tier Offscreen
49.5 fps (9%)
63.8 fps (12%)
GFXBench - GFXBench 5.0 Aztec Ruins Normal Tier Offscreen
119.1 fps (9%)
158.2 fps (12%)
GFXBench - GFXBench Car Chase Offscreen
min: 108.8 avg: 124.2 median: 124.2 (14%) max: 139.5 fps
110 fps (12%)
GFXBench 3.1 - GFXBench Manhattan ES 3.1 Offscreen
min: 168 avg: 184.9 median: 184.9 (4%) max: 201.7 fps
132.5 fps (3%)
GFXBench 3.0 - GFXBench 3.0 Manhattan Offscreen
min: 229.8 avg: 253.2 median: 253.2 (15%) max: 276.5 fps
182.5 fps (11%)
GFXBench (DX / GLBenchmark) 2.7 + NVIDIA GeForce GTX 1050 Ti Max-Q GFXBench (DX / GLBenchmark) 2.7 - GFXBench T-Rex HD Offscreen C24Z16
min: 501 avg: 531 median: 531 (4%) max: 561 fps
GFXBench T-Rex HD Offscreen C24Z16 + AMD Radeon RX Vega M GL / 870
502 fps (4%)
LuxMark v2.0 64Bit - LuxMark v2.0 Room GPU
min: 1167 avg: 1201 median: 1200.5 (5%) max: 1234 Samples/s
min: 1096 avg: 1131 median: 1130.5 (5%) max: 1165 Samples/s
4923 Samples/s (22%)
LuxMark v2.0 64Bit - LuxMark v2.0 Sala GPU
min: 2100 avg: 2222 median: 2221.5 (4%) max: 2343 Samples/s
min: 2205 avg: 2253 median: 2253 (4%) max: 2301 Samples/s
9410 Samples/s (16%)
ComputeMark v2.1 - ComputeMark v2.1 Result
min: 4515 avg: 4879 median: 4879 (5%) max: 5243 Points
min: 862 avg: 2179 median: 956 (1%) max: 4719 Points
12910 Points (14%)
Power Consumption - Furmark Stress Test Power Consumption - external Monitor *
73.1 Watt (10%)
Power Consumption - The Witcher 3 Power Consumption - external Monitor *
75.8 Watt (11%)
Power Consumption - Witcher 3 Power Consumption *
min: 82 avg: 90 median: 85 (19%) max: 103 Watt
min: 84.3 avg: 85.8 median: 85.8 (19%) max: 87.2 Watt
Power Consumption - Witcher 3 ultra Power Efficiency
min: 0.2379 avg: 0.3 median: 0.3 (29%) max: 0.3073 fps per Watt
0.2 fps per Watt (24%)
Power Consumption - Witcher 3 ultra Power Efficiency - external Monitor
0.3 fps per Watt (27%)
Emissions Witcher 3 Fan Noise + NVIDIA GeForce GTX 1050 Ti Max-Q Emissions - Witcher 3 Fan Noise
min: 36.4 avg: 40.2 median: 38.4 (61%) max: 47.6 dB(A)
Witcher 3 Fan Noise + AMD Radeon RX Vega M GL / 870
min: 44.2 avg: 45.7 median: 44.7 (72%) max: 48.1 dB(A)
Clock Speed - GPU Clock Witcher 3 ultra
1392 MHz (55%)
1011 MHz (40%)
Clock Speed - GPU Clock Speed Furmark
838 MHz (33%)
Average Benchmarks NVIDIA GeForce GTX 1050 Ti Max-Q → 100% n=15 Average Benchmarks AMD Radeon RX Vega M GL / 870 → 106% n=15 Average Benchmarks NVIDIA GeForce GTX 1070 SLI (Desktop) → 376% n=15
- Bereich der Benchmarkergebnisse für diese Grafikkarte
- Durchschnittliche Benchmarkergebnisse für diese Grafikkarte
* Smaller numbers mean a higher performance
1 This benchmark is not used for the average calculation
Spiele-Benchmarks Die folgenden Benchmarks basieren auf unseren Spieletests mit Testnotebooks. Die Performance dieser Grafikkarte bei den gelisteten Spielen ist abhängig von der verwendeten CPU, Speicherausstattung, Treiber und auch Betriebssystem. Dadurch müssen die untenstehenden Werte nicht repräsentativ sein. Detaillierte Informationen über das verwendete System sehen Sie nach einem Klick auf den fps-Wert.
Vega M GL / 870:
172.7 [X] Dell XPS 15 9575 FY00N Intel Core i7-8705G 3.1GHz
Vega M GL / 870
fps
Vega M GL / 870:
57.7 [X] Dell XPS 15 9575 FY00N Intel Core i7-8705G 3.1GHz
Vega M GL / 870
fps
Vega M GL / 870:
39.4 [X] Dell XPS 15 9575 FY00N Intel Core i7-8705G 3.1GHz
Vega M GL / 870
fps
Vega M GL / 870:
27.4 [X] Dell XPS 15 9575 FY00N Intel Core i7-8705G 3.1GHz
Vega M GL / 870
fps
Vega M GL / 870:
18.4 [X] Dell XPS 15 9575 FY00N Intel Core i7-8705G 3.1GHz
Vega M GL / 870
fps
Vega M GL / 870:
8.8 [X] Dell XPS 15 9575 FY00N Intel Core i7-8705G 3.1GHz
Vega M GL / 870
fps
Vega M GL / 870:
83.4 [X] Dell XPS 15 9575 FY00N Intel Core i7-8705G 3.1GHz
Vega M GL / 870
fps
Vega M GL / 870:
46.7 [X] Dell XPS 15 9575 FY00N Intel Core i7-8705G 3.1GHz
Vega M GL / 870
fps
Vega M GL / 870:
27 [X] Dell XPS 15 9575 FY00N Intel Core i7-8705G 3.1GHz
Vega M GL / 870
fps
Vega M GL / 870:
90.6 [X] Dell XPS 15 9575 FY00N Intel Core i7-8705G 3.1GHz
Vega M GL / 870
fps
Vega M GL / 870:
35.3 [X] Dell XPS 15 9575 FY00N Intel Core i7-8705G 3.1GHz
Vega M GL / 870
fps
Vega M GL / 870:
29.5 [X] Dell XPS 15 9575 FY00N Intel Core i7-8705G 3.1GHz
Vega M GL / 870
fps
Vega M GL / 870:
18.9 [X] Dell XPS 15 9575 FY00N Intel Core i7-8705G 3.1GHz
Vega M GL / 870
fps
Vega M GL / 870:
97.9 [X] Dell XPS 15 9575 FY00N Intel Core i7-8705G 3.1GHz
Vega M GL / 870
fps
Vega M GL / 870:
45.2 [X] Dell XPS 15 9575 FY00N Intel Core i7-8705G 3.1GHz
Vega M GL / 870
fps
Vega M GL / 870:
34.3 [X] Dell XPS 15 9575 FY00N Intel Core i7-8705G 3.1GHz
Vega M GL / 870
fps
Vega M GL / 870:
29.8 [X] Dell XPS 15 9575 FY00N Intel Core i7-8705G 3.1GHz
Vega M GL / 870
fps
Vega M GL / 870:
20.8 [X] Dell XPS 15 9575 FY00N Intel Core i7-8705G 3.1GHz
Vega M GL / 870
fps
Vega M GL / 870:
9.5 [X] Dell XPS 15 9575 FY00N Intel Core i7-8705G 3.1GHz
Vega M GL / 870
fps
Vega M GL / 870:
69.1 [X] Dell XPS 15 9575 FY00N Intel Core i7-8705G 3.1GHz
Vega M GL / 870
fps
Vega M GL / 870:
34.9 [X] Dell XPS 15 9575 FY00N Intel Core i7-8705G 3.1GHz
Vega M GL / 870
fps
Vega M GL / 870:
20.6 [X] Dell XPS 15 9575 FY00N Intel Core i7-8705G 3.1GHz
Vega M GL / 870
fps
Vega M GL / 870:
12.1 [X] Dell XPS 15 9575 FY00N Intel Core i7-8705G 3.1GHz
Vega M GL / 870
fps
Vega M GL / 870:
47.7 [X] Dell XPS 15 9575 FY00N Intel Core i7-8705G 3.1GHz
Vega M GL / 870
fps
Vega M GL / 870:
39.3 [X] Dell XPS 15 9575 FY00N Intel Core i7-8705G 3.1GHz
Vega M GL / 870
fps
Vega M GL / 870:
32 [X] Dell XPS 15 9575 FY00N Intel Core i7-8705G 3.1GHz
Vega M GL / 870
fps
Vega M GL / 870:
20.8 [X] Dell XPS 15 9575 FY00N Intel Core i7-8705G 3.1GHz
Vega M GL / 870
fps
Vega M GL / 870:
9.9 [X] Dell XPS 15 9575 FY00N Intel Core i7-8705G 3.1GHz
Vega M GL / 870
fps
Vega M GL / 870:
64.9 [X] Dell XPS 15 9575 FY00N Intel Core i7-8705G 3.1GHz
Vega M GL / 870
fps
Vega M GL / 870:
43.7 [X] Dell XPS 15 9575 FY00N Intel Core i7-8705G 3.1GHz
Vega M GL / 870
fps
Vega M GL / 870:
36.7 [X] Dell XPS 15 9575 FY00N Intel Core i7-8705G 3.1GHz
Vega M GL / 870
fps
Vega M GL / 870:
30.5 [X] Dell XPS 15 9575 FY00N Intel Core i7-8705G 3.1GHz
Vega M GL / 870
fps
Vega M GL / 870:
22.1 [X] Dell XPS 15 9575 FY00N Intel Core i7-8705G 3.1GHz
Vega M GL / 870
fps
Vega M GL / 870:
11.5 [X] Dell XPS 15 9575 FY00N Intel Core i7-8705G 3.1GHz
Vega M GL / 870
fps
Vega M GL / 870:
72.1 [X] Dell XPS 15 9575 FY00N Intel Core i7-8705G 3.1GHz
Vega M GL / 870
fps
Vega M GL / 870:
44.4 [X] Dell XPS 15 9575 FY00N Intel Core i7-8705G 3.1GHz
Vega M GL / 870
fps
Vega M GL / 870:
37.8 [X] Dell XPS 15 9575 FY00N Intel Core i7-8705G 3.1GHz
Vega M GL / 870
fps
Vega M GL / 870:
33.5 [X] Dell XPS 15 9575 FY00N Intel Core i7-8705G 3.1GHz
Vega M GL / 870
fps
Vega M GL / 870:
21.1 [X] Dell XPS 15 9575 FY00N Intel Core i7-8705G 3.1GHz
Vega M GL / 870
fps
Vega M GL / 870:
11.8 [X] Dell XPS 15 9575 FY00N Intel Core i7-8705G 3.1GHz
Vega M GL / 870
fps
Vega M GL / 870:
120.5 [X] Dell XPS 15 9575 FY00N Intel Core i7-8705G 3.1GHz
Vega M GL / 870
fps
Vega M GL / 870:
50.5 [X] Dell XPS 15 9575 FY00N Intel Core i7-8705G 3.1GHz
Vega M GL / 870
fps
Vega M GL / 870:
42 [X] Dell XPS 15 9575 FY00N Intel Core i7-8705G 3.1GHz
Vega M GL / 870
fps
Vega M GL / 870:
26.8 [X] Dell XPS 15 9575 FY00N Intel Core i7-8705G 3.1GHz
Vega M GL / 870
fps
Vega M GL / 870:
14.7 [X] Dell XPS 15 9575 FY00N Intel Core i7-8705G 3.1GHz
Vega M GL / 870
fps
Vega M GL / 870:
9.2 [X] Dell XPS 15 9575 FY00N Intel Core i7-8705G 3.1GHz
Vega M GL / 870
fps
Vega M GL / 870:
55 [X] Dell XPS 15 9575 FY00N Intel Core i7-8705G 3.1GHz
Vega M GL / 870
fps
Vega M GL / 870:
33 [X] Dell XPS 15 9575 FY00N Intel Core i7-8705G 3.1GHz
Vega M GL / 870
fps
Vega M GL / 870:
30 [X] Dell XPS 15 9575 FY00N Intel Core i7-8705G 3.1GHz
Vega M GL / 870
fps
Vega M GL / 870:
20 [X] Dell XPS 15 9575 FY00N Intel Core i7-8705G 3.1GHz
Vega M GL / 870
fps
Vega M GL / 870:
12 [X] Dell XPS 15 9575 FY00N Intel Core i7-8705G 3.1GHz
Vega M GL / 870
fps
Vega M GL / 870:
4 [X] Dell XPS 15 9575 FY00N Intel Core i7-8705G 3.1GHz
Vega M GL / 870
fps
Vega M GL / 870:
98.9 [X] Dell XPS 15 9575 FY00N Intel Core i7-8705G 3.1GHz
Vega M GL / 870
fps
Vega M GL / 870:
76.9 [X] Dell XPS 15 9575 FY00N Intel Core i7-8705G 3.1GHz
Vega M GL / 870
fps
Vega M GL / 870:
49.7 [X] Dell XPS 15 9575 FY00N Intel Core i7-8705G 3.1GHz
Vega M GL / 870
fps
Vega M GL / 870:
87.5 [X] Dell XPS 15 9575 FY00N Intel Core i7-8705G 3.1GHz
Vega M GL / 870
fps
Vega M GL / 870:
39.3 [X] Dell XPS 15 9575 FY00N Intel Core i7-8705G 3.1GHz
Vega M GL / 870
fps
Vega M GL / 870:
24.2 [X] Dell XPS 15 9575 FY00N Intel Core i7-8705G 3.1GHz
Vega M GL / 870
fps
Vega M GL / 870:
18.5 [X] Dell XPS 15 9575 FY00N Intel Core i7-8705G 3.1GHz
Vega M GL / 870
fps
Vega M GL / 870:
12.6 [X] Dell XPS 15 9575 FY00N Intel Core i7-8705G 3.1GHz
Vega M GL / 870
fps
Vega M GL / 870:
5.4 [X] Dell XPS 15 9575 FY00N Intel Core i7-8705G 3.1GHz
Vega M GL / 870
fps
Vega M GL / 870:
87.6 [X] Dell XPS 15 9575 FY00N Intel Core i7-8705G 3.1GHz
Vega M GL / 870
fps
Vega M GL / 870:
27.5 [X] Dell XPS 15 9575 FY00N Intel Core i7-8705G 3.1GHz
Vega M GL / 870
fps
Vega M GL / 870:
19.8 [X] Dell XPS 15 9575 FY00N Intel Core i7-8705G 3.1GHz
Vega M GL / 870
fps
Vega M GL / 870:
12.6 [X] Dell XPS 15 9575 FY00N Intel Core i7-8705G 3.1GHz
Vega M GL / 870
fps
Vega M GL / 870:
5.9 [X] Dell XPS 15 9575 FY00N Intel Core i7-8705G 3.1GHz
Vega M GL / 870
fps
Vega M GL / 870:
122.5 [X] Dell XPS 15 9575 FY00N Intel Core i7-8705G 3.1GHz
Vega M GL / 870
min:
103 fps, max:
135 fps
fps
Vega M GL / 870:
37.8 [X] Dell XPS 15 9575 FY00N Intel Core i7-8705G 3.1GHz
Vega M GL / 870
min:
31 fps, max:
42 fps
fps
Vega M GL / 870:
23.7 [X] Dell XPS 15 9575 FY00N Intel Core i7-8705G 3.1GHz
Vega M GL / 870
min:
21 fps, max:
27 fps
fps
Vega M GL / 870:
16.7 [X] Dell XPS 15 9575 FY00N Intel Core i7-8705G 3.1GHz
Vega M GL / 870
min:
14 fps, max:
19 fps
fps
Vega M GL / 870:
9.5 [X] Dell XPS 15 9575 FY00N Intel Core i7-8705G 3.1GHz
Vega M GL / 870
min:
8 fps, max:
11 fps
fps
Vega M GL / 870:
3.6 [X] Dell XPS 15 9575 FY00N Intel Core i7-8705G 3.1GHz
Vega M GL / 870
min:
2 fps, max:
5 fps
fps
Vega M GL / 870:
52.8 [X] Dell XPS 15 9575 FY00N Intel Core i7-8705G 3.1GHz
Vega M GL / 870
fps
Vega M GL / 870:
27.7 [X] Dell XPS 15 9575 FY00N Intel Core i7-8705G 3.1GHz
Vega M GL / 870
fps
Vega M GL / 870:
4.4 [X] Dell XPS 15 9575 FY00N Intel Core i7-8705G 3.1GHz
Vega M GL / 870
fps
Vega M GL / 870:
84 [X] Dell XPS 15 9575 FY00N Intel Core i7-8705G 3.1GHz
Vega M GL / 870
fps
Vega M GL / 870:
41.3 [X] Dell XPS 15 9575 FY00N Intel Core i7-8705G 3.1GHz
Vega M GL / 870
fps
Vega M GL / 870:
23.7 [X] Dell XPS 15 9575 FY00N Intel Core i7-8705G 3.1GHz
Vega M GL / 870
fps
Vega M GL / 870:
12.1 [X] Dell XPS 15 9575 FY00N Intel Core i7-8705G 3.1GHz
Vega M GL / 870
fps
Vega M GL / 870:
8 [X] Dell XPS 15 9575 FY00N Intel Core i7-8705G 3.1GHz
Vega M GL / 870
fps
Vega M GL / 870:
4.2 [X] Dell XPS 15 9575 FY00N Intel Core i7-8705G 3.1GHz
Vega M GL / 870
fps
Vega M GL / 870:
88 [X] Dell XPS 15 9575 FY00N Intel Core i7-8705G 3.1GHz
Vega M GL / 870
fps
Vega M GL / 870:
46 [X] Dell XPS 15 9575 FY00N Intel Core i7-8705G 3.1GHz
Vega M GL / 870
fps
Vega M GL / 870:
34 [X] Dell XPS 15 9575 FY00N Intel Core i7-8705G 3.1GHz
Vega M GL / 870
fps
Vega M GL / 870:
24 [X] Dell XPS 15 9575 FY00N Intel Core i7-8705G 3.1GHz
Vega M GL / 870
fps
Vega M GL / 870:
15 [X] Dell XPS 15 9575 FY00N Intel Core i7-8705G 3.1GHz
Vega M GL / 870
fps
Vega M GL / 870:
7 [X] Dell XPS 15 9575 FY00N Intel Core i7-8705G 3.1GHz
Vega M GL / 870
fps
100%
GeForce GTX 1050 Ti Max-Q:
133.2 fps
135%
Vega M GL / 870:
179.6 [X] Dell XPS 15 9575 FY00N Intel Core i7-8705G 3.1GHz
Vega M GL / 870
fps
100%
GeForce GTX 1050 Ti Max-Q:
56.7 fps
125%
Vega M GL / 870:
70.7 [X] Dell XPS 15 9575 FY00N Intel Core i7-8705G 3.1GHz
Vega M GL / 870
fps
100%
GeForce GTX 1050 Ti Max-Q:
44.3 fps
123%
Vega M GL / 870:
54.4 [X] Dell XPS 15 9575 FY00N Intel Core i7-8705G 3.1GHz
Vega M GL / 870
fps
100%
GeForce GTX 1050 Ti Max-Q:
27.2 fps
111%
Vega M GL / 870:
30.1 [X] Dell XPS 15 9575 FY00N Intel Core i7-8705G 3.1GHz
Vega M GL / 870
fps
Vega M GL / 870:
21.2 [X] Dell XPS 15 9575 FY00N Intel Core i7-8705G 3.1GHz
Vega M GL / 870
fps
100%
GeForce GTX 1050 Ti Max-Q:
11.3 fps
100%
Vega M GL / 870:
11.3 [X] Dell XPS 15 9575 FY00N Intel Core i7-8705G 3.1GHz
Vega M GL / 870
fps
100%
GeForce GTX 1050 Ti Max-Q:
67.1 fps
83%
Vega M GL / 870:
55.6 [X] Dell XPS 15 9575 FY00N Intel Core i7-8705G 3.1GHz
Vega M GL / 870
fps
100%
GeForce GTX 1050 Ti Max-Q:
40.5 fps
100%
Vega M GL / 870:
40.6 [X] Dell XPS 15 9575 FY00N Intel Core i7-8705G 3.1GHz
Vega M GL / 870
fps
100%
GeForce GTX 1050 Ti Max-Q:
34 fps
110%
Vega M GL / 870:
37.4 [X] Dell XPS 15 9575 FY00N Intel Core i7-8705G 3.1GHz
Vega M GL / 870
fps
100%
GeForce GTX 1050 Ti Max-Q:
30.4 fps
87%
Vega M GL / 870:
26.4 [X] Dell XPS 15 9575 FY00N Intel Core i7-8705G 3.1GHz
Vega M GL / 870
fps
Vega M GL / 870:
19.8 [X] Dell XPS 15 9575 FY00N Intel Core i7-8705G 3.1GHz
Vega M GL / 870
fps
100%
GeForce GTX 1050 Ti Max-Q:
9 fps
110%
Vega M GL / 870:
9.9 [X] Dell XPS 15 9575 FY00N Intel Core i7-8705G 3.1GHz
Vega M GL / 870
fps
100%
GeForce GTX 1050 Ti Max-Q:
83 89 [X] MSI GF75 8RD-001 Intel Core i7-8750H 2.2GHz
GeForce GTX 1050 Ti Max-Q
min:
61 fps, max:
89 fps
~ 86 fps
86%
Vega M GL / 870:
74 [X] Dell XPS 15 9575 FY00N Intel Core i7-8705G 3.1GHz
Vega M GL / 870
fps
100%
GeForce GTX 1050 Ti Max-Q:
47 50 [X] MSI GF75 8RD-001 Intel Core i7-8750H 2.2GHz
GeForce GTX 1050 Ti Max-Q
min:
40 fps, max:
60 fps
~ 49 fps
90%
Vega M GL / 870:
44 [X] Dell XPS 15 9575 FY00N Intel Core i7-8705G 3.1GHz
Vega M GL / 870
fps
100%
GeForce GTX 1050 Ti Max-Q:
43 46 [X] MSI GF75 8RD-001 Intel Core i7-8750H 2.2GHz
GeForce GTX 1050 Ti Max-Q
min:
38 fps, max:
56 fps
~ 45 fps
91%
Vega M GL / 870:
41 [X] Dell XPS 15 9575 FY00N Intel Core i7-8705G 3.1GHz
Vega M GL / 870
fps
100%
GeForce GTX 1050 Ti Max-Q:
40 43 [X] MSI GF75 8RD-001 Intel Core i7-8750H 2.2GHz
GeForce GTX 1050 Ti Max-Q
min:
33 fps, max:
53 fps
~ 42 fps
90%
Vega M GL / 870:
38 [X] Dell XPS 15 9575 FY00N Intel Core i7-8705G 3.1GHz
Vega M GL / 870
fps
100%
GeForce GTX 1050 Ti Max-Q:
29 [X] MSI GF75 8RD-001 Intel Core i7-8750H 2.2GHz
GeForce GTX 1050 Ti Max-Q
min:
24 fps, max:
37 fps
fps
93%
Vega M GL / 870:
27 [X] Dell XPS 15 9575 FY00N Intel Core i7-8705G 3.1GHz
Vega M GL / 870
fps
100%
GeForce GTX 1050 Ti Max-Q:
14 15 [X] MSI GF75 8RD-001 Intel Core i7-8750H 2.2GHz
GeForce GTX 1050 Ti Max-Q
min:
11 fps, max:
19 fps
~ 15 fps
87%
Vega M GL / 870:
13 [X] Dell XPS 15 9575 FY00N Intel Core i7-8705G 3.1GHz
Vega M GL / 870
fps
100%
GeForce GTX 1050 Ti Max-Q:
55.5 60.4 [X] MSI GF75 8RD-001 Intel Core i7-8750H 2.2GHz
GeForce GTX 1050 Ti Max-Q
min:
31.8 fps, max:
115.6 fps
~ 58 fps
125%
Vega M GL / 870:
72.7 [X] Dell XPS 15 9575 FY00N Intel Core i7-8705G 3.1GHz
Vega M GL / 870
fps
100%
GeForce GTX 1050 Ti Max-Q:
31.4 [X] MSI GF75 8RD-001 Intel Core i7-8750H 2.2GHz
GeForce GTX 1050 Ti Max-Q
min:
15.8 fps, max:
53.7 fps
49.8 ~ 41 fps
80%
Vega M GL / 870:
32.8 [X] Dell XPS 15 9575 FY00N Intel Core i7-8705G 3.1GHz
Vega M GL / 870
fps
100%
GeForce GTX 1050 Ti Max-Q:
23.5 [X] MSI GF75 8RD-001 Intel Core i7-8750H 2.2GHz
GeForce GTX 1050 Ti Max-Q
min:
12.1 fps, max:
39.8 fps
36.5 ~ 30 fps
72%
Vega M GL / 870:
21.6 [X] Dell XPS 15 9575 FY00N Intel Core i7-8705G 3.1GHz
Vega M GL / 870
fps
100%
GeForce GTX 1050 Ti Max-Q:
19.3 [X] MSI GF75 8RD-001 Intel Core i7-8750H 2.2GHz
GeForce GTX 1050 Ti Max-Q
min:
10.4 fps, max:
19.3 fps
28.3 ~ 24 fps
75%
Vega M GL / 870:
18 [X] Dell XPS 15 9575 FY00N Intel Core i7-8705G 3.1GHz
Vega M GL / 870
fps
Vega M GL / 870:
13.9 [X] Dell XPS 15 9575 FY00N Intel Core i7-8705G 3.1GHz
Vega M GL / 870
fps
100%
GeForce GTX 1050 Ti Max-Q:
4.7 fps
Vega M GL / 870:
124.2 [X] Dell XPS 15 9575 FY00N Intel Core i7-8705G 3.1GHz
Vega M GL / 870
fps
Vega M GL / 870:
53 [X] Dell XPS 15 9575 FY00N Intel Core i7-8705G 3.1GHz
Vega M GL / 870
fps
Vega M GL / 870:
41.4 [X] Dell XPS 15 9575 FY00N Intel Core i7-8705G 3.1GHz
Vega M GL / 870
fps
Vega M GL / 870:
39.7 [X] Dell XPS 15 9575 FY00N Intel Core i7-8705G 3.1GHz
Vega M GL / 870
fps
Vega M GL / 870:
26.8 [X] Dell XPS 15 9575 FY00N Intel Core i7-8705G 3.1GHz
Vega M GL / 870
fps
Vega M GL / 870:
14.8 [X] Dell XPS 15 9575 FY00N Intel Core i7-8705G 3.1GHz
Vega M GL / 870
fps
100%
GeForce GTX 1050 Ti Max-Q:
73.2 fps
100%
GeForce GTX 1050 Ti Max-Q:
47.9 fps
100%
GeForce GTX 1050 Ti Max-Q:
36.1 fps
100%
GeForce GTX 1050 Ti Max-Q:
35.3 fps
100%
GeForce GTX 1050 Ti Max-Q:
12.9 fps
100%
GeForce GTX 1050 Ti Max-Q:
134.5 fps
100%
GeForce GTX 1050 Ti Max-Q:
87.4 fps
100%
GeForce GTX 1050 Ti Max-Q:
73.7 fps
100%
GeForce GTX 1050 Ti Max-Q:
65 fps
100%
GeForce GTX 1050 Ti Max-Q:
13.2 fps
100%
GeForce GTX 1050 Ti Max-Q:
100.1 fps
118%
Vega M GL / 870:
118.2 [X] Dell XPS 15 9575 FY00N Intel Core i7-8705G 3.1GHz
Vega M GL / 870
fps
100%
GeForce GTX 1050 Ti Max-Q:
57.3 fps
108%
Vega M GL / 870:
61.6 [X] Dell XPS 15 9575 FY00N Intel Core i7-8705G 3.1GHz
Vega M GL / 870
fps
100%
GeForce GTX 1050 Ti Max-Q:
47.9 fps
108%
Vega M GL / 870:
51.6 [X] Dell XPS 15 9575 FY00N Intel Core i7-8705G 3.1GHz
Vega M GL / 870
fps
100%
GeForce GTX 1050 Ti Max-Q:
44.8 fps
106%
Vega M GL / 870:
47.7 [X] Dell XPS 15 9575 FY00N Intel Core i7-8705G 3.1GHz
Vega M GL / 870
fps
Vega M GL / 870:
34.2 [X] Dell XPS 15 9575 FY00N Intel Core i7-8705G 3.1GHz
Vega M GL / 870
fps
100%
GeForce GTX 1050 Ti Max-Q:
17.3 fps
95%
Vega M GL / 870:
16.4 [X] Dell XPS 15 9575 FY00N Intel Core i7-8705G 3.1GHz
Vega M GL / 870
fps
100%
GeForce GTX 1050 Ti Max-Q:
193.6 fps
83%
Vega M GL / 870:
160.3 [X] Dell XPS 15 9575 FY00N Intel Core i7-8705G 3.1GHz
Vega M GL / 870
fps
100%
GeForce GTX 1050 Ti Max-Q:
128.7 fps
90%
Vega M GL / 870:
115.9 [X] Dell XPS 15 9575 FY00N Intel Core i7-8705G 3.1GHz
Vega M GL / 870
fps
100%
GeForce GTX 1050 Ti Max-Q:
80.5 fps
85%
Vega M GL / 870:
68.4 [X] Dell XPS 15 9575 FY00N Intel Core i7-8705G 3.1GHz
Vega M GL / 870
fps
100%
GeForce GTX 1050 Ti Max-Q:
61 fps
61%
Vega M GL / 870:
37.1 [X] Dell XPS 15 9575 FY00N Intel Core i7-8705G 3.1GHz
Vega M GL / 870
fps
Vega M GL / 870:
25.5 [X] Dell XPS 15 9575 FY00N Intel Core i7-8705G 3.1GHz
Vega M GL / 870
fps
100%
GeForce GTX 1050 Ti Max-Q:
22 fps
55%
Vega M GL / 870:
12.2 [X] Dell XPS 15 9575 FY00N Intel Core i7-8705G 3.1GHz
Vega M GL / 870
fps
100%
GeForce GTX 1050 Ti Max-Q:
64.8 fps
100%
GeForce GTX 1050 Ti Max-Q:
41 fps
100%
GeForce GTX 1050 Ti Max-Q:
37.5 fps
100%
GeForce GTX 1050 Ti Max-Q:
35.9 fps
100%
GeForce GTX 1050 Ti Max-Q:
11.3 fps
100%
GeForce GTX 1050 Ti Max-Q:
118.7 fps
100%
GeForce GTX 1050 Ti Max-Q:
46.3 fps
100%
GeForce GTX 1050 Ti Max-Q:
45 fps
100%
GeForce GTX 1050 Ti Max-Q:
37.5 fps
100%
GeForce GTX 1050 Ti Max-Q:
10.1 fps
100%
GeForce GTX 1050 Ti Max-Q:
67 fps
90%
Vega M GL / 870:
60 [X] Dell XPS 15 9575 FY00N Intel Core i7-8705G 3.1GHz
Vega M GL / 870
fps
100%
GeForce GTX 1050 Ti Max-Q:
43 fps
109%
Vega M GL / 870:
47 [X] Dell XPS 15 9575 FY00N Intel Core i7-8705G 3.1GHz
Vega M GL / 870
fps
100%
GeForce GTX 1050 Ti Max-Q:
34 fps
115%
Vega M GL / 870:
39 [X] Dell XPS 15 9575 FY00N Intel Core i7-8705G 3.1GHz
Vega M GL / 870
fps
100%
GeForce GTX 1050 Ti Max-Q:
18 fps
128%
Vega M GL / 870:
23 [X] Dell XPS 15 9575 FY00N Intel Core i7-8705G 3.1GHz
Vega M GL / 870
fps
Vega M GL / 870:
17 [X] Dell XPS 15 9575 FY00N Intel Core i7-8705G 3.1GHz
Vega M GL / 870
fps
100%
GeForce GTX 1050 Ti Max-Q:
7 fps
157%
Vega M GL / 870:
11 [X] Dell XPS 15 9575 FY00N Intel Core i7-8705G 3.1GHz
Vega M GL / 870
fps
100%
GeForce GTX 1050 Ti Max-Q:
122 fps
100%
GeForce GTX 1050 Ti Max-Q:
67 fps
100%
GeForce GTX 1050 Ti Max-Q:
61 fps
100%
GeForce GTX 1050 Ti Max-Q:
47 fps
100%
GeForce GTX 1050 Ti Max-Q:
20 fps
100%
GeForce GTX 1050 Ti Max-Q:
97 fps
74%
Vega M GL / 870:
72 [X] Dell XPS 15 9575 FY00N Intel Core i7-8705G 3.1GHz
Vega M GL / 870
fps
100%
GeForce GTX 1050 Ti Max-Q:
39 fps
105%
Vega M GL / 870:
41 [X] Dell XPS 15 9575 FY00N Intel Core i7-8705G 3.1GHz
Vega M GL / 870
fps
100%
GeForce GTX 1050 Ti Max-Q:
35 fps
103%
Vega M GL / 870:
36 [X] Dell XPS 15 9575 FY00N Intel Core i7-8705G 3.1GHz
Vega M GL / 870
fps
100%
GeForce GTX 1050 Ti Max-Q:
29 fps
103%
Vega M GL / 870:
30 [X] Dell XPS 15 9575 FY00N Intel Core i7-8705G 3.1GHz
Vega M GL / 870
fps
Vega M GL / 870:
19 [X] Dell XPS 15 9575 FY00N Intel Core i7-8705G 3.1GHz
Vega M GL / 870
fps
100%
GeForce GTX 1050 Ti Max-Q:
11 fps
82%
Vega M GL / 870:
9 [X] Dell XPS 15 9575 FY00N Intel Core i7-8705G 3.1GHz
Vega M GL / 870
fps
100%
GeForce GTX 1050 Ti Max-Q:
134 fps
100%
GeForce GTX 1050 Ti Max-Q:
80 fps
100%
GeForce GTX 1050 Ti Max-Q:
62 fps
100%
GeForce GTX 1050 Ti Max-Q:
38 fps
100%
GeForce GTX 1050 Ti Max-Q:
17 fps
100%
GeForce GTX 1050 Ti Max-Q:
100.3 fps
100%
GeForce GTX 1050 Ti Max-Q:
39.2 fps
100%
GeForce GTX 1050 Ti Max-Q:
34.9 fps
100%
GeForce GTX 1050 Ti Max-Q:
26.8 fps
100%
GeForce GTX 1050 Ti Max-Q:
8.3 fps
100%
GeForce GTX 1050 Ti Max-Q:
60 fps
100%
GeForce GTX 1050 Ti Max-Q:
49.1 fps
100%
GeForce GTX 1050 Ti Max-Q:
45.3 fps
100%
GeForce GTX 1050 Ti Max-Q:
42 fps
100%
GeForce GTX 1050 Ti Max-Q:
14 fps
100%
GeForce GTX 1050 Ti Max-Q:
76 91 91 ~ 86 fps
91%
Vega M GL / 870:
78 [X] Dell XPS 15 9575 FY00N Intel Core i7-8705G 3.1GHz
Vega M GL / 870
fps
100%
GeForce GTX 1050 Ti Max-Q:
45 48 48 ~ 47 fps
89%
Vega M GL / 870:
42 [X] Dell XPS 15 9575 FY00N Intel Core i7-8705G 3.1GHz
Vega M GL / 870
fps
100%
GeForce GTX 1050 Ti Max-Q:
41 44 44 ~ 43 fps
91%
Vega M GL / 870:
39 [X] Dell XPS 15 9575 FY00N Intel Core i7-8705G 3.1GHz
Vega M GL / 870
fps
100%
GeForce GTX 1050 Ti Max-Q:
38 38 41 ~ 39 fps
92%
Vega M GL / 870:
36 [X] Dell XPS 15 9575 FY00N Intel Core i7-8705G 3.1GHz
Vega M GL / 870
fps
Vega M GL / 870:
24 [X] Dell XPS 15 9575 FY00N Intel Core i7-8705G 3.1GHz
Vega M GL / 870
fps
100%
GeForce GTX 1050 Ti Max-Q:
13 13 14 ~ 13 fps
92%
Vega M GL / 870:
12 [X] Dell XPS 15 9575 FY00N Intel Core i7-8705G 3.1GHz
Vega M GL / 870
fps
Vega M GL / 870:
318.5 [X] Dell XPS 15 9575 FY00N Intel Core i7-8705G 3.1GHz
Vega M GL / 870
fps
Vega M GL / 870:
130.6 [X] Dell XPS 15 9575 FY00N Intel Core i7-8705G 3.1GHz
Vega M GL / 870
fps
Vega M GL / 870:
50.8 [X] Dell XPS 15 9575 FY00N Intel Core i7-8705G 3.1GHz
Vega M GL / 870
fps
Vega M GL / 870:
32.2 [X] Dell XPS 15 9575 FY00N Intel Core i7-8705G 3.1GHz
Vega M GL / 870
fps
Vega M GL / 870:
15.4 [X] Dell XPS 15 9575 FY00N Intel Core i7-8705G 3.1GHz
Vega M GL / 870
fps
100%
GeForce GTX 1050 Ti Max-Q:
92.7 fps
54%
Vega M GL / 870:
50.4 [X] Dell XPS 15 9575 FY00N Intel Core i7-8705G 3.1GHz
Vega M GL / 870
fps
100%
GeForce GTX 1050 Ti Max-Q:
80.3 fps
53%
Vega M GL / 870:
42.2 [X] Dell XPS 15 9575 FY00N Intel Core i7-8705G 3.1GHz
Vega M GL / 870
fps
100%
GeForce GTX 1050 Ti Max-Q:
69.4 fps
53%
Vega M GL / 870:
36.9 [X] Dell XPS 15 9575 FY00N Intel Core i7-8705G 3.1GHz
Vega M GL / 870
fps
100%
GeForce GTX 1050 Ti Max-Q:
39.5 fps
60%
Vega M GL / 870:
23.6 [X] Dell XPS 15 9575 FY00N Intel Core i7-8705G 3.1GHz
Vega M GL / 870
fps
GeForce GTX 1070 SLI (Desktop):
135 [X] AMD Ryzen 7 1800X 3.6GHz
GeForce GTX 1070 SLI (Desktop)
min:
94 fps, max:
170 fps
fps
GeForce GTX 1070 SLI (Desktop):
90.4 [X] AMD Ryzen 7 1800X 3.6GHz
GeForce GTX 1070 SLI (Desktop)
min:
69 fps, max:
102 fps
fps
GeForce GTX 1070 SLI (Desktop):
64.2 [X] AMD Ryzen 7 1800X 3.6GHz
GeForce GTX 1070 SLI (Desktop)
min:
11 fps, max:
85 fps
fps
GeForce GTX 1070 SLI (Desktop):
48.4 [X] AMD Ryzen 7 1800X 3.6GHz
GeForce GTX 1070 SLI (Desktop)
min:
36 fps, max:
59 fps
fps
GeForce GTX 1070 SLI (Desktop):
19.5 [X] AMD Ryzen 7 1800X 3.6GHz
GeForce GTX 1070 SLI (Desktop)
min:
15 fps, max:
23 fps
fps
100%
GeForce GTX 1050 Ti Max-Q:
61.5 75.1 ~ 68 fps
49%
Vega M GL / 870:
9 57.3 [X] Dell XPS 15 9575 FY00N Intel Core i7-8705G 3.1GHz
Vega M GL / 870
~ 33 fps
195%
GeForce GTX 1070 SLI (Desktop):
132.6 [X] AMD Ryzen 7 1800X 3.6GHz
GeForce GTX 1070 SLI (Desktop)
min:
90 fps, max:
175 fps
fps
100%
GeForce GTX 1050 Ti Max-Q:
36.6 37.7 ~ 37 fps
85%
Vega M GL / 870:
31.3 [X] Dell XPS 15 9575 FY00N Intel Core i7-8705G 3.1GHz
Vega M GL / 870
fps
224%
GeForce GTX 1070 SLI (Desktop):
82.8 [X] AMD Ryzen 7 1800X 3.6GHz
GeForce GTX 1070 SLI (Desktop)
min:
64 fps, max:
104 fps
fps
100%
GeForce GTX 1050 Ti Max-Q:
23.3 25 ~ 24 fps
86%
Vega M GL / 870:
20.7 [X] Dell XPS 15 9575 FY00N Intel Core i7-8705G 3.1GHz
Vega M GL / 870
fps
240%
GeForce GTX 1070 SLI (Desktop):
57.6 [X] AMD Ryzen 7 1800X 3.6GHz
GeForce GTX 1070 SLI (Desktop)
min:
41 fps, max:
85 fps
fps
100%
GeForce GTX 1050 Ti Max-Q:
9.2 fps
89%
Vega M GL / 870:
8.2 [X] Dell XPS 15 9575 FY00N Intel Core i7-8705G 3.1GHz
Vega M GL / 870
fps
268%
GeForce GTX 1070 SLI (Desktop):
24.7 [X] AMD Ryzen 7 1800X 3.6GHz
GeForce GTX 1070 SLI (Desktop)
min:
19 fps, max:
38 fps
fps
Vega M GL / 870:
126.9 [X] Dell XPS 15 9575 FY00N Intel Core i7-8705G 3.1GHz
Vega M GL / 870
fps
GeForce GTX 1070 SLI (Desktop):
425.5 [X] AMD Ryzen 7 1800X 3.6GHz
GeForce GTX 1070 SLI (Desktop)
min:
300 fps, max:
500 fps
fps
Vega M GL / 870:
86.2 [X] Dell XPS 15 9575 FY00N Intel Core i7-8705G 3.1GHz
Vega M GL / 870
fps
GeForce GTX 1070 SLI (Desktop):
279.5 [X] AMD Ryzen 7 1800X 3.6GHz
GeForce GTX 1070 SLI (Desktop)
min:
184 fps, max:
375 fps
fps
Vega M GL / 870:
55.7 [X] Dell XPS 15 9575 FY00N Intel Core i7-8705G 3.1GHz
Vega M GL / 870
fps
GeForce GTX 1070 SLI (Desktop):
175.5 [X] AMD Ryzen 7 1800X 3.6GHz
GeForce GTX 1070 SLI (Desktop)
min:
144 fps, max:
189 fps
fps
Vega M GL / 870:
37.9 [X] Dell XPS 15 9575 FY00N Intel Core i7-8705G 3.1GHz
Vega M GL / 870
fps
GeForce GTX 1070 SLI (Desktop):
123 [X] AMD Ryzen 7 1800X 3.6GHz
GeForce GTX 1070 SLI (Desktop)
min:
114 fps, max:
135 fps
fps
Vega M GL / 870:
24.2 [X] Dell XPS 15 9575 FY00N Intel Core i7-8705G 3.1GHz
Vega M GL / 870
fps
Vega M GL / 870:
8.8 [X] Dell XPS 15 9575 FY00N Intel Core i7-8705G 3.1GHz
Vega M GL / 870
fps
GeForce GTX 1070 SLI (Desktop):
37.5 [X] AMD Ryzen 7 1800X 3.6GHz
GeForce GTX 1070 SLI (Desktop)
min:
35 fps, max:
40 fps
fps
100%
GeForce GTX 1050 Ti Max-Q:
92.3 fps
174%
GeForce GTX 1070 SLI (Desktop):
160.8 [X] AMD Ryzen 7 1800X 3.6GHz
GeForce GTX 1070 SLI (Desktop)
min:
115 fps, max:
186 fps
fps
100%
GeForce GTX 1050 Ti Max-Q:
42 fps
347%
GeForce GTX 1070 SLI (Desktop):
145.7 [X] AMD Ryzen 7 1800X 3.6GHz
GeForce GTX 1070 SLI (Desktop)
min:
139 fps, max:
158 fps
fps
100%
GeForce GTX 1050 Ti Max-Q:
34.3 fps
378%
GeForce GTX 1070 SLI (Desktop):
129.5 [X] AMD Ryzen 7 1800X 3.6GHz
GeForce GTX 1070 SLI (Desktop)
min:
117 fps, max:
141 fps
fps
100%
GeForce GTX 1050 Ti Max-Q:
30.4 fps
394%
GeForce GTX 1070 SLI (Desktop):
119.9 [X] AMD Ryzen 7 1800X 3.6GHz
GeForce GTX 1070 SLI (Desktop)
min:
111 fps, max:
131 fps
fps
GeForce GTX 1070 SLI (Desktop):
58.1 [X] AMD Ryzen 7 1800X 3.6GHz
GeForce GTX 1070 SLI (Desktop)
min:
48 fps, max:
67 fps
fps
GeForce GTX 1070 SLI (Desktop):
140.7 [X] AMD Ryzen 7 1800X 3.6GHz
GeForce GTX 1070 SLI (Desktop)
min:
94 fps, max:
208 fps
fps
GeForce GTX 1070 SLI (Desktop):
118.2 [X] AMD Ryzen 7 1800X 3.6GHz
GeForce GTX 1070 SLI (Desktop)
min:
84 fps, max:
162 fps
fps
GeForce GTX 1070 SLI (Desktop):
109.4 [X] AMD Ryzen 7 1800X 3.6GHz
GeForce GTX 1070 SLI (Desktop)
min:
72 fps, max:
138 fps
fps
GeForce GTX 1070 SLI (Desktop):
108.1 [X] AMD Ryzen 7 1800X 3.6GHz
GeForce GTX 1070 SLI (Desktop)
min:
75 fps, max:
139 fps
fps
GeForce GTX 1070 SLI (Desktop):
40.9 [X] AMD Ryzen 7 1800X 3.6GHz
GeForce GTX 1070 SLI (Desktop)
min:
28 fps, max:
47 fps
fps
GeForce GTX 1070 SLI (Desktop):
187.5 [X] AMD Ryzen 7 1800X 3.6GHz
GeForce GTX 1070 SLI (Desktop)
fps
GeForce GTX 1070 SLI (Desktop):
125.1 [X] AMD Ryzen 7 1800X 3.6GHz
GeForce GTX 1070 SLI (Desktop)
fps
GeForce GTX 1070 SLI (Desktop):
109.2 [X] AMD Ryzen 7 1800X 3.6GHz
GeForce GTX 1070 SLI (Desktop)
fps
GeForce GTX 1070 SLI (Desktop):
101.7 [X] AMD Ryzen 7 1800X 3.6GHz
GeForce GTX 1070 SLI (Desktop)
fps
GeForce GTX 1070 SLI (Desktop):
40.7 [X] AMD Ryzen 7 1800X 3.6GHz
GeForce GTX 1070 SLI (Desktop)
fps
100%
GeForce GTX 1050 Ti Max-Q:
58 fps
129%
GeForce GTX 1070 SLI (Desktop):
75 [X] AMD Ryzen 7 1800X 3.6GHz
GeForce GTX 1070 SLI (Desktop)
fps
100%
GeForce GTX 1050 Ti Max-Q:
41 fps
176%
GeForce GTX 1070 SLI (Desktop):
72 [X] AMD Ryzen 7 1800X 3.6GHz
GeForce GTX 1070 SLI (Desktop)
fps
100%
GeForce GTX 1050 Ti Max-Q:
33 fps
212%
GeForce GTX 1070 SLI (Desktop):
70 [X] AMD Ryzen 7 1800X 3.6GHz
GeForce GTX 1070 SLI (Desktop)
fps
100%
GeForce GTX 1050 Ti Max-Q:
27 fps
226%
GeForce GTX 1070 SLI (Desktop):
61 [X] AMD Ryzen 7 1800X 3.6GHz
GeForce GTX 1070 SLI (Desktop)
fps
100%
GeForce GTX 1050 Ti Max-Q:
13 fps
238%
GeForce GTX 1070 SLI (Desktop):
31 [X] AMD Ryzen 7 1800X 3.6GHz
GeForce GTX 1070 SLI (Desktop)
fps
100%
GeForce GTX 1050 Ti Max-Q:
119.5 fps
101%
GeForce GTX 1070 SLI (Desktop):
121 [X] AMD Ryzen 7 1800X 3.6GHz
GeForce GTX 1070 SLI (Desktop)
fps
100%
GeForce GTX 1050 Ti Max-Q:
69.4 fps
171%
GeForce GTX 1070 SLI (Desktop):
119 [X] AMD Ryzen 7 1800X 3.6GHz
GeForce GTX 1070 SLI (Desktop)
fps
100%
GeForce GTX 1050 Ti Max-Q:
64.3 fps
193%
GeForce GTX 1070 SLI (Desktop):
124 [X] AMD Ryzen 7 1800X 3.6GHz
GeForce GTX 1070 SLI (Desktop)
fps
100%
GeForce GTX 1050 Ti Max-Q:
57.9 fps
209%
GeForce GTX 1070 SLI (Desktop):
120.9 [X] AMD Ryzen 7 1800X 3.6GHz
GeForce GTX 1070 SLI (Desktop)
fps
100%
GeForce GTX 1050 Ti Max-Q:
18.9 fps
307%
GeForce GTX 1070 SLI (Desktop):
58.1 [X] AMD Ryzen 7 1800X 3.6GHz
GeForce GTX 1070 SLI (Desktop)
fps
GeForce GTX 1070 SLI (Desktop):
120.5 [X] AMD Ryzen 7 1800X 3.6GHz
GeForce GTX 1070 SLI (Desktop)
min:
105 fps, max:
123 fps
fps
GeForce GTX 1070 SLI (Desktop):
120.2 [X] AMD Ryzen 7 1800X 3.6GHz
GeForce GTX 1070 SLI (Desktop)
min:
111 fps, max:
124 fps
fps
GeForce GTX 1070 SLI (Desktop):
101.4 [X] AMD Ryzen 7 1800X 3.6GHz
GeForce GTX 1070 SLI (Desktop)
min:
93 fps, max:
117 fps
fps
GeForce GTX 1070 SLI (Desktop):
79.8 [X] AMD Ryzen 7 1800X 3.6GHz
GeForce GTX 1070 SLI (Desktop)
min:
72 fps, max:
88 fps
fps
GeForce GTX 1070 SLI (Desktop):
26.1 [X] AMD Ryzen 7 1800X 3.6GHz
GeForce GTX 1070 SLI (Desktop)
min:
24 fps, max:
30 fps
fps
GeForce GTX 1070 SLI (Desktop):
93.7 [X] AMD Ryzen 7 1800X 3.6GHz
GeForce GTX 1070 SLI (Desktop)
min:
78 fps, max:
109 fps
fps
GeForce GTX 1070 SLI (Desktop):
65.7 [X] AMD Ryzen 7 1800X 3.6GHz
GeForce GTX 1070 SLI (Desktop)
min:
56 fps, max:
77 fps
fps
GeForce GTX 1070 SLI (Desktop):
59.1 [X] AMD Ryzen 7 1800X 3.6GHz
GeForce GTX 1070 SLI (Desktop)
min:
49 fps, max:
69 fps
fps
GeForce GTX 1070 SLI (Desktop):
57.7 [X] AMD Ryzen 7 1800X 3.6GHz
GeForce GTX 1070 SLI (Desktop)
min:
49 fps, max:
67 fps
fps
GeForce GTX 1070 SLI (Desktop):
24.4 [X] AMD Ryzen 7 1800X 3.6GHz
GeForce GTX 1070 SLI (Desktop)
min:
21 fps, max:
28 fps
fps
100%
GeForce GTX 1050 Ti Max-Q:
105 fps
106%
GeForce GTX 1070 SLI (Desktop):
111 [X] AMD Ryzen 7 1800X 3.6GHz
GeForce GTX 1070 SLI (Desktop)
min:
53 fps, max:
168 fps
fps
100%
GeForce GTX 1050 Ti Max-Q:
55 fps
173%
GeForce GTX 1070 SLI (Desktop):
95 [X] AMD Ryzen 7 1800X 3.6GHz
GeForce GTX 1070 SLI (Desktop)
min:
45 fps, max:
170 fps
fps
100%
GeForce GTX 1050 Ti Max-Q:
41 fps
198%
GeForce GTX 1070 SLI (Desktop):
81 [X] AMD Ryzen 7 1800X 3.6GHz
GeForce GTX 1070 SLI (Desktop)
min:
39 fps, max:
135 fps
fps
100%
GeForce GTX 1050 Ti Max-Q:
31 fps
216%
GeForce GTX 1070 SLI (Desktop):
67 [X] AMD Ryzen 7 1800X 3.6GHz
GeForce GTX 1070 SLI (Desktop)
min:
3 fps, max:
116 fps
fps
100%
GeForce GTX 1050 Ti Max-Q:
13 fps
346%
GeForce GTX 1070 SLI (Desktop):
45 [X] AMD Ryzen 7 1800X 3.6GHz
GeForce GTX 1070 SLI (Desktop)
min:
3 fps, max:
99 fps
fps
GeForce GTX 1070 SLI (Desktop):
344.6 [X] AMD Ryzen 7 1800X 3.6GHz
GeForce GTX 1070 SLI (Desktop)
min:
324 fps, max:
379 fps
fps
GeForce GTX 1070 SLI (Desktop):
331.3 [X] AMD Ryzen 7 1800X 3.6GHz
GeForce GTX 1070 SLI (Desktop)
min:
306 fps, max:
403 fps
fps
GeForce GTX 1070 SLI (Desktop):
310.6 [X] AMD Ryzen 7 1800X 3.6GHz
GeForce GTX 1070 SLI (Desktop)
min:
280 fps, max:
350 fps
fps
GeForce GTX 1070 SLI (Desktop):
305.4 [X] AMD Ryzen 7 1800X 3.6GHz
GeForce GTX 1070 SLI (Desktop)
min:
282 fps, max:
354 fps
fps
GeForce GTX 1070 SLI (Desktop):
187.6 [X] AMD Ryzen 7 1800X 3.6GHz
GeForce GTX 1070 SLI (Desktop)
min:
160 fps, max:
218 fps
fps
GeForce GTX 1070 SLI (Desktop):
121.4 [X] AMD Ryzen 7 1800X 3.6GHz
GeForce GTX 1070 SLI (Desktop)
min:
25 fps, max:
145 fps
fps
GeForce GTX 1070 SLI (Desktop):
85.2 [X] AMD Ryzen 7 1800X 3.6GHz
GeForce GTX 1070 SLI (Desktop)
min:
65 fps, max:
95 fps
fps
GeForce GTX 1070 SLI (Desktop):
81.6 [X] AMD Ryzen 7 1800X 3.6GHz
GeForce GTX 1070 SLI (Desktop)
min:
45 fps, max:
101 fps
fps
GeForce GTX 1070 SLI (Desktop):
62.1 [X] AMD Ryzen 7 1800X 3.6GHz
GeForce GTX 1070 SLI (Desktop)
min:
48 fps, max:
68 fps
fps
GeForce GTX 1070 SLI (Desktop):
26.7 [X] AMD Ryzen 7 1800X 3.6GHz
GeForce GTX 1070 SLI (Desktop)
min:
24 fps, max:
29 fps
fps
GeForce GTX 1070 SLI (Desktop):
221 [X] AMD Ryzen 7 1800X 3.6GHz
GeForce GTX 1070 SLI (Desktop)
min:
174 fps, max:
252 fps
fps
GeForce GTX 1070 SLI (Desktop):
190 [X] AMD Ryzen 7 1800X 3.6GHz
GeForce GTX 1070 SLI (Desktop)
min:
142 fps, max:
223 fps
fps
GeForce GTX 1070 SLI (Desktop):
168 [X] AMD Ryzen 7 1800X 3.6GHz
GeForce GTX 1070 SLI (Desktop)
min:
137 fps, max:
195 fps
fps
GeForce GTX 1070 SLI (Desktop):
109 [X] AMD Ryzen 7 1800X 3.6GHz
GeForce GTX 1070 SLI (Desktop)
min:
90 fps, max:
131 fps
fps
GeForce GTX 1070 SLI (Desktop):
68 [X] AMD Ryzen 7 1800X 3.6GHz
GeForce GTX 1070 SLI (Desktop)
min:
60 fps, max:
77 fps
fps
100%
GeForce GTX 1050 Ti Max-Q:
129.8 fps
100%
GeForce GTX 1050 Ti Max-Q:
123.6 fps
100%
GeForce GTX 1050 Ti Max-Q:
115.7 fps
100%
GeForce GTX 1050 Ti Max-Q:
112.6 fps
100%
GeForce GTX 1050 Ti Max-Q:
65.2 fps
100%
GeForce GTX 1050 Ti Max-Q:
249.1 fps
100%
Vega M GL / 870:
248.2 [X] Dell XPS 15 9575 FY00N Intel Core i7-8705G 3.1GHz
Vega M GL / 870
fps
100%
GeForce GTX 1050 Ti Max-Q:
169.1 fps
95%
Vega M GL / 870:
159.8 [X] Dell XPS 15 9575 FY00N Intel Core i7-8705G 3.1GHz
Vega M GL / 870
fps
100%
GeForce GTX 1050 Ti Max-Q:
112.5 fps
88%
Vega M GL / 870:
99.1 [X] Dell XPS 15 9575 FY00N Intel Core i7-8705G 3.1GHz
Vega M GL / 870
fps
Vega M GL / 870:
61.6 [X] Dell XPS 15 9575 FY00N Intel Core i7-8705G 3.1GHz
Vega M GL / 870
fps
100%
GeForce GTX 1050 Ti Max-Q:
42.3 fps
70%
Vega M GL / 870:
29.6 [X] Dell XPS 15 9575 FY00N Intel Core i7-8705G 3.1GHz
Vega M GL / 870
fps
100%
GeForce GTX 1050 Ti Max-Q:
142.4 fps
95%
Vega M GL / 870:
135 fps
100%
GeForce GTX 1050 Ti Max-Q:
85.6 fps
101%
Vega M GL / 870:
86.6 fps
100%
GeForce GTX 1050 Ti Max-Q:
68.3 fps
101%
Vega M GL / 870:
69.1 fps
100%
GeForce GTX 1050 Ti Max-Q:
58.9 fps
104%
Vega M GL / 870:
61 fps
100%
GeForce GTX 1050 Ti Max-Q:
21.7 fps
100%
GeForce GTX 1050 Ti Max-Q:
68.6 96.7 ~ 83 fps
193%
GeForce GTX 1070 SLI (Desktop):
160.2 [X] AMD Ryzen 7 1800X 3.6GHz
GeForce GTX 1070 SLI (Desktop)
min:
142.6 fps, max:
180.3 fps
fps
283%
GeForce GTX 1070 SLI (Desktop):
121.9 [X] AMD Ryzen 7 1800X 3.6GHz
GeForce GTX 1070 SLI (Desktop)
min:
109.9 fps, max:
136 fps
fps
100%
GeForce GTX 1050 Ti Max-Q:
35.3 40 41.9 ~ 39 fps
280%
GeForce GTX 1070 SLI (Desktop):
109.1 [X] AMD Ryzen 7 1800X 3.6GHz
GeForce GTX 1070 SLI (Desktop)
min:
98 fps, max:
124.9 fps
fps
315%
GeForce GTX 1070 SLI (Desktop):
69.4 [X] AMD Ryzen 7 1800X 3.6GHz
GeForce GTX 1070 SLI (Desktop)
min:
61.5 fps, max:
77.6 fps
fps
100%
GeForce GTX 1050 Ti Max-Q:
13.9 14.5 ~ 14 fps
410%
GeForce GTX 1070 SLI (Desktop):
57.4 [X] AMD Ryzen 7 1800X 3.6GHz
GeForce GTX 1070 SLI (Desktop)
min:
48.7 fps, max:
65.4 fps
fps
100%
GeForce GTX 1050 Ti Max-Q:
113.6 179.3 ~ 146 fps
153%
GeForce GTX 1070 SLI (Desktop):
223.2 [X] AMD Ryzen 7 1800X 3.6GHz
GeForce GTX 1070 SLI (Desktop)
min:
47.9 fps, max:
263.6 fps
fps
100%
GeForce GTX 1050 Ti Max-Q:
63.8 68.2 ~ 66 fps
270%
GeForce GTX 1070 SLI (Desktop):
178.4 [X] AMD Ryzen 7 1800X 3.6GHz
GeForce GTX 1070 SLI (Desktop)
min:
47.2 fps, max:
223 fps
fps
100%
GeForce GTX 1050 Ti Max-Q:
64.9 65.5 ~ 65 fps
267%
GeForce GTX 1070 SLI (Desktop):
173.3 [X] AMD Ryzen 7 1800X 3.6GHz
GeForce GTX 1070 SLI (Desktop)
min:
46.7 fps, max:
219.2 fps
fps
100%
GeForce GTX 1050 Ti Max-Q:
49.5 50.4 ~ 50 fps
304%
GeForce GTX 1070 SLI (Desktop):
151.8 [X] AMD Ryzen 7 1800X 3.6GHz
GeForce GTX 1070 SLI (Desktop)
min:
46.9 fps, max:
196.8 fps
fps
100%
GeForce GTX 1050 Ti Max-Q:
19.2 19.2 ~ 19 fps
459%
GeForce GTX 1070 SLI (Desktop):
87.3 [X] AMD Ryzen 7 1800X 3.6GHz
GeForce GTX 1070 SLI (Desktop)
min:
24.5 fps, max:
117.7 fps
fps
GeForce GTX 1070 SLI (Desktop):
282.2 [X] AMD Ryzen 7 1800X 3.6GHz
GeForce GTX 1070 SLI (Desktop)
min:
236 fps, max:
347 fps
fps
GeForce GTX 1070 SLI (Desktop):
233.4 [X] AMD Ryzen 7 1800X 3.6GHz
GeForce GTX 1070 SLI (Desktop)
min:
171 fps, max:
311 fps
fps
GeForce GTX 1070 SLI (Desktop):
174.8 [X] AMD Ryzen 7 1800X 3.6GHz
GeForce GTX 1070 SLI (Desktop)
min:
141 fps, max:
206 fps
fps
GeForce GTX 1070 SLI (Desktop):
155.7 [X] AMD Ryzen 7 1800X 3.6GHz
GeForce GTX 1070 SLI (Desktop)
min:
131 fps, max:
194 fps
fps
GeForce GTX 1070 SLI (Desktop):
52.7 [X] AMD Ryzen 7 1800X 3.6GHz
GeForce GTX 1070 SLI (Desktop)
min:
43 fps, max:
62 fps
fps
GeForce GTX 1070 SLI (Desktop):
120.7 [X] AMD Ryzen 7 1800X 3.6GHz
GeForce GTX 1070 SLI (Desktop)
fps
GeForce GTX 1070 SLI (Desktop):
112 [X] AMD Ryzen 7 1800X 3.6GHz
GeForce GTX 1070 SLI (Desktop)
fps
GeForce GTX 1070 SLI (Desktop):
103.2 [X] AMD Ryzen 7 1800X 3.6GHz
GeForce GTX 1070 SLI (Desktop)
fps
GeForce GTX 1070 SLI (Desktop):
89.1 [X] AMD Ryzen 7 1800X 3.6GHz
GeForce GTX 1070 SLI (Desktop)
fps
GeForce GTX 1070 SLI (Desktop):
60.4 [X] AMD Ryzen 7 1800X 3.6GHz
GeForce GTX 1070 SLI (Desktop)
fps
GeForce GTX 1070 SLI (Desktop):
108.9 [X] AMD Ryzen 7 1800X 3.6GHz
GeForce GTX 1070 SLI (Desktop)
min:
91 fps, max:
120 fps
fps
GeForce GTX 1070 SLI (Desktop):
104.9 [X] AMD Ryzen 7 1800X 3.6GHz
GeForce GTX 1070 SLI (Desktop)
min:
78 fps, max:
120 fps
fps
GeForce GTX 1070 SLI (Desktop):
101 [X] AMD Ryzen 7 1800X 3.6GHz
GeForce GTX 1070 SLI (Desktop)
min:
50 fps, max:
120 fps
fps
GeForce GTX 1070 SLI (Desktop):
80.9 [X] AMD Ryzen 7 1800X 3.6GHz
GeForce GTX 1070 SLI (Desktop)
min:
60 fps, max:
120 fps
fps
GeForce GTX 1070 SLI (Desktop):
62 [X] AMD Ryzen 7 1800X 3.6GHz
GeForce GTX 1070 SLI (Desktop)
min:
42 fps, max:
77 fps
fps
100%
GeForce GTX 1050 Ti Max-Q:
137.3 fps
100%
GeForce GTX 1050 Ti Max-Q:
104.6 fps
100%
GeForce GTX 1050 Ti Max-Q:
89.5 154.8 ~ 122 fps
152%
GeForce GTX 1070 SLI (Desktop):
185.3 [X] AMD Ryzen 7 1800X 3.6GHz
GeForce GTX 1070 SLI (Desktop)
min:
176 fps, max:
200 fps
fps
100%
GeForce GTX 1050 Ti Max-Q:
85.2 120 ~ 103 fps
160%
GeForce GTX 1070 SLI (Desktop):
165.3 [X] AMD Ryzen 7 1800X 3.6GHz
GeForce GTX 1070 SLI (Desktop)
min:
155 fps, max:
183 fps
fps
100%
GeForce GTX 1050 Ti Max-Q:
51.7 58.1 ~ 55 fps
273%
GeForce GTX 1070 SLI (Desktop):
149.9 [X] AMD Ryzen 7 1800X 3.6GHz
GeForce GTX 1070 SLI (Desktop)
min:
141 fps, max:
159 fps
fps
100%
GeForce GTX 1050 Ti Max-Q:
49.8 53.1 ~ 51 fps
272%
GeForce GTX 1070 SLI (Desktop):
138.9 [X] AMD Ryzen 7 1800X 3.6GHz
GeForce GTX 1070 SLI (Desktop)
min:
131 fps, max:
162 fps
fps
100%
GeForce GTX 1050 Ti Max-Q:
20.7 21.1 ~ 21 fps
322%
GeForce GTX 1070 SLI (Desktop):
67.7 [X] AMD Ryzen 7 1800X 3.6GHz
GeForce GTX 1070 SLI (Desktop)
min:
65 fps, max:
73 fps
fps
100%
GeForce GTX 1050 Ti Max-Q:
112.5 fps
100%
GeForce GTX 1050 Ti Max-Q:
85.8 fps
100%
GeForce GTX 1050 Ti Max-Q:
51 fps
100%
GeForce GTX 1050 Ti Max-Q:
43 fps
GeForce GTX 1070 SLI (Desktop):
79.2 [X] AMD Ryzen 7 1800X 3.6GHz
GeForce GTX 1070 SLI (Desktop)
min:
62 fps, max:
135 fps
fps
GeForce GTX 1070 SLI (Desktop):
77.3 [X] AMD Ryzen 7 1800X 3.6GHz
GeForce GTX 1070 SLI (Desktop)
min:
58 fps, max:
134 fps
fps
GeForce GTX 1070 SLI (Desktop):
69.3 [X] AMD Ryzen 7 1800X 3.6GHz
GeForce GTX 1070 SLI (Desktop)
min:
51 fps, max:
115 fps
fps
GeForce GTX 1070 SLI (Desktop):
66.5 [X] AMD Ryzen 7 1800X 3.6GHz
GeForce GTX 1070 SLI (Desktop)
min:
40 fps, max:
108 fps
fps
GeForce GTX 1070 SLI (Desktop):
47.9 [X] AMD Ryzen 7 1800X 3.6GHz
GeForce GTX 1070 SLI (Desktop)
min:
38 fps, max:
59 fps
fps
100%
GeForce GTX 1050 Ti Max-Q:
285.4 fps
100%
GeForce GTX 1050 Ti Max-Q:
233.9 fps
79%
Vega M GL / 870:
184.3 fps
100%
GeForce GTX 1050 Ti Max-Q:
117.7 fps
92%
Vega M GL / 870:
108.2 fps
100%
GeForce GTX 1050 Ti Max-Q:
70.5 fps
71%
Vega M GL / 870:
50 fps
100%
GeForce GTX 1050 Ti Max-Q:
37 fps
100%
GeForce GTX 1050 Ti Max-Q:
63 fps
89%
Vega M GL / 870:
54.1 54.9 58.7 [X] Dell XPS 15 9575 FY00N Intel Core i7-8705G 3.1GHz
Vega M GL / 870
~ 56 fps
100%
GeForce GTX 1050 Ti Max-Q:
41.3 fps
90%
Vega M GL / 870:
36.4 37 38.4 [X] Dell XPS 15 9575 FY00N Intel Core i7-8705G 3.1GHz
Vega M GL / 870
~ 37 fps
100%
GeForce GTX 1050 Ti Max-Q:
35.8 fps
92%
Vega M GL / 870:
32.3 32.5 [X] Dell XPS 15 9575 FY00N Intel Core i7-8705G 3.1GHz
Vega M GL / 870
32.7 ~ 33 fps
100%
GeForce GTX 1050 Ti Max-Q:
15.7 fps
100%
GeForce GTX 1050 Ti Max-Q:
114.2 137.2 ~ 126 fps
159%
GeForce GTX 1070 SLI (Desktop):
200.7 [X] AMD Ryzen 7 1800X 3.6GHz
GeForce GTX 1070 SLI (Desktop)
fps
100%
GeForce GTX 1050 Ti Max-Q:
83.4 89.5 ~ 86 fps
198%
GeForce GTX 1070 SLI (Desktop):
170 [X] AMD Ryzen 7 1800X 3.6GHz
GeForce GTX 1070 SLI (Desktop)
fps
100%
GeForce GTX 1050 Ti Max-Q:
41.9 42.5 ~ 42 fps
314%
GeForce GTX 1070 SLI (Desktop):
131.8 [X] AMD Ryzen 7 1800X 3.6GHz
GeForce GTX 1070 SLI (Desktop)
fps
100%
GeForce GTX 1050 Ti Max-Q:
32.2 34.8 ~ 34 fps
346%
GeForce GTX 1070 SLI (Desktop):
117.7 [X] AMD Ryzen 7 1800X 3.6GHz
GeForce GTX 1070 SLI (Desktop)
fps
100%
GeForce GTX 1050 Ti Max-Q:
14.6 15.7 ~ 15 fps
443%
GeForce GTX 1070 SLI (Desktop):
66.4 [X] AMD Ryzen 7 1800X 3.6GHz
GeForce GTX 1070 SLI (Desktop)
fps
GeForce GTX 1070 SLI (Desktop):
72 [X] AMD Ryzen 7 1800X 3.6GHz
GeForce GTX 1070 SLI (Desktop)
min:
59 fps, max:
85 fps
fps
GeForce GTX 1070 SLI (Desktop):
66 [X] AMD Ryzen 7 1800X 3.6GHz
GeForce GTX 1070 SLI (Desktop)
min:
53 fps, max:
82 fps
fps
GeForce GTX 1070 SLI (Desktop):
61 [X] AMD Ryzen 7 1800X 3.6GHz
GeForce GTX 1070 SLI (Desktop)
min:
51 fps, max:
74 fps
fps
GeForce GTX 1070 SLI (Desktop):
58 [X] AMD Ryzen 7 1800X 3.6GHz
GeForce GTX 1070 SLI (Desktop)
min:
44 fps, max:
68 fps
fps
GeForce GTX 1070 SLI (Desktop):
64 [X] AMD Ryzen 7 1800X 3.6GHz
GeForce GTX 1070 SLI (Desktop)
min:
50 fps, max:
72 fps
fps
165%
GeForce GTX 1070 SLI (Desktop):
205.7 [X] AMD Ryzen 7 1800X 3.6GHz
GeForce GTX 1070 SLI (Desktop)
min:
193 fps, max:
215 fps
fps
209%
GeForce GTX 1070 SLI (Desktop):
161 [X] AMD Ryzen 7 1800X 3.6GHz
GeForce GTX 1070 SLI (Desktop)
min:
155 fps, max:
167 fps
fps
316%
GeForce GTX 1070 SLI (Desktop):
142.1 [X] AMD Ryzen 7 1800X 3.6GHz
GeForce GTX 1070 SLI (Desktop)
min:
136 fps, max:
149 fps
fps
366%
GeForce GTX 1070 SLI (Desktop):
139.2 [X] AMD Ryzen 7 1800X 3.6GHz
GeForce GTX 1070 SLI (Desktop)
min:
133 fps, max:
150 fps
fps
100%
GeForce GTX 1050 Ti Max-Q:
16.8 17.1 ~ 17 fps
76%
Vega M GL / 870:
12 14.3 ~ 13 fps
435%
GeForce GTX 1070 SLI (Desktop):
74 [X] AMD Ryzen 7 1800X 3.6GHz
GeForce GTX 1070 SLI (Desktop)
min:
66 fps, max:
88 fps
fps
100%
GeForce GTX 1050 Ti Max-Q:
236.6 263.6 ~ 250 fps
72%
Vega M GL / 870:
180.9 [X] Dell XPS 15 9575 FY00N Intel Core i7-8705G 3.1GHz
Vega M GL / 870
fps
97%
GeForce GTX 1070 SLI (Desktop):
243.4 [X] AMD Ryzen 7 1800X 3.6GHz
GeForce GTX 1070 SLI (Desktop)
min:
112.4 fps, max:
379.8 fps
fps
100%
GeForce GTX 1050 Ti Max-Q:
154.6 162.2 ~ 158 fps
95%
Vega M GL / 870:
149.4 [X] Dell XPS 15 9575 FY00N Intel Core i7-8705G 3.1GHz
Vega M GL / 870
fps
124%
GeForce GTX 1070 SLI (Desktop):
196 [X] AMD Ryzen 7 1800X 3.6GHz
GeForce GTX 1070 SLI (Desktop)
min:
77 fps, max:
302 fps
fps
100%
GeForce GTX 1050 Ti Max-Q:
90.2 92.7 ~ 91 fps
107%
Vega M GL / 870:
97 [X] Dell XPS 15 9575 FY00N Intel Core i7-8705G 3.1GHz
Vega M GL / 870
fps
175%
GeForce GTX 1070 SLI (Desktop):
159.6 [X] AMD Ryzen 7 1800X 3.6GHz
GeForce GTX 1070 SLI (Desktop)
min:
68 fps, max:
245 fps
fps
100%
GeForce GTX 1050 Ti Max-Q:
62.5 67.5 ~ 65 fps
124%
Vega M GL / 870:
80.5 [X] Dell XPS 15 9575 FY00N Intel Core i7-8705G 3.1GHz
Vega M GL / 870
fps
217%
GeForce GTX 1070 SLI (Desktop):
141.1 [X] AMD Ryzen 7 1800X 3.6GHz
GeForce GTX 1070 SLI (Desktop)
min:
84.4 fps, max:
211.8 fps
fps
100%
GeForce GTX 1050 Ti Max-Q:
27.7 29.3 ~ 29 fps
106%
Vega M GL / 870:
30.8 [X] Dell XPS 15 9575 FY00N Intel Core i7-8705G 3.1GHz
Vega M GL / 870
fps
183%
GeForce GTX 1070 SLI (Desktop):
53 [X] AMD Ryzen 7 1800X 3.6GHz
GeForce GTX 1070 SLI (Desktop)
min:
40.1 fps, max:
73.3 fps
fps
100%
GeForce GTX 1050 Ti Max-Q:
168.6 fps
100%
GeForce GTX 1050 Ti Max-Q:
143.9 fps
100%
GeForce GTX 1050 Ti Max-Q:
112.7 fps
100%
GeForce GTX 1050 Ti Max-Q:
101 fps
100%
GeForce GTX 1050 Ti Max-Q:
34.4 fps
100%
GeForce GTX 1050 Ti Max-Q:
111.9 fps
100%
GeForce GTX 1050 Ti Max-Q:
104.2 fps
100%
GeForce GTX 1050 Ti Max-Q:
98.1 fps
100%
GeForce GTX 1050 Ti Max-Q:
93.5 fps
100%
GeForce GTX 1050 Ti Max-Q:
46 fps
Vega M GL / 870:
108 111 118 [X] Dell XPS 15 9575 FY00N Intel Core i7-8705G 3.1GHz
Vega M GL / 870
~ 112 fps
Vega M GL / 870:
95 97 107 [X] Dell XPS 15 9575 FY00N Intel Core i7-8705G 3.1GHz
Vega M GL / 870
~ 100 fps
Vega M GL / 870:
53 54 55 [X] Dell XPS 15 9575 FY00N Intel Core i7-8705G 3.1GHz
Vega M GL / 870
~ 54 fps
Vega M GL / 870:
16 16 [X] Dell XPS 15 9575 FY00N Intel Core i7-8705G 3.1GHz
Vega M GL / 870
~ 16 fps
88%
Vega M GL / 870:
116.6 fps
128%
GeForce GTX 1070 SLI (Desktop):
170.4 [X] AMD Ryzen 7 1800X 3.6GHz
GeForce GTX 1070 SLI (Desktop)
min:
46 fps, max:
206 fps
fps
160%
GeForce GTX 1070 SLI (Desktop):
132.4 [X] AMD Ryzen 7 1800X 3.6GHz
GeForce GTX 1070 SLI (Desktop)
min:
32 fps, max:
155 fps
fps
232%
GeForce GTX 1070 SLI (Desktop):
111.2 [X] AMD Ryzen 7 1800X 3.6GHz
GeForce GTX 1070 SLI (Desktop)
min:
28 fps, max:
133 fps
fps
261%
GeForce GTX 1070 SLI (Desktop):
73.1 [X] AMD Ryzen 7 1800X 3.6GHz
GeForce GTX 1070 SLI (Desktop)
min:
14 fps, max:
91 fps
fps
88%
Vega M GL / 870:
13 14.4 ~ 14 fps
340%
GeForce GTX 1070 SLI (Desktop):
54.4 [X] AMD Ryzen 7 1800X 3.6GHz
GeForce GTX 1070 SLI (Desktop)
min:
24 fps, max:
65 fps
fps
100%
GeForce GTX 1050 Ti Max-Q:
150.4 fps
92%
Vega M GL / 870:
138.7 [X] Dell XPS 15 9575 FY00N Intel Core i7-8705G 3.1GHz
Vega M GL / 870
fps
84%
GeForce GTX 1070 SLI (Desktop):
125.9 [X] AMD Ryzen 7 1800X 3.6GHz
GeForce GTX 1070 SLI (Desktop)
fps
100%
GeForce GTX 1050 Ti Max-Q:
143.3 fps
91%
Vega M GL / 870:
130.8 [X] Dell XPS 15 9575 FY00N Intel Core i7-8705G 3.1GHz
Vega M GL / 870
fps
80%
GeForce GTX 1070 SLI (Desktop):
114.6 [X] AMD Ryzen 7 1800X 3.6GHz
GeForce GTX 1070 SLI (Desktop)
fps
100%
GeForce GTX 1050 Ti Max-Q:
78.9 fps
74%
Vega M GL / 870:
58.1 [X] Dell XPS 15 9575 FY00N Intel Core i7-8705G 3.1GHz
Vega M GL / 870
fps
112%
GeForce GTX 1070 SLI (Desktop):
88.7 [X] AMD Ryzen 7 1800X 3.6GHz
GeForce GTX 1070 SLI (Desktop)
fps
100%
GeForce GTX 1050 Ti Max-Q:
34.5 fps
70%
Vega M GL / 870:
24 [X] Dell XPS 15 9575 FY00N Intel Core i7-8705G 3.1GHz
Vega M GL / 870
fps
250%
GeForce GTX 1070 SLI (Desktop):
86.1 [X] AMD Ryzen 7 1800X 3.6GHz
GeForce GTX 1070 SLI (Desktop)
fps
100%
GeForce GTX 1050 Ti Max-Q:
35.5 fps
81%
Vega M GL / 870:
28.8 [X] Dell XPS 15 9575 FY00N Intel Core i7-8705G 3.1GHz
Vega M GL / 870
fps
229%
GeForce GTX 1070 SLI (Desktop):
81.3 [X] AMD Ryzen 7 1800X 3.6GHz
GeForce GTX 1070 SLI (Desktop)
fps
Vega M GL / 870:
105.8 fps
99%
GeForce GTX 1070 SLI (Desktop):
276.9 [X] AMD Ryzen 7 1800X 3.6GHz
GeForce GTX 1070 SLI (Desktop)
fps
118%
GeForce GTX 1070 SLI (Desktop):
242.9 [X] AMD Ryzen 7 1800X 3.6GHz
GeForce GTX 1070 SLI (Desktop)
fps
86%
Vega M GL / 870:
148 152 157 161 166.7 [X] Dell XPS 15 9575 FY00N Intel Core i7-8705G 3.1GHz
Vega M GL / 870
~ 157 fps
128%
GeForce GTX 1070 SLI (Desktop):
233.4 [X] AMD Ryzen 7 1800X 3.6GHz
GeForce GTX 1070 SLI (Desktop)
fps
75%
Vega M GL / 870:
51.7 51.7 52.5 59.8 60.2 [X] Dell XPS 15 9575 FY00N Intel Core i7-8705G 3.1GHz
Vega M GL / 870
~ 55 fps
273%
GeForce GTX 1070 SLI (Desktop):
199.5 [X] AMD Ryzen 7 1800X 3.6GHz
GeForce GTX 1070 SLI (Desktop)
fps
100%
GeForce GTX 1050 Ti Max-Q:
228.2 fps
100%
GeForce GTX 1050 Ti Max-Q:
202.6 fps
100%
GeForce GTX 1050 Ti Max-Q:
202.1 fps
100%
GeForce GTX 1050 Ti Max-Q:
170.1 fps
100%
GeForce GTX 1050 Ti Max-Q:
433.4 fps
100%
GeForce GTX 1050 Ti Max-Q:
200.4 fps
100%
GeForce GTX 1050 Ti Max-Q:
186.7 fps
100%
GeForce GTX 1050 Ti Max-Q:
126.7 fps
Average Gaming NVIDIA GeForce GTX 1050 Ti Max-Q → 100% Average Gaming 30-70 fps → 100%
Average Gaming AMD Radeon RX Vega M GL / 870 → 91% Average Gaming 30-70 fps → 90%
Average Gaming NVIDIA GeForce GTX 1070 SLI (Desktop) → 232% Average Gaming 30-70 fps → 299%
 Deutsch
 English
 Español
 Français
 Italiano
 Nederlands
 Polski
 Português
 Русский
 Türkçe
 Svenska
 Chinese
 Magyar