Intel Iris Plus Graphics 655 vs NVIDIA GeForce RTX 3050 6GB Laptop GPU vs Intel Iris Plus Graphics 640
Intel Iris Plus Graphics 655 ► remove from comparison
Die Intel Iris Plus Graphics 655 (GT3e) ist eine Prozessorgrafikkarte, die im September 2017 vorgestellt wurde. Es handelt sich um den Nachfolger der Iris Plus 650 Graphics und wird in Coffee-Lake-U-CPUs der 28-Watt-Klasse verbaut. Der größte Unterschied zum Vorgänger ist der doppelt so große eDRAM-Cache mit 128 MB. Ansonsten dürfte es aber keine großen Unterschiede geben.
Die sogenannte GT3e-Ausbaustufe der Kaby-Lake-GPU verfügt weiterhin über 48 Execution Units (EUs), die je nach Modell nun mit bis zu 1.200 MHz takten (vorher max. 1.100 MHz). Neben dem eDRAM-Cache kann die Iris 655 auch über das Interface des Prozessors auf den Hauptspeicher zugreifen (2x 64 Bit LPDDR3-2133/DDR4-2400).
Von der Iris Plus 640 der 15-Watt-Modelle unterscheidet sich die Iris 655 lediglich durch ihren etwas höheren Maximaltakt sowie die annähernd verdoppelte TDP, die eine bessere Ausnutzung des Turbo-Boost-Spielraumes erlaubt.
Performance
Die exakte Leistung der Iris Plus Graphics 655 hängt vom jeweiligen CPU-Modell ab, da sich die Maximaltaktrate sowie die Größe des Caches leicht unterscheiden können. Zum anderen beeinflusst auch der verwendete Speicher (DDR3/DDR4) die Performance.
Die höchste Leistung erreichen hochtaktende Core-i7-Ableger wie der Core i7-8559U. Je nach Spiel ordnet sich die Iris Plus 655 vermutlich im Bereich einer dedizierten GeForce 930M oder GeForce 940MX ein und kann aktuelle Titel in niedrigen bis mittleren Einstellungen flüssig darstellen.
Features
Die überarbeitete Videoeinheit dekodiert H.265-/HEVC-Videos vollständig in Hardware. Anders als Skylake kann Kaby Lake nun auch H.265/HEVC im Main10-Profil mit 10 Bit Farbtiefe sowie Googles VP9-Codec in Hardware dekodieren. Die Bildausgabe erfolgt über DP 1.2/eDP 1.3 (max. 3.840 x 2.160 @ 60 Hz), wohingegen HDMI nur in der älteren Version 1.4a angeboten wird. Ein HDMI-2.0-Anschluss kann aber mittels Konverter von DisplayPort ergänzt werden. Maximal lassen sich drei Displays parallel angesteuern.
Leistungsaufnahme
Die Iris Plus Graphics 655 ist in den Prozessoren der 28-Watt-Klasse zu finden und damit für kleine/mittelgroße Laptops geeignet.
NVIDIA GeForce RTX 3050 6GB Laptop GPU ► remove from comparison
Die Nvidia GeForce RTX 3050 6 GB Laptop GPU (oder Mobile, NVIDIA_DEV.2583, GN20-P0-R 6GB, 3050 Refresh) ist der Refresh der RTX 3050 mit 4GB und bietet neben dem größeren Grafikspeicher auch mehr Shader (2.560 Kerne = +25% wie die RTX 3050 Ti ). Dafür wurde der Speicherbus von 128 Bit auf 96 Bit reduziert.
Wie üblich wird es verschiedene Varianten mit einem TGP von 35 - 50 (ehemals Max-Q) und 60 - 80 Watt geben. Diese takten von 713 - 1530 (Basistakt) bis 1058 - 1740 (Boost) und bieten dementsprechend eine unterschiedliche Performance.
Die durchschnittliche Leistung sollte etwas oberhalb der alten RTX 3050 (4GB) Laptop GPU liegen und knapp hinter der RTX 3050 Ti .
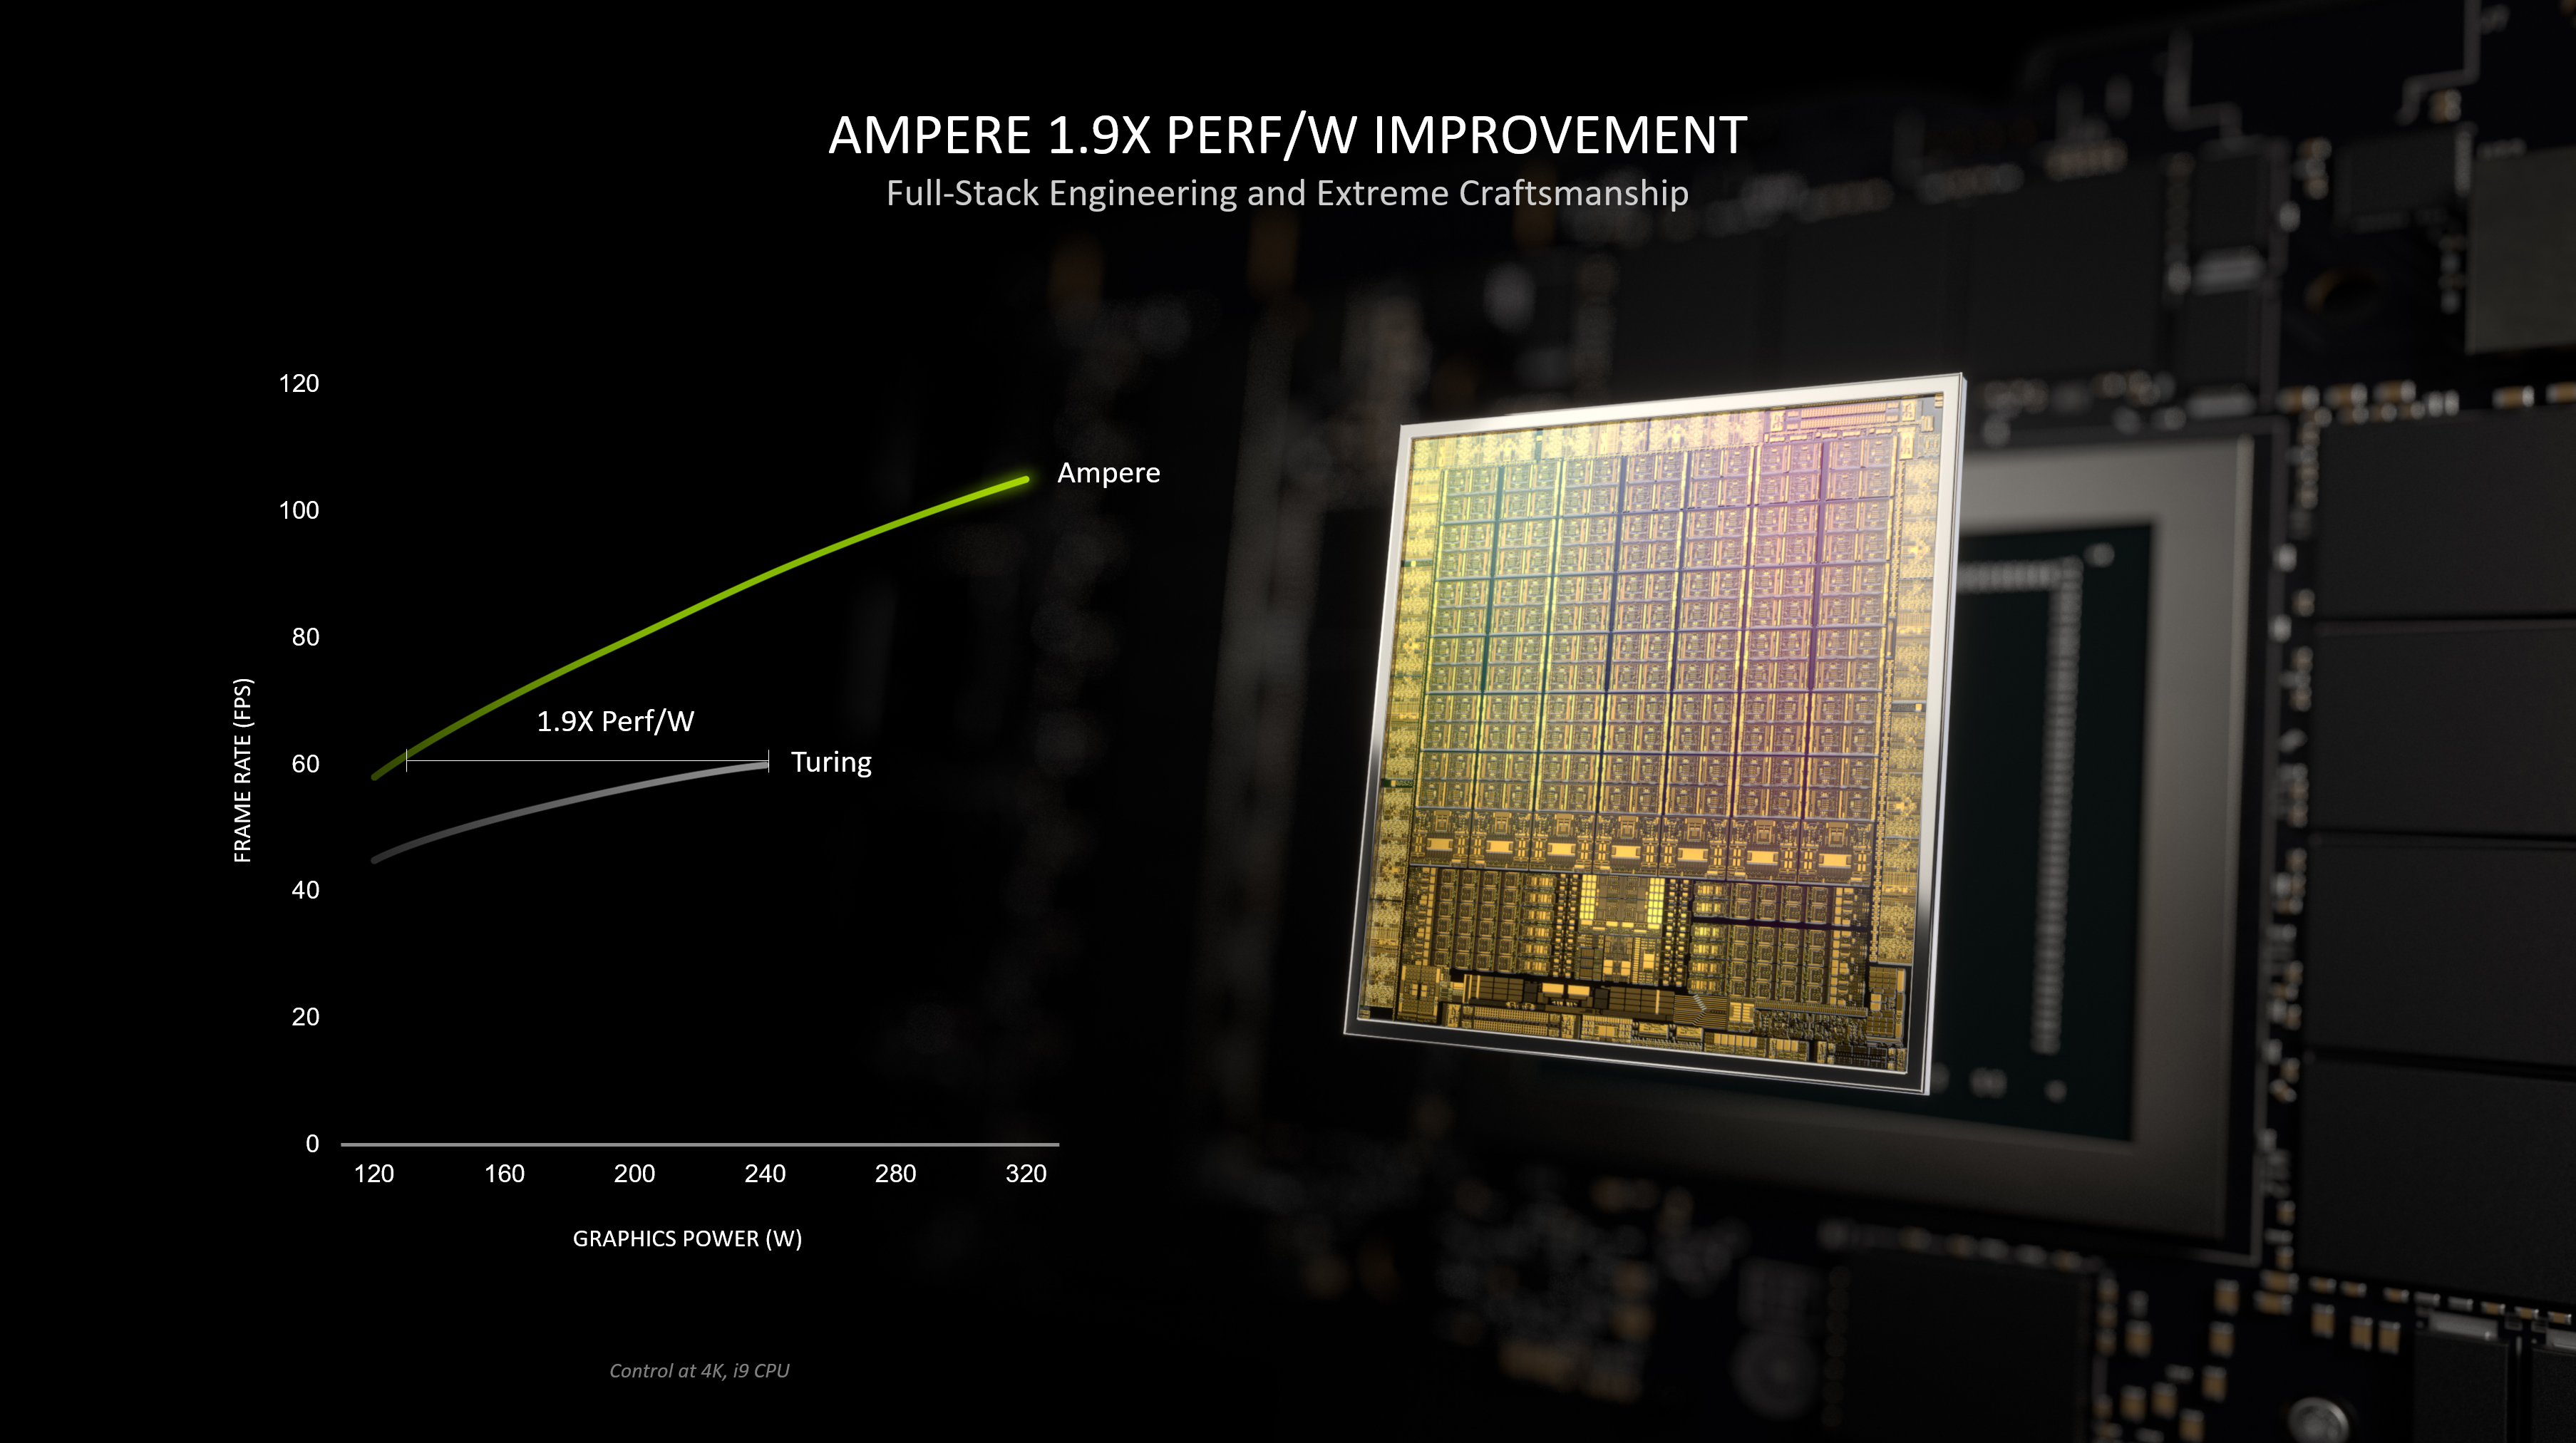
Der GA107 Chip bietet 3.072 FP32 ALUs wovon die Hälfte auch INT32 Befehle ausführen können (also 1.536 INT32 ALUs). Bei Turing konnten noch alle Shader FP32 oder INT32 ausführen. Die Raytracing und Tensor Kerne auf dem Chip wurden laut Nvidia ebenfalls verbessert. Weiters integriert der Ampere Chip einen Hardware Video-Encoder (NVENC 5. Generation für H.264 und H.265) und Decoder (7. Generation für zahlreiche Formate inklusive AV1).
Der GA107 Chip wird bei Samsung im 8nm (8N) Verfahren welches mit dem 7nm Verfahren von TSMC nicht ganz mithalten kann (z.B. von AMD genutzt, aber auch für den professionellen GA100 Ampere Chip).
Intel Iris Plus Graphics 640 ► remove from comparison
Die Intel Iris Plus Graphics 640 (GT3e) ist eine Prozessorgrafikkarte der im Jänner 2017 vorgestellten Kaby-Lake-Modelle. Als Nachfolger der Iris Graphics 540 (Skylake) ist die Iris Plus Graphics 640 dabei in den ULV-Modellen der 15-Watt-Klasse zu finden und besitzt einen dedizierten eDRAM-Cache mit 64 MB Kapazität. Die sogenannte GT3e-Ausbaustufe der Kaby-Lake-GPU verfügt weiterhin über 48 Execution Units (EUs), die je nach Modell mit bis zu 1.050 MHz takten.
Neben dem eDRAM-Cache kann die Iris 640 auch über das Interface des Prozessors auf den Hauptspeicher zugreifen (2x 64 Bit DDR3L-1600/LPDDR3-1866/DDR4-2133).
Von der Iris Plus 650 der 28-Watt-Modelle unterscheidet sich die Iris 640 lediglich durch ihren etwas geringeren Maximaltakt sowie die geringere TDP, wodurch der Turbo-Boost-Spielraum weniger lang ausgenutzt werden kann.
Performance
Die exakte Leistung der Iris Plus Graphics 640 hängt vom jeweiligen CPU-Modell ab, da sich die Maximaltaktrate leicht unterscheiden kann. Zum anderen beeinflusst auch der verwendete Speicher (DDR3/DDR4) die Performance.
Die höchste Leistung erreichen hochtaktende Core-i7-Ableger wie der Core i7-7660U. Je nach Spiel ordnet sich die Iris 640 wahrscheinlich wie der Vorgänger zwischen einer dedizierten GeForce 920M und GeForce 940M ein und kann aktuelle Spiele meist nur in niedrigen Einstellungen flüssig darstellen.
Features
Die überarbeitete Videoeinheit dekodiert H.265-/HEVC-Videos vollständig in Hardware. Anders als Skylake kann Kaby Lake nun auch H.265/HEVC im Main10-Profil mit 10 Bit Farbtiefe sowie Googles VP9-Codec in Hardware dekodieren. Die Bildausgabe erfolgt über DP 1.2/eDP 1.3 (max. 3.840 x 2.160 @ 60 Hz), wohingegen HDMI nur in der älteren Version 1.4a angeboten wird. Ein HDMI-2.0-Anschluss kann aber mittels Konverter von DisplayPort ergänzt werden. Maximal lassen sich drei Displays parallel angesteuern.
Leistungsaufnahme
Die Iris Graphics 640 ist in ULV-Prozessoren der 15-Watt-Klasse zu finden und damit für schlanke Note- und Ultrabooks geeignet.
Intel Iris Plus Graphics 655 NVIDIA GeForce RTX 3050 6GB Laptop GPU Intel Iris Plus Graphics 640 Gen. 9.5 Serie Codename Kaby Lake GT3e GN20-P0-R 6GB Kaby Lake GT3e Architektur Gen. 9.5 Kaby Lake Ampere Gen. 9.5 Kaby Lake Pipelines 48 - unified 2560 - unified 48 - unified Kerntakt 300 - 1200 (Boost) MHz 1237 - 1492 (Boost) MHz 300 - 1050 (Boost) MHz Speichertyp DDR3/DDR4 GDDR6 DDR3/DDR4 Shared Memory ja nein ja API DirectX 12_1, OpenGL 4.5 DirectX 12_2, Shader 6.7, OpenGL 4.6 DirectX 12_1, OpenGL 4.4 Herstellungsprozess 14 nm 8 nm 14 nm Features QuickSync NVIDIA DLSS, NVIDIA Reflex, Resizable BAR, NVIDIA Broadcast, NVIDIA Ansel, NVIDIA ShadowPlay, NVIDIA G-SYNC, Advanced Optimus, Nvidia Max-Q, Dynamic Boost QuickSync Erscheinungsdatum 01.09.2017 06.01.2023 03.01.2017 TMUs 80 ROPs 32 Raytracing Cores 16 Tensor / AI Cores 64 Speichertakt 12000 effective = 1500 MHz Speicherbandbreite 96 Bit 64/128 Bit Max. Speichergröße 6 GB 64 MB Memory Bandwidth 144 GB/s Stromverbrauch 60 Watt (35 - 80 Watt TGP) PCIe 4.0 Displays HDMI 2.1, DisplayPort 1.4a Notebookgröße groß (17" z.B.) Predecessor GeForce RTX 3050 4GB Laptop GPU
Benchmarks Performance Rating - 3DMark 11 + Fire Strike + Time Spy - Iris Plus Graphics 655
0.9 pt (3%)
...
Intel Iris Plus Graphics 655
...
max:
Performance Rating - 3DMark 11 + Fire Strike + Time Spy - GeForce RTX 3050 6GB Laptop GPU
5.5 pt (16%)
...
NVIDIA GeForce RTX 3050 6GB Laptop GPU
...
max:
3DMark - 3DMark Time Spy Score
min: 348 avg: 647 median: 684 (2%) max: 722 Points
min: 4933 avg: 5058 median: 5057.5 (15%) max: 5182 Points
GPU TDP ? TDP 50 W TDP 63 W 12% 95% 100%
min: 467 avg: 499.8 median: 494.5 (1%) max: 543 Points
GPU TDP ? TDP 50 W TDP 63 W 12% 95% 100%
3DMark - 3DMark Time Spy Graphics
min: 301 avg: 570 median: 604.5 (2%) max: 633 Points
min: 4501 avg: 4661 median: 4660.5 (12%) max: 4820 Points
GPU TDP ? TDP 50 W TDP 63 W 12% 93% 100%
min: 413 avg: 442.5 median: 437 (1%) max: 483 Points
GPU TDP ? TDP 50 W TDP 63 W 11% 93% 100%
3DMark - 3DMark Ice Storm Unlimited Graphics
min: 131607 avg: 139716 median: 137266 (16%) max: 152727 Points
500518 Points (57%)
GPU TDP ? TDP 60 W 28% 100%
min: 142163 avg: 147298 median: 145481 (16%) max: 154251 Points
GPU TDP ? TDP 60 W 29% 100%
3DMark - 3DMark Ice Storm Extreme Graphics
min: 57033 avg: 72655 median: 71073 (9%) max: 89859 Points
80214 Points (10%)
GPU TDP ? TDP 60 W 91% 100%
3DMark - 3DMark Cloud Gate Score
min: 6769 avg: 10798 median: 11622 (12%) max: 13037 Points
43015 Points (46%)
GPU TDP ? TDP 60 W 25% 100%
min: 7558 avg: 8025 median: 8067 (9%) max: 8711 Points
GPU TDP ? TDP 60 W 23% 100%
3DMark - 3DMark Cloud Gate Graphics
min: 6498 avg: 13736 median: 14343 (4%) max: 16698 Points
72486 Points (19%)
GPU TDP ? TDP 60 W 19% 100%
min: 10486 avg: 11119 median: 11248 (3%) max: 11495 Points
GPU TDP ? TDP 60 W 18% 100%
3DMark - 3DMark Fire Strike Standard Score
min: 852 avg: 1703 median: 1850 (3%) max: 2040 Points
min: 10765 avg: 10995 median: 10890 (19%) max: 11330 Points
GPU TDP ? TDP 50 W TDP 60 W TDP 63 W 15% 95% 96% 100%
min: 1236 avg: 1349 median: 1310 (2%) max: 1509 Points
GPU TDP ? TDP 50 W TDP 60 W TDP 63 W 14% 95% 96% 100%
3DMark - 3DMark Fire Strike Standard Graphics
min: 920 avg: 1836 median: 1983 (2%) max: 2260 Points
min: 11887 avg: 12155 median: 11960 (14%) max: 12618 Points
GPU TDP ? TDP 50 W TDP 60 W TDP 63 W 15% 94% 95% 100%
min: 1315 avg: 1411 median: 1393.5 (2%) max: 1541 Points
GPU TDP ? TDP 50 W TDP 60 W TDP 63 W 14% 94% 95% 100%
3DMark - 3DMark Ice Storm Graphics
min: 85405 avg: 107151 median: 110302 (13%) max: 122594 Points
80553 Points (10%)
GPU TDP ? TDP 60 W 100% 75%
3DMark - 3DMark Wild Life Extreme Unlimited
8916 Points (10%)
3DMark 11 - 3DM11 Performance Score
min: 1548 avg: 2942 median: 3180.5 (4%) max: 3349 Points
min: 15844 avg: 16783 median: 17223 (24%) max: 17282 Points
GPU TDP ? TDP 50 W TDP 60 W TDP 63 W 17% 92% 100% 100%
min: 2136 avg: 2440 median: 2561 (4%) max: 2664 Points
GPU TDP ? TDP 50 W TDP 60 W TDP 63 W 16% 92% 100% 100%
3DMark 11 - 3DM11 Performance GPU
min: 1365 avg: 2707 median: 2894 (2%) max: 3081 Points
min: 15860 avg: 17113 median: 17421 (15%) max: 18059 Points
GPU TDP ? TDP 50 W TDP 60 W TDP 63 W 15% 88% 96% 100%
min: 1980 avg: 2275 median: 2379 (2%) max: 2493 Points
GPU TDP ? TDP 50 W TDP 60 W TDP 63 W 14% 88% 96% 100%
3DMark Vantage + Intel Iris Plus Graphics 655 3DMark Vantage - 3DM Vant. Perf. total
min: 12093 avg: 12287 median: 12287 (4%) max: 12481 Points
3DM Vant. Perf. GPU no PhysX + Intel Iris Plus Graphics 655 3DMark Vantage - 3DM Vant. Perf. GPU no PhysX
min: 10337 avg: 10514 median: 10513.5 (6%) max: 10690 Points
3DMark 05 - 3DMark 05 - Standard
22740 Points (25%)
3DMark 06 3DMark 06 - Standard 1280x1024 + Intel Iris Plus Graphics 655
min: 17176 avg: 17885 median: 17885 (23%) max: 18594 Points
3DMark 06 - Standard 1280x1024 + Intel Iris Plus Graphics 640
min: 13164 avg: 14118 median: 14117.5 (18%) max: 15071 Points
Unigine Valley 1.0 - Unigine Valley 1.0 DX
8.2 fps (3%)
6.5 fps (2%)
Blender - Blender 3.3 Classroom CUDA *
min: 107 avg: 110.7 median: 110 (16%) max: 115 Seconds
GPU TDP 50 W TDP 60 W TDP 63 W 100% 101% 101%
Blender - Blender 3.3 Classroom OPTIX *
min: 68 avg: 69.3 median: 68 (25%) max: 72 Seconds
GPU TDP 50 W TDP 60 W TDP 63 W 100% 102% 102%
SPECviewperf 12 + Intel Iris Plus Graphics 655 SPECviewperf 12 - specvp12 sw-03
28.2 fps (7%)
specvp12 snx-02 + Intel Iris Plus Graphics 655 SPECviewperf 12 - specvp12 snx-02
2.1 fps (0%)
specvp12 showcase-01 + Intel Iris Plus Graphics 655 SPECviewperf 12 - specvp12 showcase-01
10.3 fps (2%)
specvp12 mediacal-01 + Intel Iris Plus Graphics 655 SPECviewperf 12 - specvp12 mediacal-01
4.6 fps (1%)
specvp12 maya-04 + Intel Iris Plus Graphics 655 SPECviewperf 12 - specvp12 maya-04
20.4 fps (6%)
specvp12 energy-01 + Intel Iris Plus Graphics 655 SPECviewperf 12 - specvp12 energy-01
0.3 fps (0%)
specvp12 creo-01 + Intel Iris Plus Graphics 655 SPECviewperf 12 - specvp12 creo-01
14.9 fps (6%)
specvp12 catia-04 + Intel Iris Plus Graphics 655 SPECviewperf 12 - specvp12 catia-04
18.8 fps (3%)
specvp12 3dsmax-05 + Intel Iris Plus Graphics 655 SPECviewperf 12 - specvp12 3dsmax-05
18.1 fps (3%)
SPECviewperf 13 specvp13 sw-04 + Intel Iris Plus Graphics 655 SPECviewperf 13 - specvp13 sw-04
34.6 fps (9%)
specvp13 snx-03 + Intel Iris Plus Graphics 655 SPECviewperf 13 - specvp13 snx-03
3.8 fps (0%)
specvp13 showcase-02 + Intel Iris Plus Graphics 655 SPECviewperf 13 - specvp13 showcase-02
10.3 fps (2%)
specvp13 medical-02 + Intel Iris Plus Graphics 655 SPECviewperf 13 - specvp13 medical-02
3.8 fps (1%)
specvp13 maya-05 + Intel Iris Plus Graphics 655 SPECviewperf 13 - specvp13 maya-05
25.9 fps (3%)
specvp13 energy-02 + Intel Iris Plus Graphics 655 SPECviewperf 13 - specvp13 energy-02
1.1 fps (0%)
specvp13 creo-02 + Intel Iris Plus Graphics 655 SPECviewperf 13 - specvp13 creo-02
19.6 fps (3%)
specvp13 catia-05 + Intel Iris Plus Graphics 655 SPECviewperf 13 - specvp13 catia-05
26.4 fps (3%)
specvp13 3dsmax-06 + Intel Iris Plus Graphics 655 SPECviewperf 13 - specvp13 3dsmax-06
18.2 fps (3%)
SPECviewperf 2020 specvp2020 solidworks-05 4k + Intel Iris Plus Graphics 655 SPECviewperf 2020 - specvp2020 solidworks-05 4k
21.2 fps (6%)
specvp2020 snx-04 4k + Intel Iris Plus Graphics 655 SPECviewperf 2020 - specvp2020 snx-04 4k
3.8 fps (0%)
specvp2020 medical-03 4k + Intel Iris Plus Graphics 655 SPECviewperf 2020 - specvp2020 medical-03 4k
1.8 fps (2%)
specvp2020 maya-06 4k + Intel Iris Plus Graphics 655 SPECviewperf 2020 - specvp2020 maya-06 4k
32.7 fps (5%)
specvp2020 energy-03 4k + Intel Iris Plus Graphics 655 SPECviewperf 2020 - specvp2020 energy-03 4k
1.1 fps (0%)
specvp2020 creo-03 4k + Intel Iris Plus Graphics 655 SPECviewperf 2020 - specvp2020 creo-03 4k
12.1 fps (6%)
specvp2020 catia-06 4k + Intel Iris Plus Graphics 655 SPECviewperf 2020 - specvp2020 catia-06 4k
6.3 fps (4%)
specvp2020 3dsmax-07 4k + Intel Iris Plus Graphics 655 SPECviewperf 2020 - specvp2020 3dsmax-07 4k
8.4 fps (3%)
Cinebench R10 Cinebench R10 Shading (32bit) + Intel Iris Plus Graphics 655 Cinebench R10 - Cinebench R10 Shading (32bit)
min: 7836 avg: 9544 median: 10263 (7%) max: 10533 Points
Cinebench R10 Shading (32bit) + Intel Iris Plus Graphics 640
min: 8824 avg: 9678 median: 9703 (7%) max: 10506 Points
Cinebench R11.5 Cinebench R11.5 OpenGL 64 Bit + Intel Iris Plus Graphics 655 Cinebench R11.5 - Cinebench R11.5 OpenGL 64 Bit
min: 50.25 avg: 51.4 median: 51.6 (18%) max: 52.2 fps
Cinebench R11.5 OpenGL 64 Bit + Intel Iris Plus Graphics 640
46.1 fps (16%)
Cinebench R15 + Intel Iris Plus Graphics 655 Cinebench R15 - Cinebench R15 OpenGL 64 Bit
min: 33.91 avg: 67 median: 74 (4%) max: 88 fps
Cinebench R15 OpenGL 64 Bit + NVIDIA GeForce RTX 3050 6GB Laptop GPU
min: 117.6 avg: 186.5 median: 221 (13%) max: 221 fps
GPU TDP ? TDP 50 W TDP 60 W TDP 63 W 30% 100% 100% 53%
Cinebench R15 OpenGL 64 Bit + Intel Iris Plus Graphics 640
min: 41.32 avg: 54 median: 56.2 (3%) max: 62.3 fps
GPU TDP ? TDP 50 W TDP 60 W TDP 63 W 29% 100% 100% 53%
Cinebench R15 OpenGL Ref. Match 64 Bit + Intel Iris Plus Graphics 655 Cinebench R15 - Cinebench R15 OpenGL Ref. Match 64 Bit
min: 97.8 avg: 98.1 median: 97.8 (98%) max: 99.3 %
Cinebench R15 OpenGL Ref. Match 64 Bit + NVIDIA GeForce RTX 3050 6GB Laptop GPU
99.6 % (100%)
GPU TDP ? TDP 50 W TDP 60 W TDP 63 W 99% 100% 100% 100%
Cinebench R15 OpenGL Ref. Match 64 Bit + Intel Iris Plus Graphics 640
min: 97.8 avg: 98.2 median: 97.8 (98%) max: 99.3 %
GPU TDP ? TDP 50 W TDP 60 W TDP 63 W 99% 100% 100% 100%
GFXBench - GFXBench Car Chase Offscreen
40.7 fps (5%)
GFXBench 3.1 - GFXBench Manhattan ES 3.1 Offscreen
min: 43.1 avg: 2387 median: 2387.1 (50%) max: 4731 fps
56.1 fps (1%)
GFXBench 3.0 - GFXBench 3.0 Manhattan Offscreen
199.6 fps (12%)
31.2 fps (2%)
GFXBench (DX / GLBenchmark) 2.7 + Intel Iris Plus Graphics 655 GFXBench (DX / GLBenchmark) 2.7 - GFXBench T-Rex HD Offscreen C24Z16
min: 199.6 avg: 6375 median: 6375.3 (51%) max: 12551 fps
GFXBench T-Rex HD Offscreen C24Z16 + Intel Iris Plus Graphics 640
171 fps (1%)
Basemark GPU 1.2 - Basemark GPU 1.2 Vulkan Official Medium Offscreen 1080
min: 104.6 avg: 166.1 median: 104.6 (1%) max: 289 fps
GPU TDP 50 W TDP 60 W TDP 63 W 100% 36% 36%
Basemark GPU 1.2 - Basemark GPU 1.2 Vulkan Official High Offscreen 2160
3.6 fps (1%)
Geekbench 6.2 - Geekbench 6.2 GPU OpenCL
min: 52427 avg: 53591 median: 53590.5 (16%) max: 54754 Points
GPU TDP 50 W TDP 60 W 96% 100%
Geekbench 6.2 - Geekbench 6.2 GPU Vulkan
min: 18152 avg: 19500 median: 19499.5 (6%) max: 20847 Points
GPU TDP 50 W TDP 60 W 100% 87%
LuxMark v2.0 64Bit - LuxMark v2.0 Room GPU
min: 359 avg: 419.5 median: 419.5 (2%) max: 480 Samples/s
min: 315 avg: 325 median: 325 (1%) max: 335 Samples/s
LuxMark v2.0 64Bit - LuxMark v2.0 Sala GPU
min: 882 avg: 1038 median: 1038 (2%) max: 1194 Samples/s
min: 748 avg: 779 median: 778.5 (1%) max: 809 Samples/s
ComputeMark v2.1 - ComputeMark v2.1 Result
min: 1584 avg: 1713 median: 1712.5 (2%) max: 1841 Points
min: 1575 avg: 1677 median: 1677 (2%) max: 1779 Points
Power Consumption - Furmark Stress Test Power Consumption - external Monitor *
min: 28.9 avg: 37.4 median: 39.2 (6%) max: 42.4 Watt
min: 79.4 avg: 87.6 median: 87.3 (12%) max: 96.1 Watt
GPU TDP ? TDP 50 W TDP 60 W TDP 63 W 110% 101% 100% 103%
min: 30.8 avg: 33.6 median: 31.5 (4%) max: 38.5 Watt
GPU TDP ? TDP 50 W TDP 60 W TDP 63 W 110% 101% 100% 103%
Power Consumption - The Witcher 3 Power Consumption - external Monitor *
min: 35.3 avg: 40.6 median: 39.4 (6%) max: 47.2 Watt
min: 83 avg: 87.2 median: 86.1 (12%) max: 92.6 Watt
GPU TDP ? TDP 50 W TDP 60 W TDP 63 W 108% 102% 100% 101%
min: 28 avg: 33.5 median: 33.5 (5%) max: 38.9 Watt
GPU TDP ? TDP 50 W TDP 60 W TDP 63 W 109% 102% 100% 101%
Power Consumption - Witcher 3 Power Consumption *
min: 39.4 avg: 43.3 median: 43.3 (10%) max: 47.2 Watt
min: 86.8 avg: 90.8 median: 89.5 (20%) max: 96.2 Watt
GPU TDP ? TDP 50 W TDP 60 W TDP 63 W 115% 103% 100% 102%
min: 31.7 avg: 34.9 median: 34.9 (8%) max: 38.1 Watt
GPU TDP ? TDP 50 W TDP 60 W TDP 63 W 116% 103% 100% 102%
Power Consumption - Witcher 3 ultra Power Efficiency
0.1 fps per Watt (14%)
min: 0.503 avg: 0.5 median: 0.5 (52%) max: 0.591 fps per Watt
GPU TDP ? TDP 50 W TDP 60 W TDP 63 W 24% 85% 88% 100%
Power Consumption - Witcher 3 ultra Power Efficiency - external Monitor
0.2 fps per Watt (13%)
min: 0.527 avg: 0.6 median: 0.5 (45%) max: 0.614 fps per Watt
GPU TDP ? TDP 50 W TDP 60 W TDP 63 W 26% 86% 88% 100%
0.1 fps per Watt (9%)
GPU TDP ? TDP 50 W TDP 60 W TDP 63 W 21% 86% 88% 100%
Emissions Witcher 3 Fan Noise + Intel Iris Plus Graphics 655 Emissions - Witcher 3 Fan Noise
min: 32.5 avg: 36.2 median: 37.2 (60%) max: 39 dB(A)
Witcher 3 Fan Noise + NVIDIA GeForce RTX 3050 6GB Laptop GPU
min: 42.1 avg: 44.9 median: 43.8 (70%) max: 48.7 dB(A)
GPU TDP ? TDP 50 W TDP 60 W TDP 63 W 74% 100% 86% 90%
Witcher 3 Fan Noise + Intel Iris Plus Graphics 640
33.4 dB(A) (53%)
GPU TDP ? TDP 50 W TDP 60 W TDP 63 W 73% 100% 86% 90%
Clock Speed - GPU Clock Witcher 3 ultra
998 MHz (39%)
min: 748 avg: 823 median: 823 (32%) max: 898 MHz
Clock Speed - GPU Clock Speed Furmark
min: 570 avg: 634 median: 634 (25%) max: 698 MHz
Average Benchmarks Intel Iris Plus Graphics 655 → 100% n=11 Average Benchmarks NVIDIA GeForce RTX 3050 6GB Laptop GPU → 499% n=11 Average Benchmarks Intel Iris Plus Graphics 640 → 80% n=11
- Bereich der Benchmarkergebnisse für diese Grafikkarte
- Durchschnittliche Benchmarkergebnisse für diese Grafikkarte
* Smaller numbers mean a higher performance
1 This benchmark is not used for the average calculation
Spiele-Benchmarks Die folgenden Benchmarks basieren auf unseren Spieletests mit Testnotebooks. Die Performance dieser Grafikkarte bei den gelisteten Spielen ist abhängig von der verwendeten CPU, Speicherausstattung, Treiber und auch Betriebssystem. Dadurch müssen die untenstehenden Werte nicht repräsentativ sein. Detaillierte Informationen über das verwendete System sehen Sie nach einem Klick auf den fps-Wert.
GeForce RTX 3050 6GB Laptop GPU:
39.5 fps
GeForce RTX 3050 6GB Laptop GPU:
36.3 fps
GeForce RTX 3050 6GB Laptop GPU:
31.5 fps
GeForce RTX 3050 6GB Laptop GPU:
23.4 fps
GeForce RTX 3050 6GB Laptop GPU:
15.1 fps
GeForce RTX 3050 6GB Laptop GPU:
70 fps
GeForce RTX 3050 6GB Laptop GPU:
63 fps
GeForce RTX 3050 6GB Laptop GPU:
55 fps
GeForce RTX 3050 6GB Laptop GPU:
41 fps
GeForce RTX 3050 6GB Laptop GPU:
31 fps
GeForce RTX 3050 6GB Laptop GPU:
55.2 67.6 ~ 61 fps
GeForce RTX 3050 6GB Laptop GPU:
43.7 52.1 ~ 48 fps
GeForce RTX 3050 6GB Laptop GPU:
36.6 43.2 ~ 40 fps
GeForce RTX 3050 6GB Laptop GPU:
31.4 36.9 ~ 34 fps
GeForce RTX 3050 6GB Laptop GPU:
21.3 fps
GeForce RTX 3050 6GB Laptop GPU:
113.9 150.1 ~ 132 fps
GeForce RTX 3050 6GB Laptop GPU:
109 141.2 ~ 125 fps
GeForce RTX 3050 6GB Laptop GPU:
86.9 97.5 ~ 92 fps
GeForce RTX 3050 6GB Laptop GPU:
20.5 26 ~ 23 fps
GeForce RTX 3050 6GB Laptop GPU:
10.6 14.3 ~ 12 fps
GeForce RTX 3050 6GB Laptop GPU:
40 fps
GeForce RTX 3050 6GB Laptop GPU:
38 fps
GeForce RTX 3050 6GB Laptop GPU:
34 fps
GeForce RTX 3050 6GB Laptop GPU:
29 fps
GeForce RTX 3050 6GB Laptop GPU:
30.7 33.6 34 ~ 33 fps
GeForce RTX 3050 6GB Laptop GPU:
18.1 20.1 ~ 19 fps
GeForce RTX 3050 6GB Laptop GPU:
113.3 fps
GeForce RTX 3050 6GB Laptop GPU:
89.7 fps
GeForce RTX 3050 6GB Laptop GPU:
59.2 fps
GeForce RTX 3050 6GB Laptop GPU:
46.4 fps
GeForce RTX 3050 6GB Laptop GPU:
80.8 fps
GeForce RTX 3050 6GB Laptop GPU:
64.2 fps
GeForce RTX 3050 6GB Laptop GPU:
46.4 fps
GeForce RTX 3050 6GB Laptop GPU:
38.5 fps
100%
Iris Plus Graphics 655:
44.6 fps
489%
GeForce RTX 3050 6GB Laptop GPU:
218 fps
100%
Iris Plus Graphics 655:
21.6 fps
590%
GeForce RTX 3050 6GB Laptop GPU:
127.4 fps
100%
Iris Plus Graphics 655:
16.4 fps
639%
GeForce RTX 3050 6GB Laptop GPU:
104.8 fps
100%
Iris Plus Graphics 655:
10.2 fps
607%
GeForce RTX 3050 6GB Laptop GPU:
61.9 fps
GeForce RTX 3050 6GB Laptop GPU:
40 fps
100%
Iris Plus Graphics 655:
40.7 fps
100%
Iris Plus Graphics 655:
19.1 fps
100%
Iris Plus Graphics 655:
14.5 fps
100%
Iris Plus Graphics 655:
9.6 fps
100%
Iris Plus Graphics 655:
54.8 fps
100%
Iris Plus Graphics 655:
17.3 fps
100%
Iris Plus Graphics 655:
11.6 fps
Iris Plus Graphics 655:
0 (!) [X] Intel NUC8i7BE Intel Core i7-8559U 2.7GHz
Iris Plus Graphics 655
fps
100%
Iris Plus Graphics 655:
29.1 [X] Intel NUC8i7BE Intel Core i7-8559U 2.7GHz
Iris Plus Graphics 655
min:
17 fps, max:
36 fps
fps
100%
Iris Plus Graphics 655:
16.2 [X] Intel NUC8i7BE Intel Core i7-8559U 2.7GHz
Iris Plus Graphics 655
min:
11 fps, max:
22 fps
fps
100%
Iris Plus Graphics 655:
14.1 [X] Intel NUC8i7BE Intel Core i7-8559U 2.7GHz
Iris Plus Graphics 655
min:
11 fps, max:
21 fps
fps
100%
Iris Plus Graphics 655:
6.6 [X] Intel NUC8i7BE Intel Core i7-8559U 2.7GHz
Iris Plus Graphics 655
min:
3 fps, max:
9 fps
fps
100%
Iris Plus Graphics 655:
59.8 [X] Intel NUC8i7BE Intel Core i7-8559U 2.7GHz
Iris Plus Graphics 655
min:
56 fps, max:
62 fps
fps
100%
Iris Plus Graphics 655:
27.2 [X] Intel NUC8i7BE Intel Core i7-8559U 2.7GHz
Iris Plus Graphics 655
min:
20 fps, max:
31 fps
fps
100%
Iris Plus Graphics 655:
15.8 [X] Intel NUC8i7BE Intel Core i7-8559U 2.7GHz
Iris Plus Graphics 655
min:
3.7 fps, P1:
6.17 fps, max:
130 fps
fps
Iris Plus Graphics 655:
0 (!) [X] Intel NUC8i7BE Intel Core i7-8559U 2.7GHz
Iris Plus Graphics 655
fps
100%
Iris Plus Graphics 655:
36.3 (!) [X] Intel NUC8i7BE Intel Core i7-8559U 2.7GHz
Iris Plus Graphics 655
P1:
24.6 fps
fps
100%
Iris Plus Graphics 655:
20.9 (!) [X] Intel NUC8i7BE Intel Core i7-8559U 2.7GHz
Iris Plus Graphics 655
P1:
14.5 fps
fps
Iris Plus Graphics 655:
0 (!) [X] Intel NUC8i7BE Intel Core i7-8559U 2.7GHz
Iris Plus Graphics 655
fps
100%
Iris Plus Graphics 655:
92 [X] Intel NUC8i7BE DirectX 11
Intel Core i7-8559U 2.7GHz
Iris Plus Graphics 655
P1:
74.1 fps
fps
100%
Iris Plus Graphics 655:
55.9 [X] Intel NUC8i7BE DirectX 11
Intel Core i7-8559U 2.7GHz
Iris Plus Graphics 655
P1:
47.4 fps
fps
100%
Iris Plus Graphics 655:
46.3 [X] Intel NUC8i7BE DirectX 11
Intel Core i7-8559U 2.7GHz
Iris Plus Graphics 655
P1:
35.6 fps
fps
100%
Iris Plus Graphics 655:
34.9 [X] Intel NUC8i7BE DirectX 11
Intel Core i7-8559U 2.7GHz
Iris Plus Graphics 655
P1:
31.3 fps
fps
100%
Iris Plus Graphics 655:
26.5 [X] Intel NUC8i7BE DirectX 11
Intel Core i7-8559U 2.7GHz
Iris Plus Graphics 655
P1:
24 fps
fps
100%
Iris Plus Graphics 655:
13.6 [X] Intel NUC8i7BE DirectX 11
Intel Core i7-8559U 2.7GHz
Iris Plus Graphics 655
P1:
12 fps
fps
100%
Iris Plus Graphics 655:
22.5 23.5 ~ 23 fps
100%
Iris Plus Graphics 655:
10.2 10.4 ~ 10 fps
100%
Iris Plus Graphics 655:
6.4 6.7 ~ 7 fps
100%
Iris Plus Graphics 655:
25.4 (!) [X] Intel NUC8i7BE Intel Core i7-8559U 2.7GHz
Iris Plus Graphics 655
min:
20 fps, max:
31 fps
fps
100%
Iris Plus Graphics 655:
51.2 [X] Intel NUC8i7BE Intel Core i7-8559U 2.7GHz
Iris Plus Graphics 655
min:
46 fps, max:
56 fps
fps
100%
Iris Plus Graphics 655:
21.9 [X] Intel NUC8i7BE Intel Core i7-8559U 2.7GHz
Iris Plus Graphics 655
min:
19 fps, max:
23 fps
fps
100%
Iris Plus Graphics 655:
19.3 [X] Intel NUC8i7BE Intel Core i7-8559U 2.7GHz
Iris Plus Graphics 655
min:
17 fps, max:
21 fps
fps
100%
Iris Plus Graphics 655:
56.7 [X] Intel NUC8i7BE Intel Core i7-8559U 2.7GHz
Iris Plus Graphics 655
min:
51 fps, max:
63 fps
fps
100%
Iris Plus Graphics 655:
18.5 [X] Intel NUC8i7BE Intel Core i7-8559U 2.7GHz
Iris Plus Graphics 655
min:
14 fps, max:
24 fps
fps
100%
Iris Plus Graphics 655:
10.5 [X] Intel NUC8i7BE Intel Core i7-8559U 2.7GHz
Iris Plus Graphics 655
min:
8 fps, max:
13 fps
fps
100%
Iris Plus Graphics 655:
24.5 fps
100%
Iris Plus Graphics 655:
30.2 [X] Intel NUC8i7BE Intel Core i7-8559U 2.7GHz
Iris Plus Graphics 655
min:
26 fps, max:
34 fps
fps
100%
Iris Plus Graphics 655:
35 fps
100%
Iris Plus Graphics 655:
64 [X] Intel NUC8i7BE Intel Core i7-8559U 2.7GHz
Iris Plus Graphics 655
min:
57 fps, max:
76 fps
fps
100%
Iris Plus Graphics 655:
22.8 [X] Intel NUC8i7BE Intel Core i7-8559U 2.7GHz
Iris Plus Graphics 655
min:
20 fps, max:
25 fps
fps
100%
Iris Plus Graphics 655:
16.6 [X] Intel NUC8i7BE Intel Core i7-8559U 2.7GHz
Iris Plus Graphics 655
min:
8 fps, max:
21 fps
fps
100%
Iris Plus Graphics 655:
21 22 [X] Intel NUC8i7BE Intel Core i7-8559U 2.7GHz
Iris Plus Graphics 655
min:
19 fps, max:
27 fps
~ 22 fps
100%
Iris Plus Graphics 655:
11 [X] Intel NUC8i7BE Intel Core i7-8559U 2.7GHz
Iris Plus Graphics 655
min:
10 fps, max:
14 fps
11 ~ 11 fps
100%
Iris Plus Graphics 655:
10 fps
100%
Iris Plus Graphics 655:
9 fps
100%
Iris Plus Graphics 655:
18.3 [X] Intel NUC8i7BE Intel Core i7-8559U 2.7GHz
Iris Plus Graphics 655
min:
10.36 fps, max:
31.73 fps
20.1 ~ 19 fps
100%
Iris Plus Graphics 655:
10.1 fps
100%
Iris Plus Graphics 655:
7.4 fps
100%
Iris Plus Graphics 655:
19.9 [X] Intel NUC8i7BE Intel Core i7-8559U 2.7GHz
Iris Plus Graphics 655
min:
1 fps, max:
33 fps
fps
Iris Plus Graphics 655:
0 (!) fps
100%
Iris Plus Graphics 655:
13 18 [X] Intel NUC8i7BE Intel Core i7-8559U 2.7GHz
Iris Plus Graphics 655
min:
7 fps, max:
26 fps
~ 16 fps
100%
Iris Plus Graphics 655:
25 fps
Iris Plus Graphics 655:
0 (!) fps
100%
Iris Plus Graphics 655:
82 [X] Intel NUC8i7BE Intel Core i7-8559U 2.7GHz
Iris Plus Graphics 655
min:
70 fps, max:
96 fps
fps
100%
Iris Plus Graphics 655:
45.8 [X] Intel NUC8i7BE Intel Core i7-8559U 2.7GHz
Iris Plus Graphics 655
min:
39 fps, max:
51 fps
fps
100%
Iris Plus Graphics 655:
40.3 [X] Intel NUC8i7BE Intel Core i7-8559U 2.7GHz
Iris Plus Graphics 655
min:
32 fps, max:
48 fps
fps
100%
Iris Plus Graphics 655:
36.7 [X] Intel NUC8i7BE Intel Core i7-8559U 2.7GHz
Iris Plus Graphics 655
min:
30 fps, max:
45 fps
fps
100%
Iris Plus Graphics 655:
19 [X] Geekom Mini IT8-GM08i5T Intel Core i5-8259U 2.3GHz
Iris Plus Graphics 655
20.5 22 [X] Intel NUC8i7BE Intel Core i7-8559U 2.7GHz
Iris Plus Graphics 655
min:
17 fps, max:
37 fps
23.5 ~ 21 fps
100%
Iris Plus Graphics 655:
11 13 [X] Geekom Mini IT8-GM08i5T Intel Core i5-8259U 2.3GHz
Iris Plus Graphics 655
~ 12 fps
100%
Iris Plus Graphics 655:
8 [X] Geekom Mini IT8-GM08i5T Intel Core i5-8259U 2.3GHz
Iris Plus Graphics 655
10.1 ~ 9 fps
100%
Iris Plus Graphics 655:
41.4 fps
563%
GeForce RTX 3050 6GB Laptop GPU:
210 256 ~ 233 fps
100%
Iris Plus Graphics 655:
17.6 fps
597%
GeForce RTX 3050 6GB Laptop GPU:
96.5 112.8 ~ 105 fps
100%
Iris Plus Graphics 655:
16.9 fps
509%
GeForce RTX 3050 6GB Laptop GPU:
80.9 91.9 ~ 86 fps
100%
Iris Plus Graphics 655:
14.5 fps
524%
GeForce RTX 3050 6GB Laptop GPU:
70.7 80.5 ~ 76 fps
GeForce RTX 3050 6GB Laptop GPU:
57.1 fps
100%
Iris Plus Graphics 655:
45 fps
100%
Iris Plus Graphics 655:
23 fps
100%
Iris Plus Graphics 655:
17 fps
100%
Iris Plus Graphics 655:
12 12 ~ 12 fps
100%
Iris Plus Graphics 655:
30.9 fps
100%
Iris Plus Graphics 655:
20 22 23 [X] Intel NUC8i7BE Intel Core i7-8559U 2.7GHz
Iris Plus Graphics 655
min:
20 fps, max:
28 fps
~ 22 fps
600%
GeForce RTX 3050 6GB Laptop GPU:
132 fps
100%
Iris Plus Graphics 655:
10 11 [X] Intel NUC8i7BE Intel Core i7-8559U 2.7GHz
Iris Plus Graphics 655
min:
10 fps, max:
14 fps
11 ~ 11 fps
755%
GeForce RTX 3050 6GB Laptop GPU:
76 89 ~ 83 fps
100%
Iris Plus Graphics 655:
10 fps
760%
GeForce RTX 3050 6GB Laptop GPU:
70 82 ~ 76 fps
100%
Iris Plus Graphics 655:
9 fps
789%
GeForce RTX 3050 6GB Laptop GPU:
65 76 ~ 71 fps
GeForce RTX 3050 6GB Laptop GPU:
52 fps
100%
Iris Plus Graphics 655:
15.7 250 ~ 133 fps
100%
Iris Plus Graphics 655:
40.3 fps
100%
Iris Plus Graphics 655:
13.8 [X] Chuwi CoreBook X Pro Intel Core i5-8259U 2.3GHz
Iris Plus Graphics 655
21.2 22.4 [X] Beelink SEi8 Intel Core i3-8109U 3GHz
Iris Plus Graphics 655
25.3 [X] GMK NucBox 2 Intel Core i5-8259U 2.3GHz
Iris Plus Graphics 655
26.8 32.6 42.8 ~ 26 fps
100%
Iris Plus Graphics 655:
9.8 [X] Chuwi CoreBook X Pro Intel Core i5-8259U 2.3GHz
Iris Plus Graphics 655
15 [X] Beelink SEi8 Intel Core i3-8109U 3GHz
Iris Plus Graphics 655
15.3 18 [X] GMK NucBox 2 Intel Core i5-8259U 2.3GHz
Iris Plus Graphics 655
18.4 23.3 29.5 ~ 18 fps
572%
GeForce RTX 3050 6GB Laptop GPU:
76 116.2 117 ~ 103 fps
100%
Iris Plus Graphics 655:
8.6 [X] Chuwi CoreBook X Pro Intel Core i5-8259U 2.3GHz
Iris Plus Graphics 655
12.3 [X] Beelink SEi8 Intel Core i3-8109U 3GHz
Iris Plus Graphics 655
13.4 15.9 [X] GMK NucBox 2 Intel Core i5-8259U 2.3GHz
Iris Plus Graphics 655
16 19.8 25.1 ~ 16 fps
531%
GeForce RTX 3050 6GB Laptop GPU:
61.6 97.1 97.3 ~ 85 fps
100%
Iris Plus Graphics 655:
9.1 [X] Chuwi CoreBook X Pro 1.3
Intel Core i5-8259U 2.3GHz
Iris Plus Graphics 655
14.7 15.6 16.6 [X] Beelink SEi8 1.3
Intel Core i3-8109U 3GHz
Iris Plus Graphics 655
16.9 17 [X] Geekom Mini IT8-GM08i5T Intel Core i5-8259U 2.3GHz
Iris Plus Graphics 655
17.3 [X] GMK NucBox 2 1.3
Intel Core i5-8259U 2.3GHz
Iris Plus Graphics 655
18.1 ~ 16 fps
100%
Iris Plus Graphics 655:
7.9 8.8 [X] Beelink SEi8 1.3
Intel Core i3-8109U 3GHz
Iris Plus Graphics 655
9.1 [X] GMK NucBox 2 1.3
Intel Core i5-8259U 2.3GHz
Iris Plus Graphics 655
9.7 ~ 9 fps
744%
GeForce RTX 3050 6GB Laptop GPU:
59.9 70.3 70.9 ~ 67 fps
100%
Iris Plus Graphics 655:
5.3 6 [X] GMK NucBox 2 1.3
Intel Core i5-8259U 2.3GHz
Iris Plus Graphics 655
6.1 [X] Beelink SEi8 1.3
Intel Core i3-8109U 3GHz
Iris Plus Graphics 655
6.6 ~ 6 fps
817%
GeForce RTX 3050 6GB Laptop GPU:
44.2 51.2 52 ~ 49 fps
GeForce RTX 3050 6GB Laptop GPU:
32 37.4 ~ 35 fps
100%
Iris Plus Graphics 655:
51.5 fps
100%
Iris Plus Graphics 655:
21.6 fps
100%
Iris Plus Graphics 655:
13 fps
Iris Plus Graphics 640:
13.8 fps
100%
Iris Plus Graphics 655:
30 fps
93%
Iris Plus Graphics 640:
28 fps
100%
Iris Plus Graphics 655:
18 fps
100%
Iris Plus Graphics 655:
14 fps
100%
Iris Plus Graphics 655:
9 fps
Iris Plus Graphics 640:
69.5 (!) [X] Microsoft Surface Laptop i7 Intel Core i7-7660U 2.5GHz
Iris Plus Graphics 640
min:
59 fps, max:
78 fps
fps
Iris Plus Graphics 640:
38.8 (!) [X] Microsoft Surface Laptop i7 Intel Core i7-7660U 2.5GHz
Iris Plus Graphics 640
min:
34 fps, max:
43 fps
fps
Iris Plus Graphics 640:
33 38 ~ 36 fps
Iris Plus Graphics 640:
15 15 ~ 15 fps
Iris Plus Graphics 640:
22.9 fps
100%
Iris Plus Graphics 655:
128 fps
100%
Iris Plus Graphics 655:
125 fps
79%
Iris Plus Graphics 640:
99 fps
100%
Iris Plus Graphics 655:
113 fps
42%
Iris Plus Graphics 640:
48 fps
100%
Iris Plus Graphics 655:
57.8 fps
55%
Iris Plus Graphics 640:
31.8 fps
100%
Iris Plus Graphics 655:
34.4 fps
100%
Iris Plus Graphics 655:
78 [X] Geekom Mini IT8-GM08i5T Intel Core i5-8259U 2.3GHz
Iris Plus Graphics 655
97 133.3 ~ 103 fps
100%
Iris Plus Graphics 655:
40.6 46 [X] Geekom Mini IT8-GM08i5T Intel Core i5-8259U 2.3GHz
Iris Plus Graphics 655
59.1 ~ 49 fps
100%
Iris Plus Graphics 655:
32.7 36 [X] Geekom Mini IT8-GM08i5T Intel Core i5-8259U 2.3GHz
Iris Plus Graphics 655
38.8 ~ 36 fps
Iris Plus Graphics 640:
39.9 45.4 ~ 43 fps
Iris Plus Graphics 640:
17.9 18.1 ~ 18 fps
Iris Plus Graphics 640:
14.8 fps
Iris Plus Graphics 640:
33.8 fps
Iris Plus Graphics 640:
20.4 fps
100%
Iris Plus Graphics 655:
20.4 22.7 [X] Intel NUC8i7BE Intel Core i7-8559U 2.7GHz
Iris Plus Graphics 655
min:
15 fps, max:
27 fps
~ 22 fps
73%
Iris Plus Graphics 640:
16 16.6 ~ 16 fps
100%
Iris Plus Graphics 655:
10.2 fps
100%
Iris Plus Graphics 655:
0 (!) 41.3 [X] Intel NUC8i7BE Intel Core i7-8559U 2.7GHz
Iris Plus Graphics 655
min:
31 fps, max:
65 fps
~ 21 fps
152%
Iris Plus Graphics 640:
30.8 33.5 ~ 32 fps
100%
Iris Plus Graphics 655:
16.1 [X] Intel NUC8i7BE Intel Core i7-8559U 2.7GHz
Iris Plus Graphics 655
min:
13 fps, max:
21 fps
fps
75%
Iris Plus Graphics 640:
11.8 12.7 ~ 12 fps
Iris Plus Graphics 640:
42.9 45 ~ 44 fps
Iris Plus Graphics 640:
31.4 fps
Iris Plus Graphics 640:
22.9 fps
Iris Plus Graphics 640:
121 fps
Iris Plus Graphics 640:
91 fps
Iris Plus Graphics 640:
31.6 fps
Iris Plus Graphics 640:
17.8 fps
Iris Plus Graphics 640:
19.6 24.2 ~ 22 fps
Iris Plus Graphics 640:
9.2 11.1 ~ 10 fps
100%
Iris Plus Graphics 655:
28.7 [X] Intel NUC8i7BE Intel Core i7-8559U 2.7GHz
Iris Plus Graphics 655
min:
2.6 fps, max:
41.3 fps
fps
70%
Iris Plus Graphics 640:
20.2 fps
100%
Iris Plus Graphics 655:
21.1 [X] Intel NUC8i7BE Intel Core i7-8559U 2.7GHz
Iris Plus Graphics 655
min:
16 fps, max:
29 fps
fps
100%
Iris Plus Graphics 655:
91 fps
100%
Iris Plus Graphics 655:
68 fps
100%
Iris Plus Graphics 655:
29.9 fps
100%
Iris Plus Graphics 655:
18.2 fps
107%
Iris Plus Graphics 640:
19.5 fps
100%
Iris Plus Graphics 655:
19.4 fps
100%
Iris Plus Graphics 655:
11.3 fps
100%
Iris Plus Graphics 655:
10.5 fps
100%
Iris Plus Graphics 655:
34.2 fps
73%
Iris Plus Graphics 640:
24.9 fps
100%
Iris Plus Graphics 655:
21.2 fps
Iris Plus Graphics 640:
28 fps
Iris Plus Graphics 640:
13 fps
100%
Iris Plus Graphics 655:
25.9 39.2 ~ 33 fps
76%
Iris Plus Graphics 640:
23.5 25.8 ~ 25 fps
100%
Iris Plus Graphics 655:
17.6 22.3 ~ 20 fps
90%
Iris Plus Graphics 640:
16.7 19.4 ~ 18 fps
100%
Iris Plus Graphics 655:
10.8 fps
84%
Iris Plus Graphics 640:
9.1 fps
100%
Iris Plus Graphics 655:
8.9 fps
100%
Iris Plus Graphics 655:
75.8 [X] Intel NUC8i7BE Intel Core i7-8559U 2.7GHz
Iris Plus Graphics 655
min:
12 fps, max:
128 fps
fps
Iris Plus Graphics 655:
0 (!) [X] Intel NUC8i7BE Intel Core i7-8559U 2.7GHz
Iris Plus Graphics 655
fps
Iris Plus Graphics 640:
14.2 fps
Iris Plus Graphics 640:
44.7 fps
Iris Plus Graphics 640:
26.2 fps
Iris Plus Graphics 640:
12.9 fps
100%
Iris Plus Graphics 655:
51.4 [X] Chuwi CoreBook X Pro Intel Core i5-8259U 2.3GHz
Iris Plus Graphics 655
min:
43.6 fps, max:
-1 fps
84 86.8 87.9 92.6 [X] Chuwi CoreBook X Intel Core i5-8259U 2.3GHz
Iris Plus Graphics 655
min:
74.2 fps, max:
-1 fps
94.4 [X] Beelink SEi8 Intel Core i3-8109U 3GHz
Iris Plus Graphics 655
min:
75.6 fps, max:
-1 fps
95 98 [X] GMK NucBox 2 Intel Core i5-8259U 2.3GHz
Iris Plus Graphics 655
min:
79.8 fps, max:
-1 fps
~ 86 fps
93%
Iris Plus Graphics 640:
68 92 ~ 80 fps
100%
Iris Plus Graphics 655:
34.6 [X] Beelink SEi8 Intel Core i3-8109U 3GHz
Iris Plus Graphics 655
min:
29.8 fps, max:
-1 fps
37.1 [X] Chuwi CoreBook X Pro Intel Core i5-8259U 2.3GHz
Iris Plus Graphics 655
min:
32.3 fps, max:
-1 fps
57 [X] Chuwi CoreBook X Intel Core i5-8259U 2.3GHz
Iris Plus Graphics 655
min:
48.7 fps, max:
-1 fps
63 64 66 [X] GMK NucBox 2 Intel Core i5-8259U 2.3GHz
Iris Plus Graphics 655
min:
54.7 fps, max:
-1 fps
68 77.9 ~ 58 fps
102%
Iris Plus Graphics 640:
55 63.7 ~ 59 fps
100%
Iris Plus Graphics 655:
15.8 [X] Chuwi CoreBook X Pro Intel Core i5-8259U 2.3GHz
Iris Plus Graphics 655
min:
14.5 fps, max:
-1 fps
25.3 [X] Beelink SEi8 Intel Core i3-8109U 3GHz
Iris Plus Graphics 655
min:
19.3 fps, max:
-1 fps
27.8 [X] Chuwi CoreBook X Intel Core i5-8259U 2.3GHz
Iris Plus Graphics 655
min:
24.9 fps, max:
-1 fps
31.9 [X] GMK NucBox 2 Intel Core i5-8259U 2.3GHz
Iris Plus Graphics 655
min:
29.3 fps, max:
-1 fps
32.4 33.3 34.5 34.7 ~ 29 fps
100%
Iris Plus Graphics 640:
27.6 29.5 ~ 29 fps
100%
Iris Plus Graphics 655:
13.4 [X] Chuwi CoreBook X Pro Intel Core i5-8259U 2.3GHz
Iris Plus Graphics 655
min:
12.5 fps, max:
-1 fps
22.7 [X] Beelink SEi8 Intel Core i3-8109U 3GHz
Iris Plus Graphics 655
min:
18.8 fps, max:
-1 fps
24.5 [X] Chuwi CoreBook X Intel Core i5-8259U 2.3GHz
Iris Plus Graphics 655
min:
22.1 fps, max:
-1 fps
27.7 [X] GMK NucBox 2 Intel Core i5-8259U 2.3GHz
Iris Plus Graphics 655
min:
25.5 fps, max:
-1 fps
28.1 28.1 29.9 30.4 ~ 26 fps
404%
GeForce RTX 3050 6GB Laptop GPU:
98 99.5 116.9 ~ 105 fps
81%
Iris Plus Graphics 640:
19.8 23 ~ 21 fps
100%
Iris Plus Graphics 655:
11.6 12.2 ~ 12 fps
854%
GeForce RTX 3050 6GB Laptop GPU:
187 236 244 ~ 222 fps
100%
Iris Plus Graphics 655:
14.6 17.8 ~ 16 fps
869%
GeForce RTX 3050 6GB Laptop GPU:
118 159.1 ~ 139 fps
84%
Iris Plus Graphics 640:
13.4 fps
100%
Iris Plus Graphics 655:
10.1 10.9 ~ 11 fps
782%
GeForce RTX 3050 6GB Laptop GPU:
71 91.4 96.5 ~ 86 fps
100%
Iris Plus Graphics 655:
5.6 5.6 ~ 6 fps
817%
GeForce RTX 3050 6GB Laptop GPU:
43.7 50.1 52.9 ~ 49 fps
67%
Iris Plus Graphics 640:
4 fps
GeForce RTX 3050 6GB Laptop GPU:
37 fps
100%
Iris Plus Graphics 655:
57 61 68 [X] Intel NUC8i7BE Intel Core i7-8559U 2.7GHz
Iris Plus Graphics 655
min:
17.5 fps, P1:
40 fps, max:
131 fps
~ 62 fps
91%
Iris Plus Graphics 640:
56.7 fps
100%
Iris Plus Graphics 655:
51.2 51.8 62.1 [X] Intel NUC8i7BE Intel Core i7-8559U 2.7GHz
Iris Plus Graphics 655
min:
15.1 fps, P1:
37 fps, max:
117 fps
~ 55 fps
313%
GeForce RTX 3050 6GB Laptop GPU:
172 172.6 ~ 172 fps
53%
Iris Plus Graphics 640:
28.9 fps
100%
Iris Plus Graphics 655:
13.7 14.3 15.8 [X] Intel NUC8i7BE Intel Core i7-8559U 2.7GHz
Iris Plus Graphics 655
min:
8.44 fps, P1:
11.9 fps, max:
85.5 fps
~ 15 fps
79%
Iris Plus Graphics 640:
11.8 fps
100%
Iris Plus Graphics 655:
5.2 5.5 6.2 [X] Intel NUC8i7BE Intel Core i7-8559U 2.7GHz
Iris Plus Graphics 655
min:
3.37 fps, P1:
4.2 fps, max:
28.7 fps
~ 6 fps
1000%
GeForce RTX 3050 6GB Laptop GPU:
53 62.7 63.8 ~ 60 fps
100%
Iris Plus Graphics 655:
4.2 [X] Intel NUC8i7BE Intel Core i7-8559U 2.7GHz
Iris Plus Graphics 655
min:
2.38 fps, P1:
2.82 fps, max:
99 fps
fps
959%
GeForce RTX 3050 6GB Laptop GPU:
36.5 42.7 ~ 40 fps
Iris Plus Graphics 640:
28.6 fps
Iris Plus Graphics 640:
20.2 20.8 ~ 21 fps
Iris Plus Graphics 640:
43.1 60.3 ~ 52 fps
Iris Plus Graphics 640:
29.7 42 ~ 36 fps
Iris Plus Graphics 640:
23.2 30.7 ~ 27 fps
Iris Plus Graphics 640:
8.2 9.9 ~ 9 fps
100%
Iris Plus Graphics 655:
78.4 116.6 ~ 98 fps
66%
Iris Plus Graphics 640:
61 68.2 ~ 65 fps
100%
Iris Plus Graphics 655:
54.3 64.8 ~ 60 fps
72%
Iris Plus Graphics 640:
40.2 45.1 ~ 43 fps
100%
Iris Plus Graphics 655:
49.4 55 ~ 52 fps
69%
Iris Plus Graphics 640:
33.5 38.3 ~ 36 fps
100%
Iris Plus Graphics 655:
15.5 17 ~ 16 fps
75%
Iris Plus Graphics 640:
10.7 12.5 ~ 12 fps
Iris Plus Graphics 640:
103 132.6 ~ 118 fps
Iris Plus Graphics 640:
54.1 68.7 ~ 61 fps
Iris Plus Graphics 640:
37 47.1 ~ 42 fps
Iris Plus Graphics 640:
17.2 21.6 ~ 19 fps
100%
Iris Plus Graphics 655:
93.7 fps
100%
Iris Plus Graphics 655:
49.6 fps
100%
Iris Plus Graphics 655:
12.4 fps
Iris Plus Graphics 640:
35.2 fps
Iris Plus Graphics 640:
28.5 fps
Average Gaming Intel Iris Plus Graphics 655 → 100% Average Gaming 30-70 fps → 100%
Average Gaming NVIDIA GeForce RTX 3050 6GB Laptop GPU → 617% Average Gaming 30-70 fps → 824%
Average Gaming Intel Iris Plus Graphics 640 → 80% Average Gaming 30-70 fps → 77%
NVIDIA GeForce RTX 3050 6GB Laptop GPU low med. high ultra QHD 4K Avatar Frontiers of Pandora 39.5 36.3 31.5 23.4 15.1 Assassin's Creed Mirage 70 63 55 41 31 Cyberpunk 2077 2.1 Phantom Liberty 61 48 40 34 21.3 F1 23 132 125 92 23 12 Returnal 40 38 34 29 F1 22 142 134 102 33 19 Tiny Tina's Wonderlands 113.3 89.7 59.2 46.4 Cyberpunk 2077 1.6 80.8 64.2 46.4 38.5 F1 2021 218 127.4 104.8 61.9 40 Strange Brigade 233 105 86 76 57.1 Far Cry 5 132 83 76 71 52 X-Plane 11.11 124 103 85 Final Fantasy XV Benchmark 123 67 49 35 Dota 2 Reborn 142 127 114 105 The Witcher 3 222 139 86 49 37 GTA V 173 172 113 60 40 < 30 fps < 60 fps < 120 fps ≥ 120 fps 2 4 10 3 7 6 7 9 3 6 5 4 7
v1.26
log 02. 12:25:11
#0 checking url part for id 8828 +0s ... 0s
#1 checking url part for id 11576 +0s ... 0s
#2 checking url part for id 7656 +0s ... 0s
#3 not redirecting to Ajax server +0s ... 0s
#4 did not recreate cache, as it is less than 5 days old! Created at Sat, 01 Jun 2024 05:39:27 +0200 +0.001s ... 0.001s
#5 composed specs +0.157s ... 0.158s
#6 did output specs +0s ... 0.158s
#7 start showIntegratedCPUs +0s ... 0.158s
#8 getting avg benchmarks for device 8828 +0.066s ... 0.224s
#9 got single benchmarks 8828 +0.037s ... 0.261s
#10 getting avg benchmarks for device 11576 +0.021s ... 0.282s
#11 got single benchmarks 11576 +0.041s ... 0.322s
#12 getting avg benchmarks for device 7656 +0.002s ... 0.324s
#13 got single benchmarks 7656 +0.024s ... 0.348s
#14 got avg benchmarks for devices +0s ... 0.348s
#15 min, max, avg, median took s +0.443s ... 0.792s
#16 before gaming benchmark output +0s ... 0.792s
#17 Got 515 rows for game benchmarks. +0.182s ... 0.973s
#18 composed SQL query for gamebenchmarks +0s ... 0.973s
#19 got data and put it in $dataArray +0.063s ... 1.036s
#20 benchmarks composed for output. +0.19s ... 1.226s
#21 calculated avg scores. +0s ... 1.226s
#22 return log +0.003s ... 1.229s
Teilen Sie diesen Artikel, um uns zu unterstützen. Jeder Link hilft!
Autor: Klaus Hinum, 8.09.2017 (Update: 1.07.2023)
 Deutsch
 English
 Español
 Français
 Italiano
 Nederlands
 Polski
 Português
 Русский
 Türkçe
 Svenska
 Chinese
 Magyar