Notebookcheck Logo

Borderlands 3 Notebook- und Desktop-Benchmarks

Ein bisschen Spaß muss sein. Mit Borderlands 3 setzt Gearbox die Tradition der Loot-Shooter-Reihe nahtlos fort: Knallbunte Comic-Grafik und überbordende Action sollen bei der Spielerschaft für Popkorn-Stimmung sorgen. Ob die Technik auch Jubelstürme erzeugt, klären wir in unserem Benchmark-Check.
Borderlands 3

Technik

Auch wenn die Story etwas hinter den Erwartungen respektive Möglichkeiten zurückbleibt, liefert Gearbox genau das Erlebnis, das sich ein Großteil der Spieler erhofft und gewünscht hat. In einer postapokalyptischen Welt tritt man alleine oder im Team mit mehreren Freunden gegen allerlei Banditen und Bestien an.

Besonders gut ist den Entwicklern dabei erneut das Bewegungsgefühl gelungen. Ähnlich wie beispielsweise Doom vom Shooter-Experten id Software steuert sich der Titel – genug Grafikpower vorausgesetzt – extrem flüssig und geht locker flockig von der Hand. Das hohe Spieltempo gepaart mit der irren Aktion, den reichhaltigen Effekten und der Hatz nach immer besserer Ausrüstung hat echtes Suchtpotenzial.

Borderlands 3
Borderlands 3
Borderlands 3
Borderlands 3
Borderlands 3
Borderlands 3

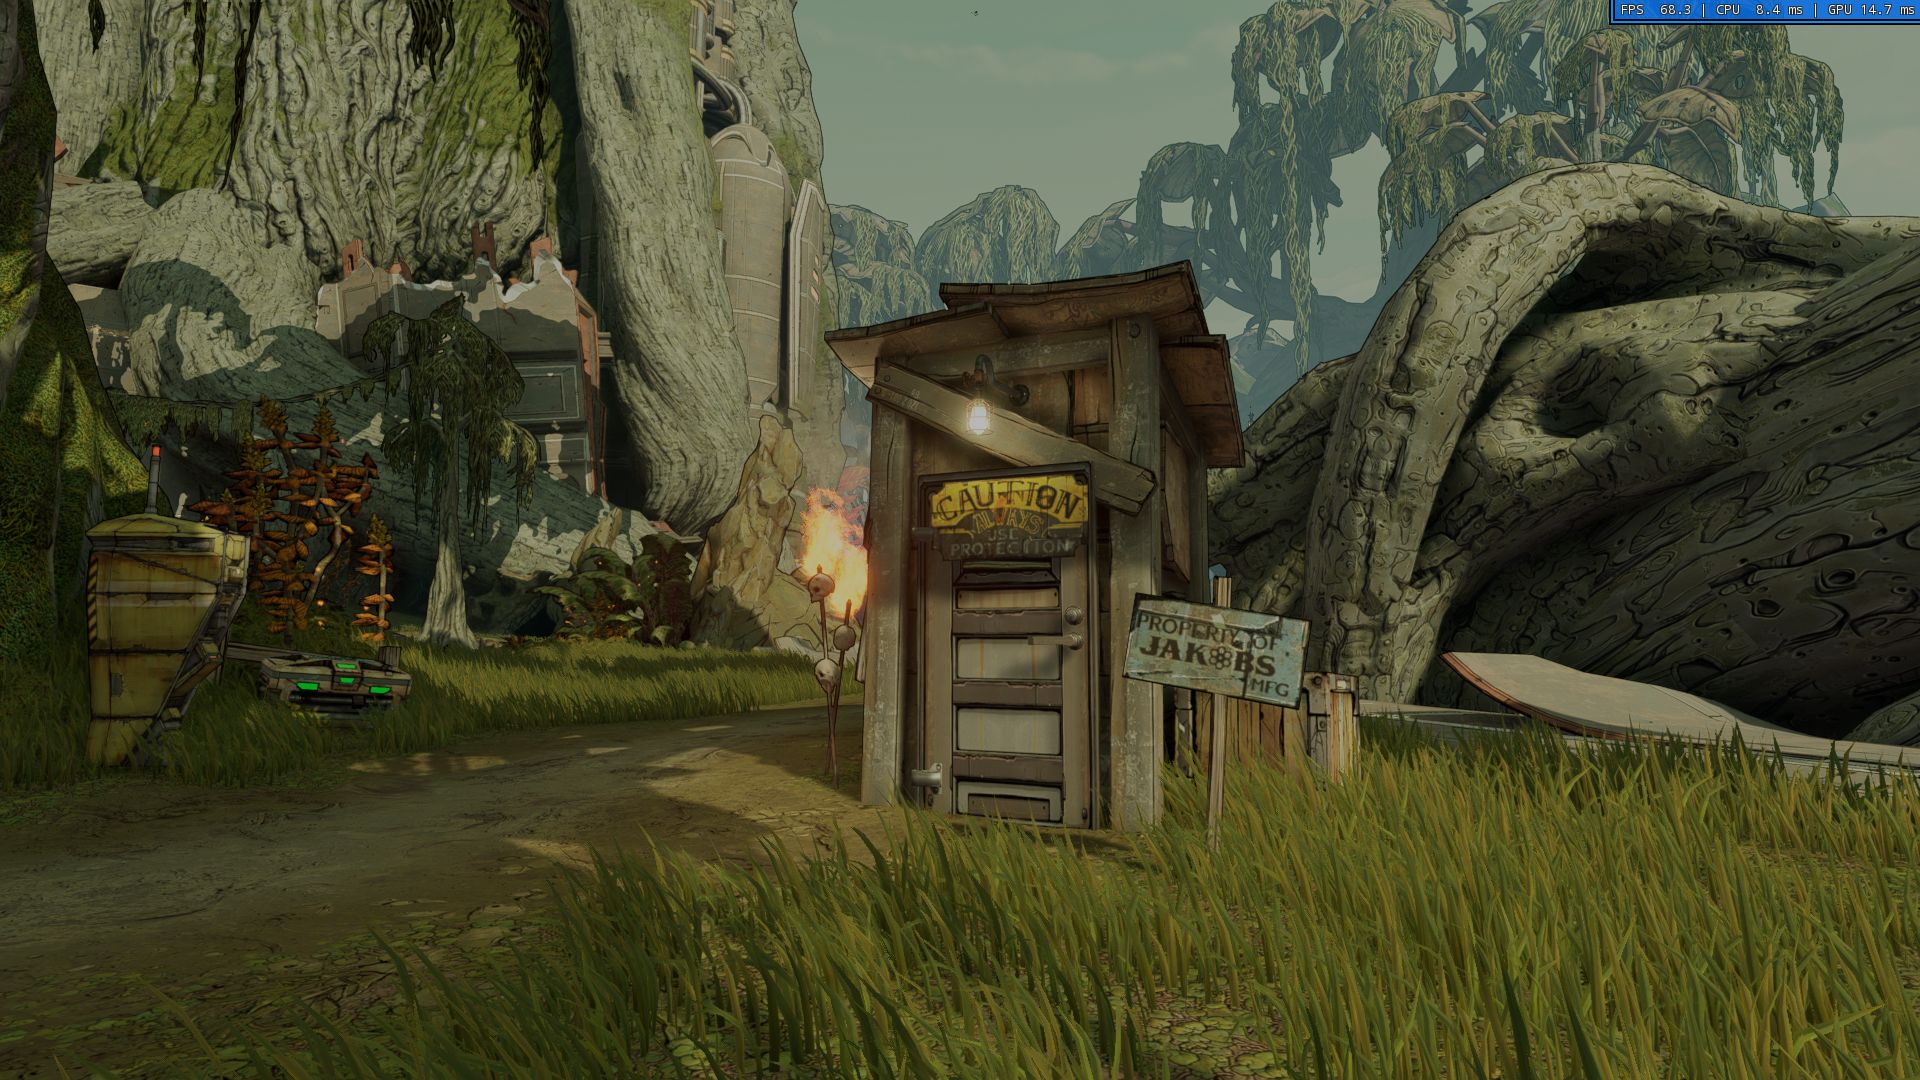
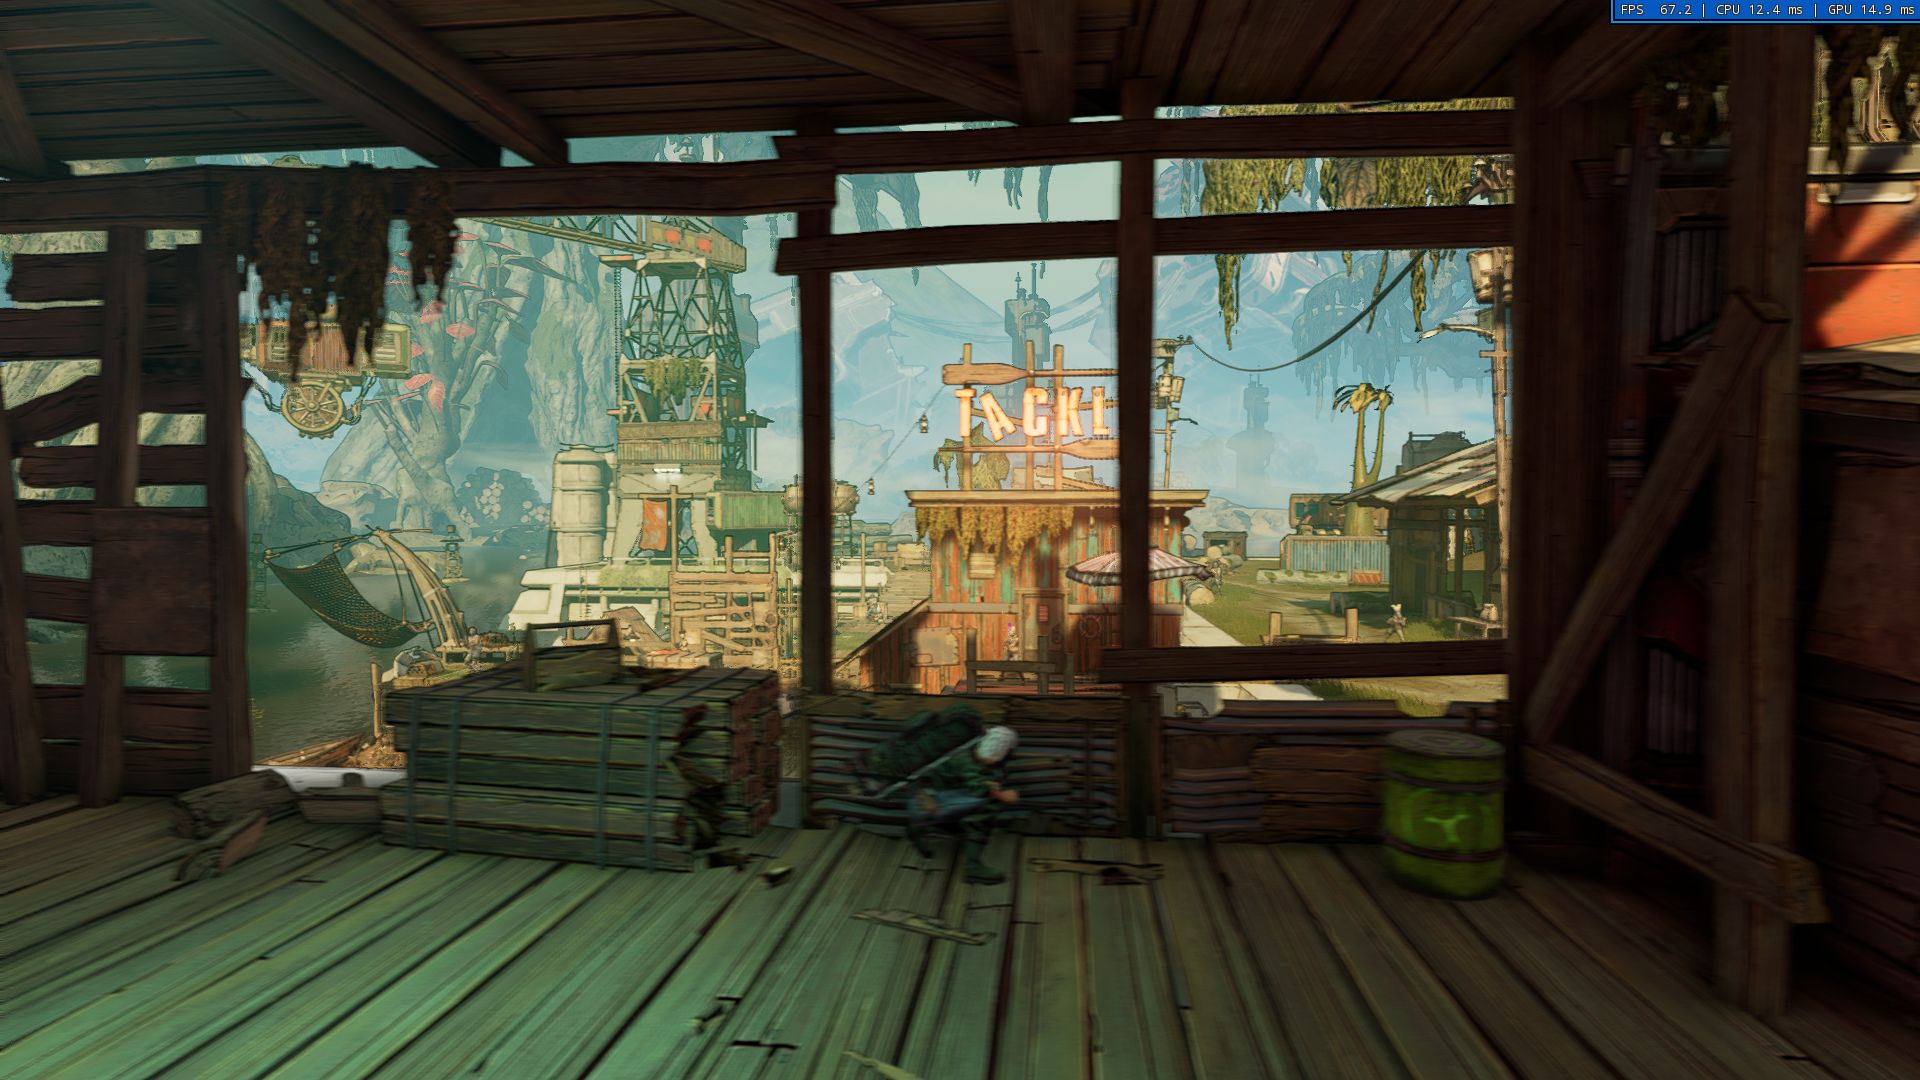
Leider kann der ganze Bombast nur bedingt über manch technische Schwäche hinwegtrösten. Zwar weiß die Grafik im Cel-Shading-Look auf den ersten Blick durchaus zu gefallen, bei genauerer Betrachtung offenbart Borderlands 3 jedoch eine ziemlich maue Texturqualität. Für einen Shooter aus dem Jahr 2019 machen die meisten Objektoberflächen einen recht matschigen Eindruck. Die Beleuchtung ist ebenfalls nicht mehr auf der Höhe der Zeit. Die zugrunde liegende Unreal Engine 4 wirkt inzwischen etwas angestaubt – zumindest, wenn man Borderlands 3 als Grundlage nimmt.

Borderlands 3
Borderlands 3
Borderlands 3
Borderlands 3
Borderlands 3
Borderlands 3

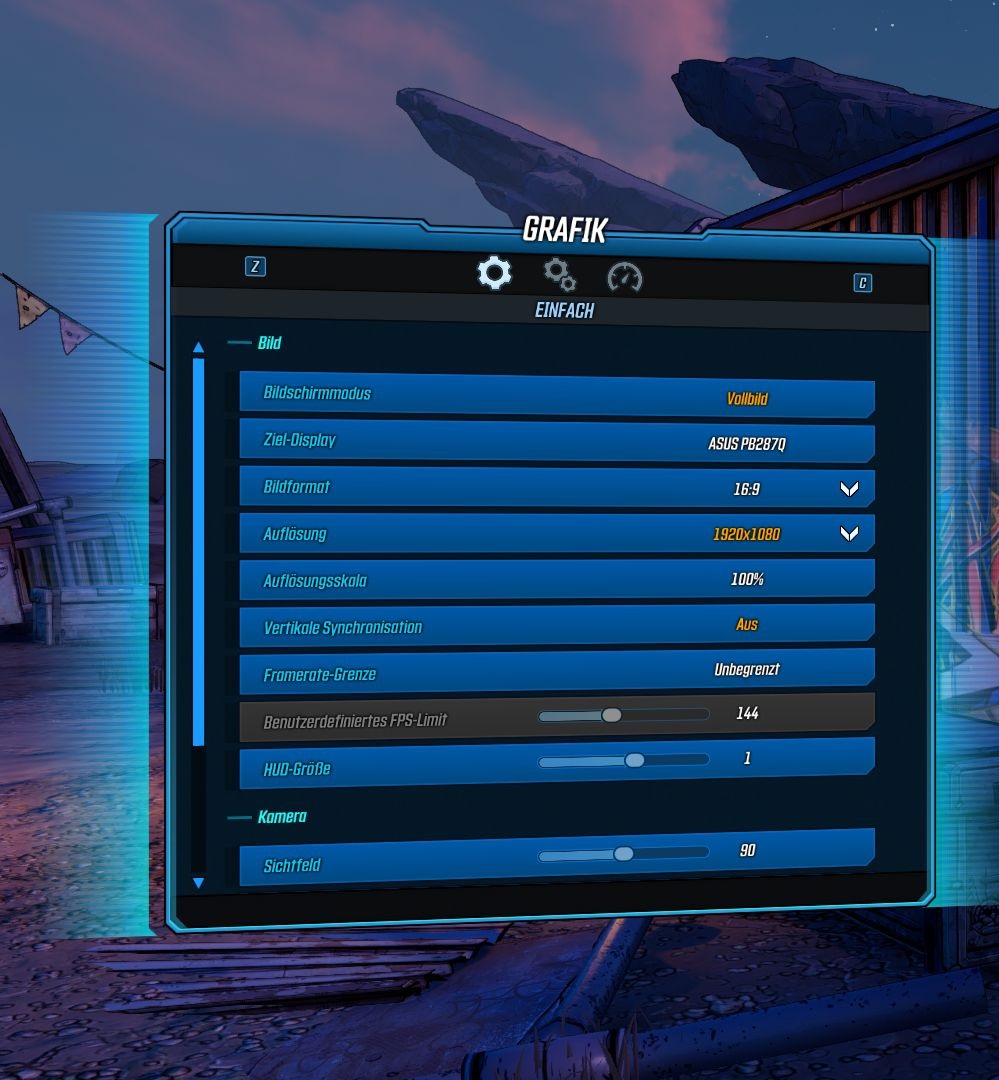
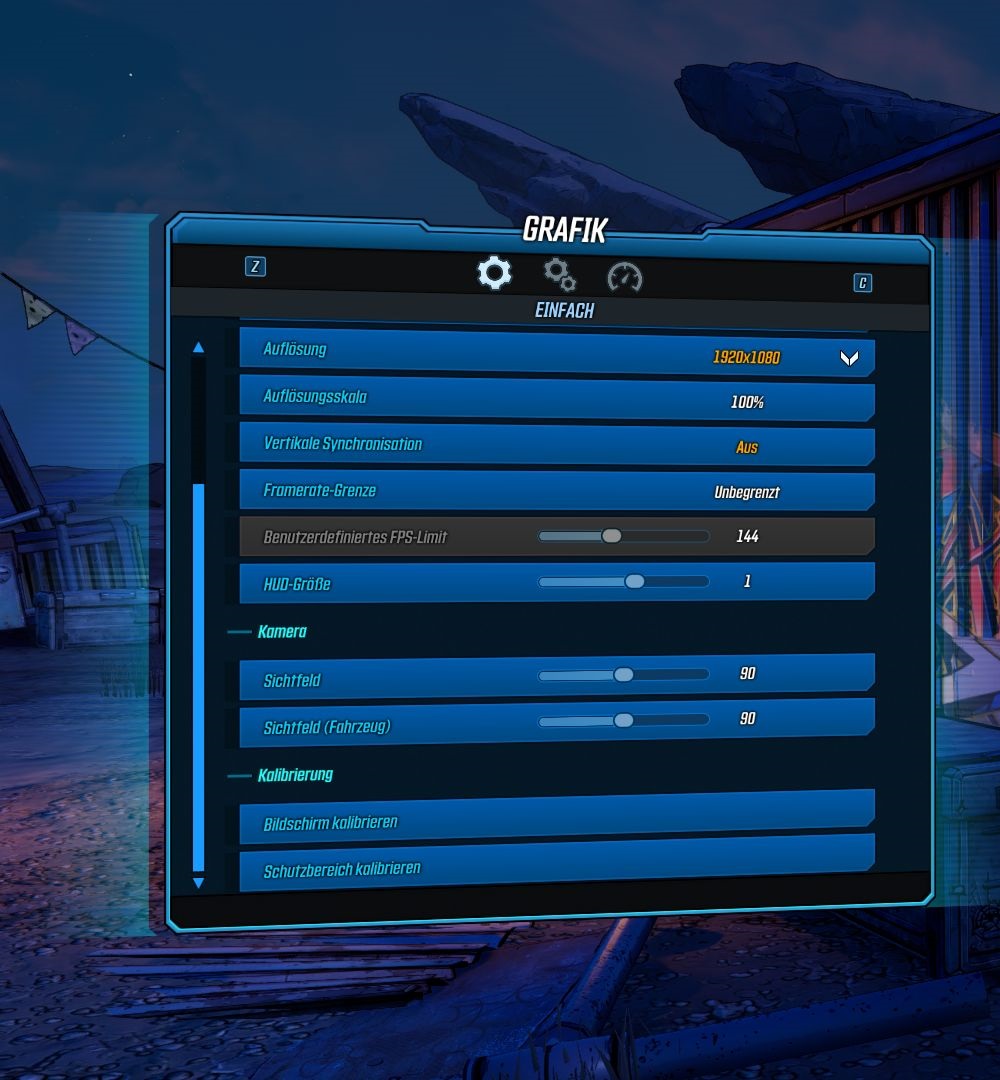
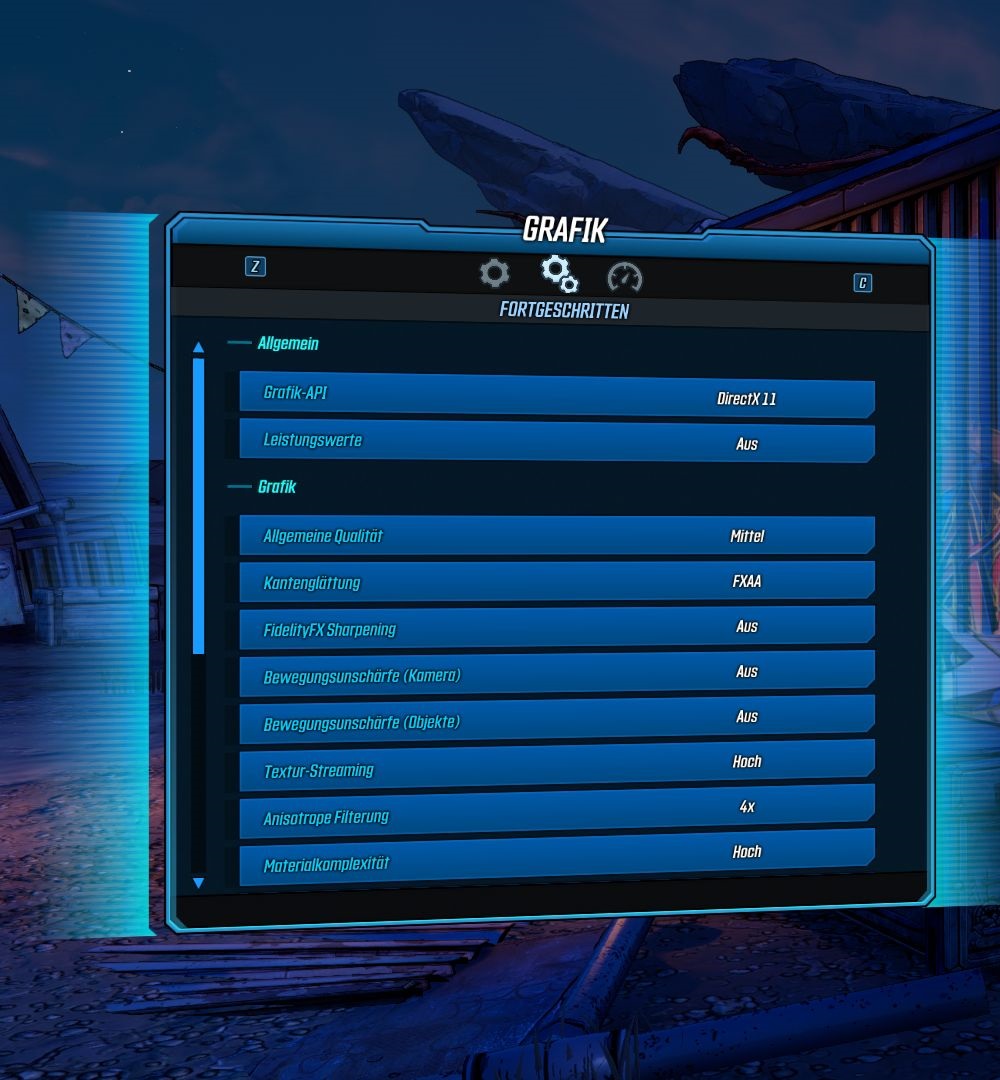
Wenig zu meckern gibt es beim Thema Grafikoptionen. Aufgrund der schieren Masse hat Gearbox die Einstellungen in zwei Menüs aufgeteilt. Angefangen mit dem Basic-Reiter, der sich nicht zuletzt um die Auflösung und deren Skalierung, den Bildmodus bzw. das Bildformat, das Sichtfeld, die HUD-Größe und die vertikale Synchronisation kümmert. Hier findet man auch ein optionales Framerate-Lock, das für unsere Tests natürlich deaktiviert war.

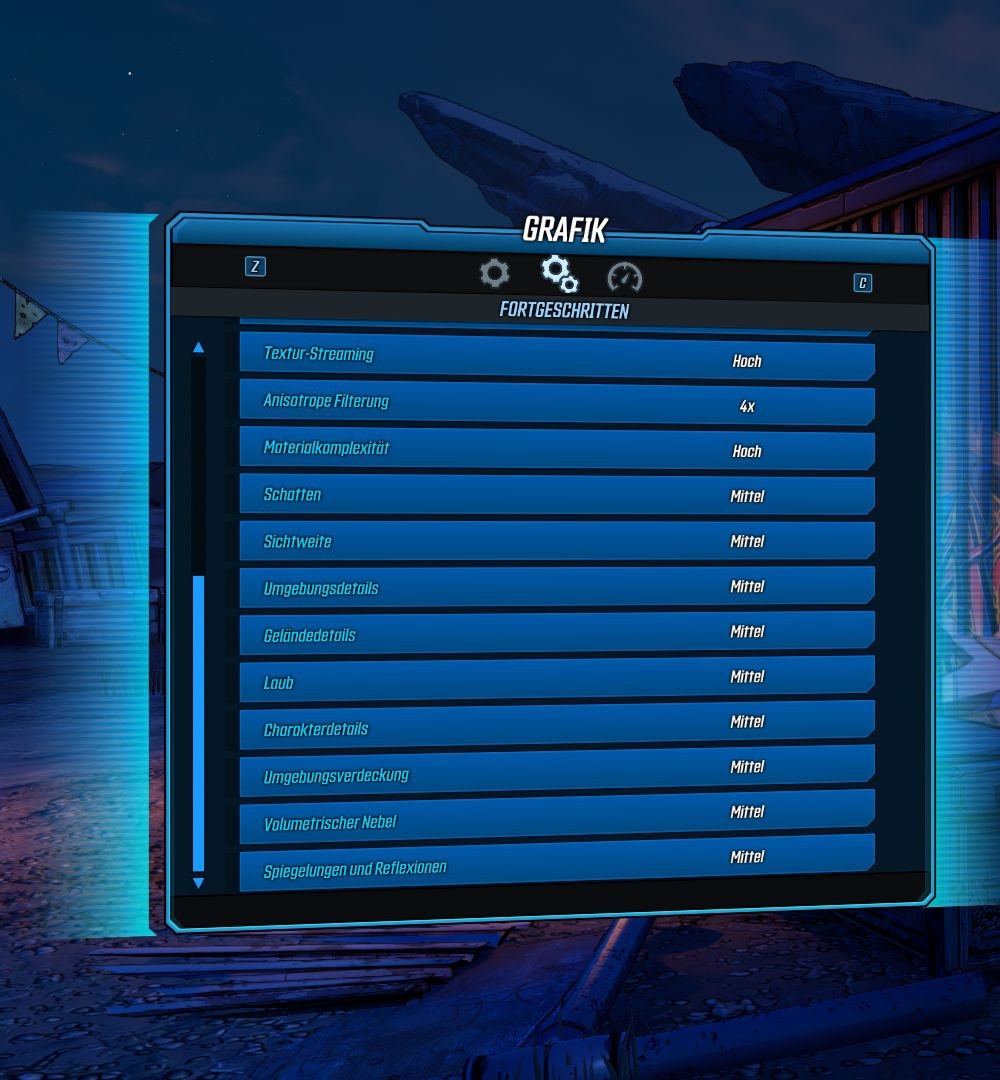
Noch umfangreicher geht es im Advanced-Menü zu, das üppige 16 Einzelsettings enthält, welche sich per Overall Quality global in einem Rutsch anpassen lassen. Insgesamt stehen 6 Presets zur Verfügung, die von Very Low bis hin zu Badass reichen.

Borderlands 3
Borderlands 3
Borderlands 3
Borderlands 3
Borderlands 3
Borderlands 3

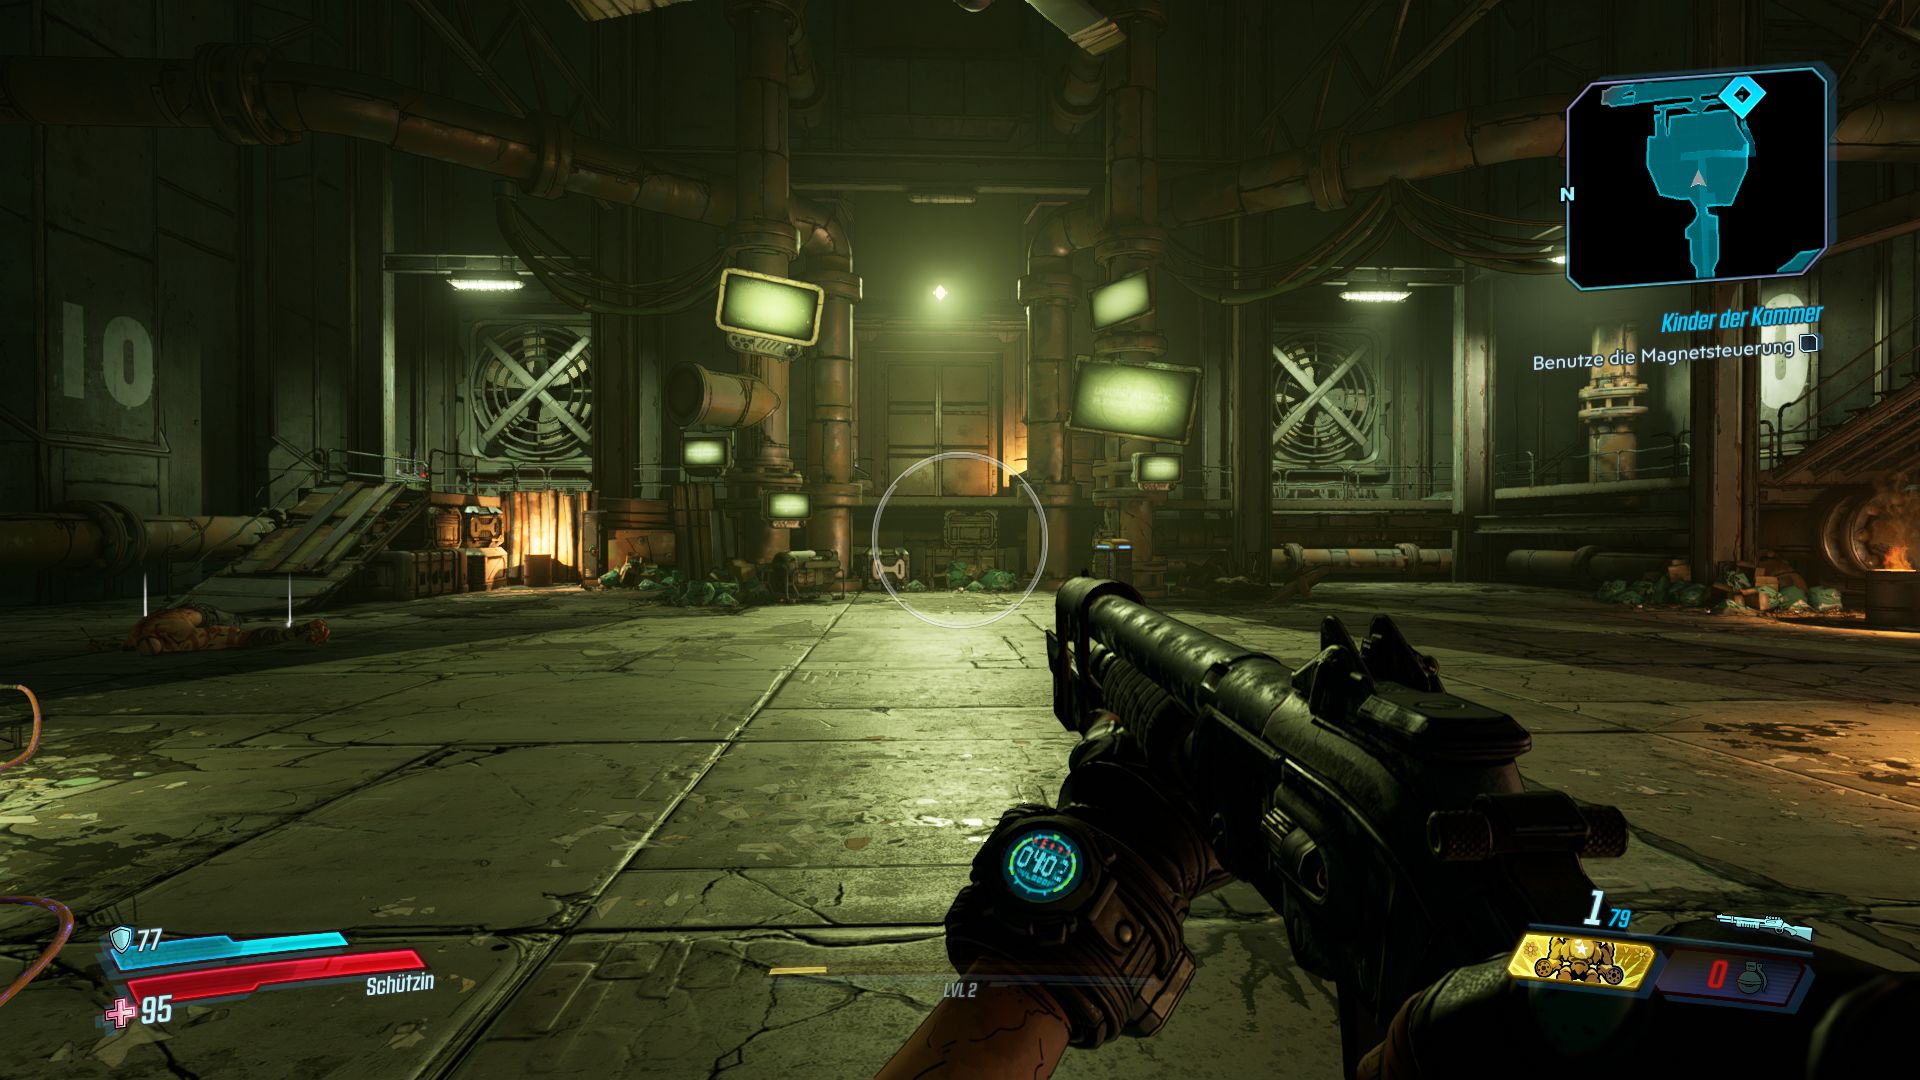
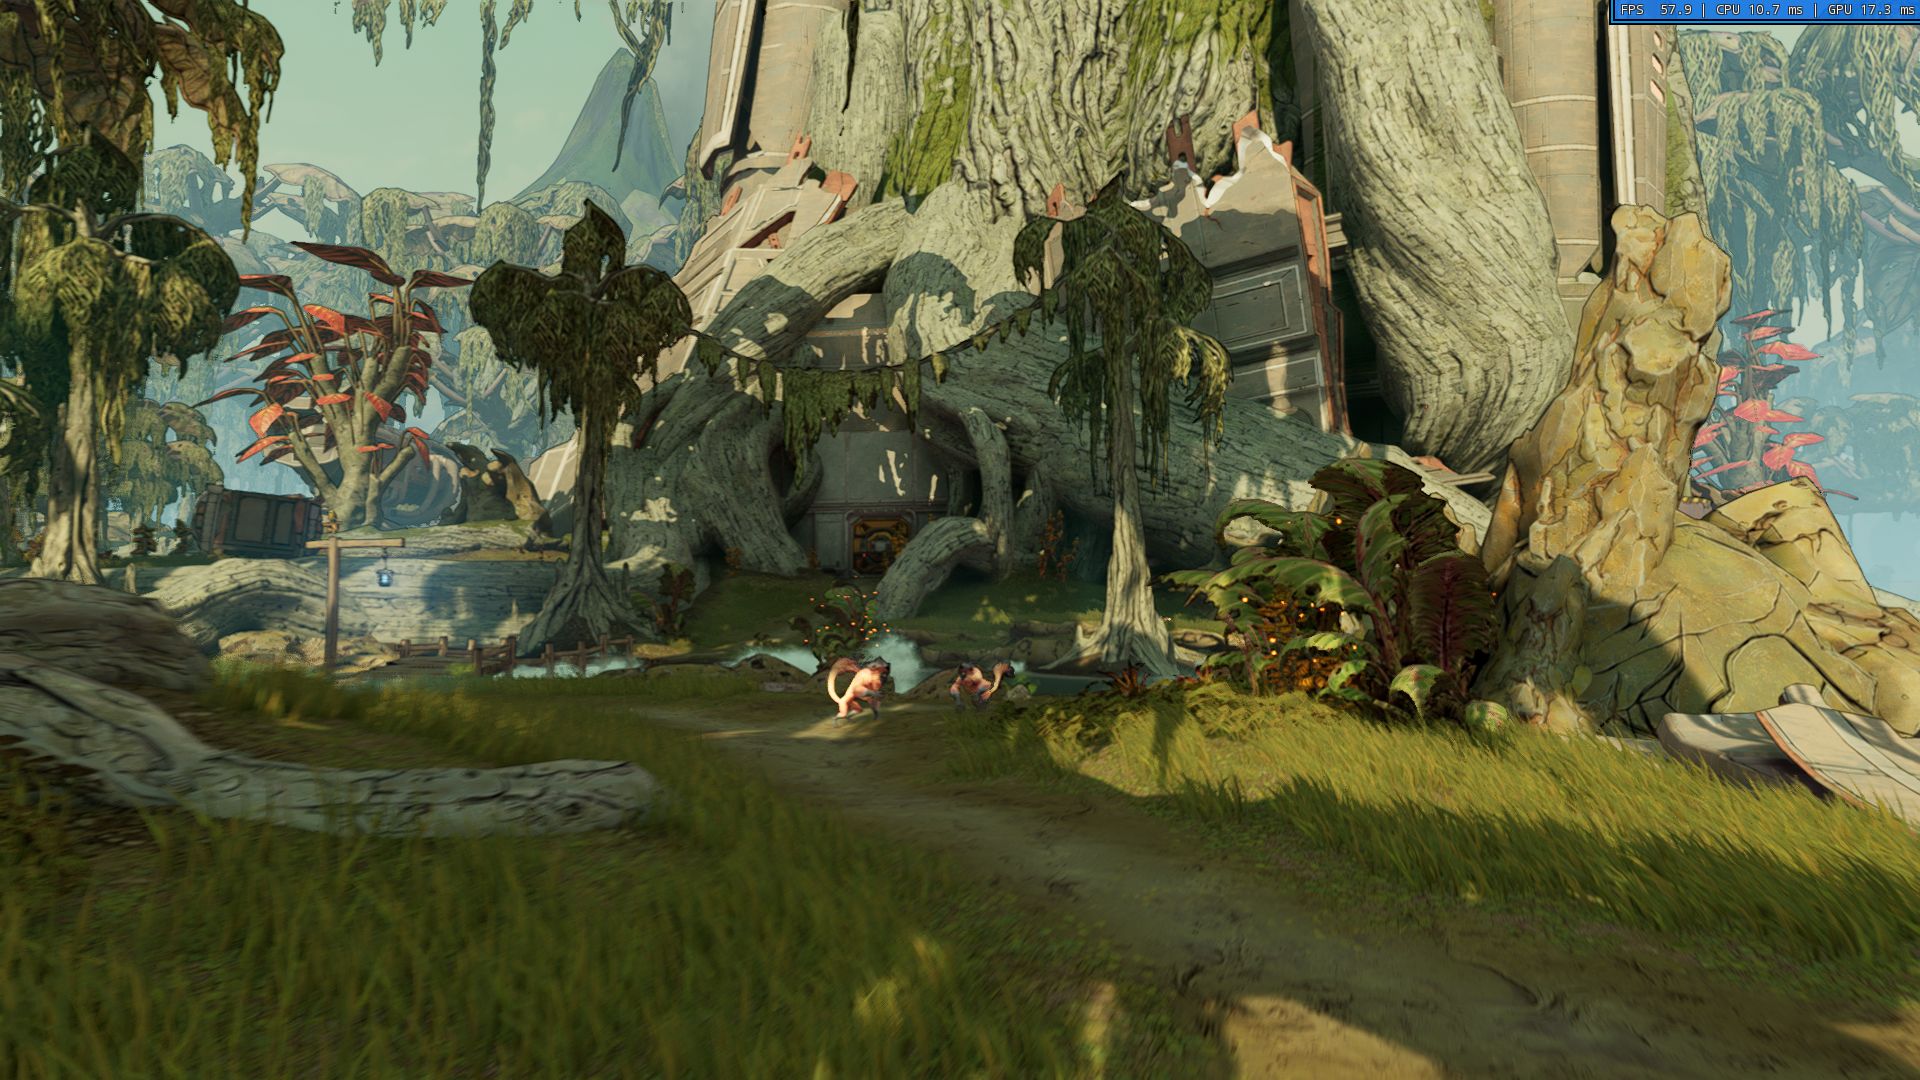
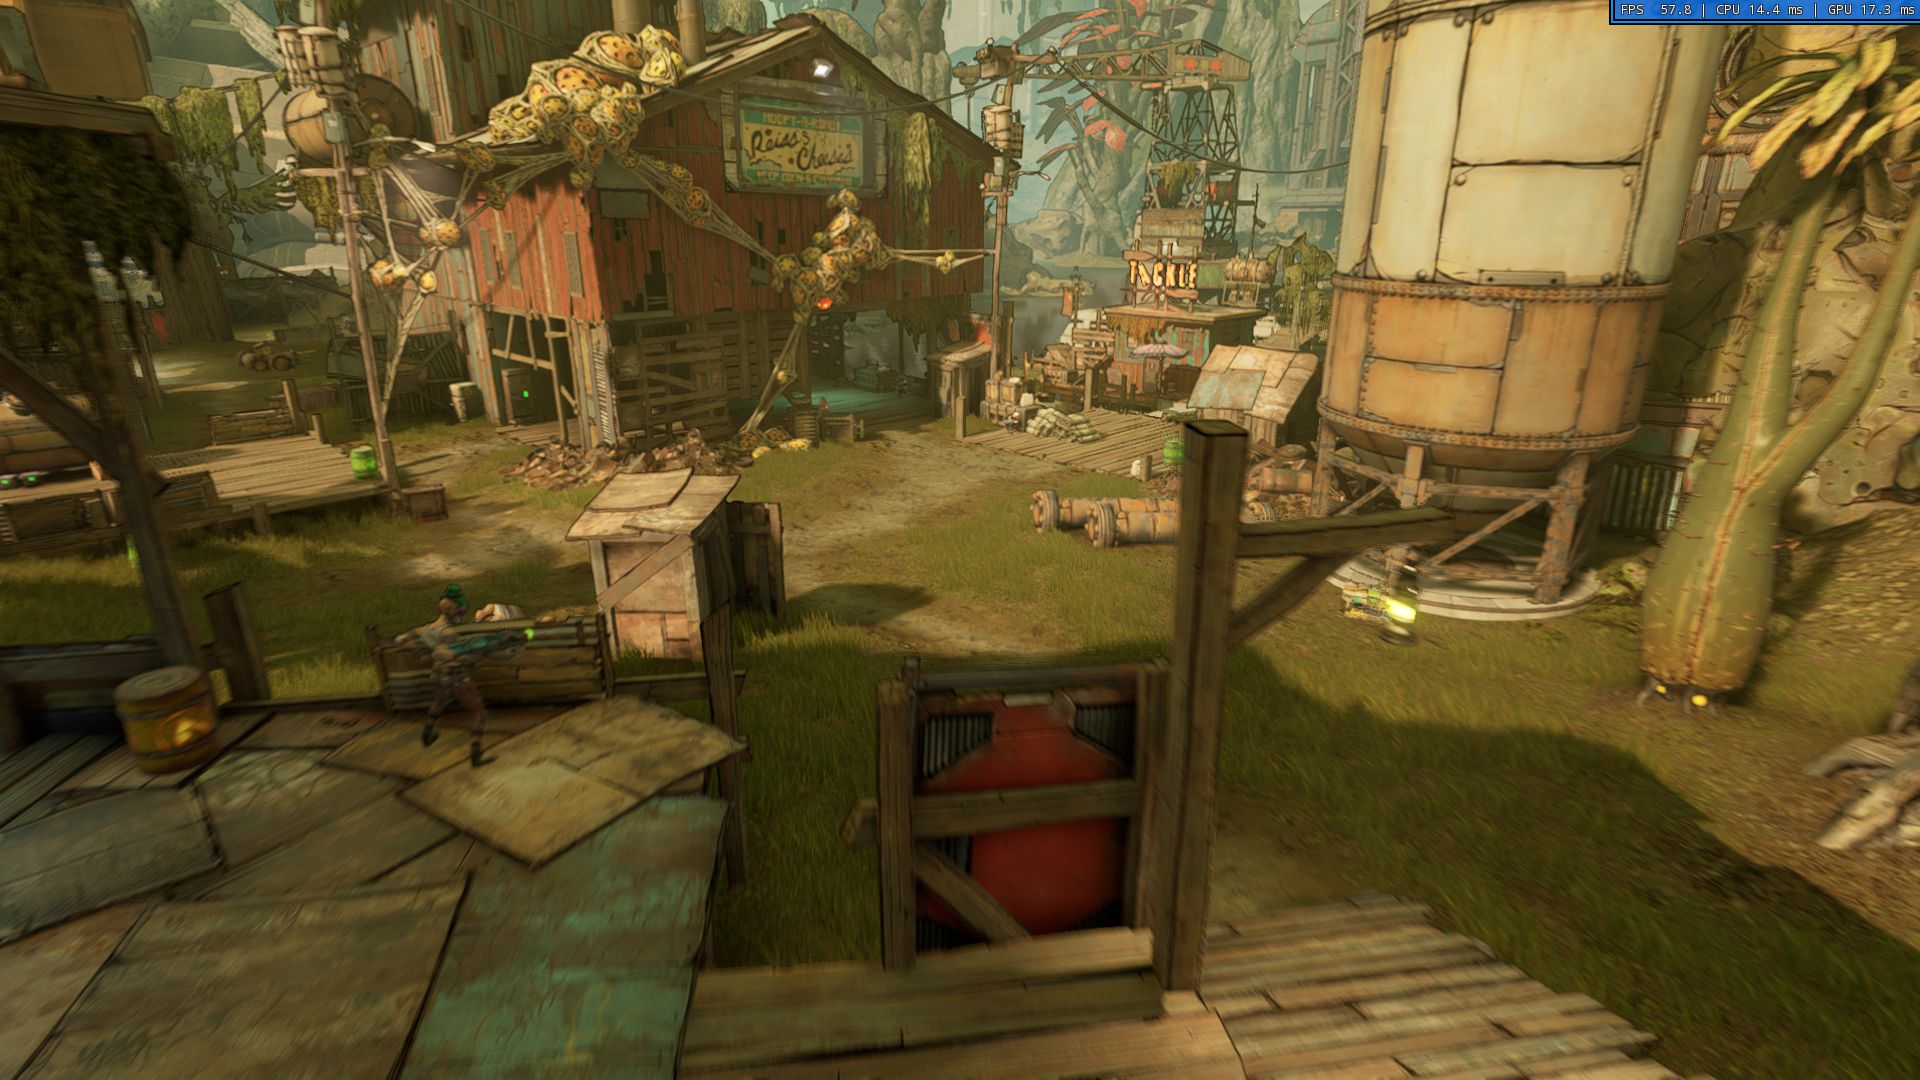
Wie man auf den Screenshots weiter unten erkennen kann, verliert das Spiel bei minimalen Settings spürbar an Reiz. Ab mittleren Details würden wir von einer ansehnlichen Optik sprechen, wobei die höheren Stufen mit Ausnahme der Schattenqualität und der Vegetationsdichte kaum noch für eine Verbesserung sorgen.

Schön: Änderungen werden direkt übernommen, so dass man das Spiel nicht neu starten muss. Die Erläuterungstexte zu den verschiedenen Optionen verdienen ebenfalls Lob. Weniger gut schneidet laut diversen Berichten der DirectX-12-Modus ab. Aus diesem Grund verwendeten wir durchgehend das klassische DirectX 11.

Borderlands 3
Borderlands 3
Borderlands 3
Borderlands 3
Borderlands 3

Aktuell hat Borderlands 3 allerdings auch im DX11-Modus mit gewissen Schwierigkeiten zu kämpfen. Wenn es nach unseren Tests geht, kommt es – unabhängig von der verbauten Hardware und den gewählten Settings – hin und wieder zu kurzen Zwischenrucklern und seltsamen Performance-Schwankungen. Von Abstürzen, wie sie viele Käufer berichten, blieben wir indes verschont.

Generell erscheinen die Hardware-Anforderungen in Relation zur Grafikqualität etwas heftig. Mit ein wenig mehr Optimierungsarbeit hätte man zum Release ein „runderes“ und ausgereifteres Game präsentieren können. Es ist jedoch davon auszugehen, dass Gearbox die Performance mit kommenden Patches noch verbessert.

Very Low Preset
Very Low Preset
Medium Preset
Medium Preset
High Preset
High Preset
Badass Preset
Badass Preset

Benchmark

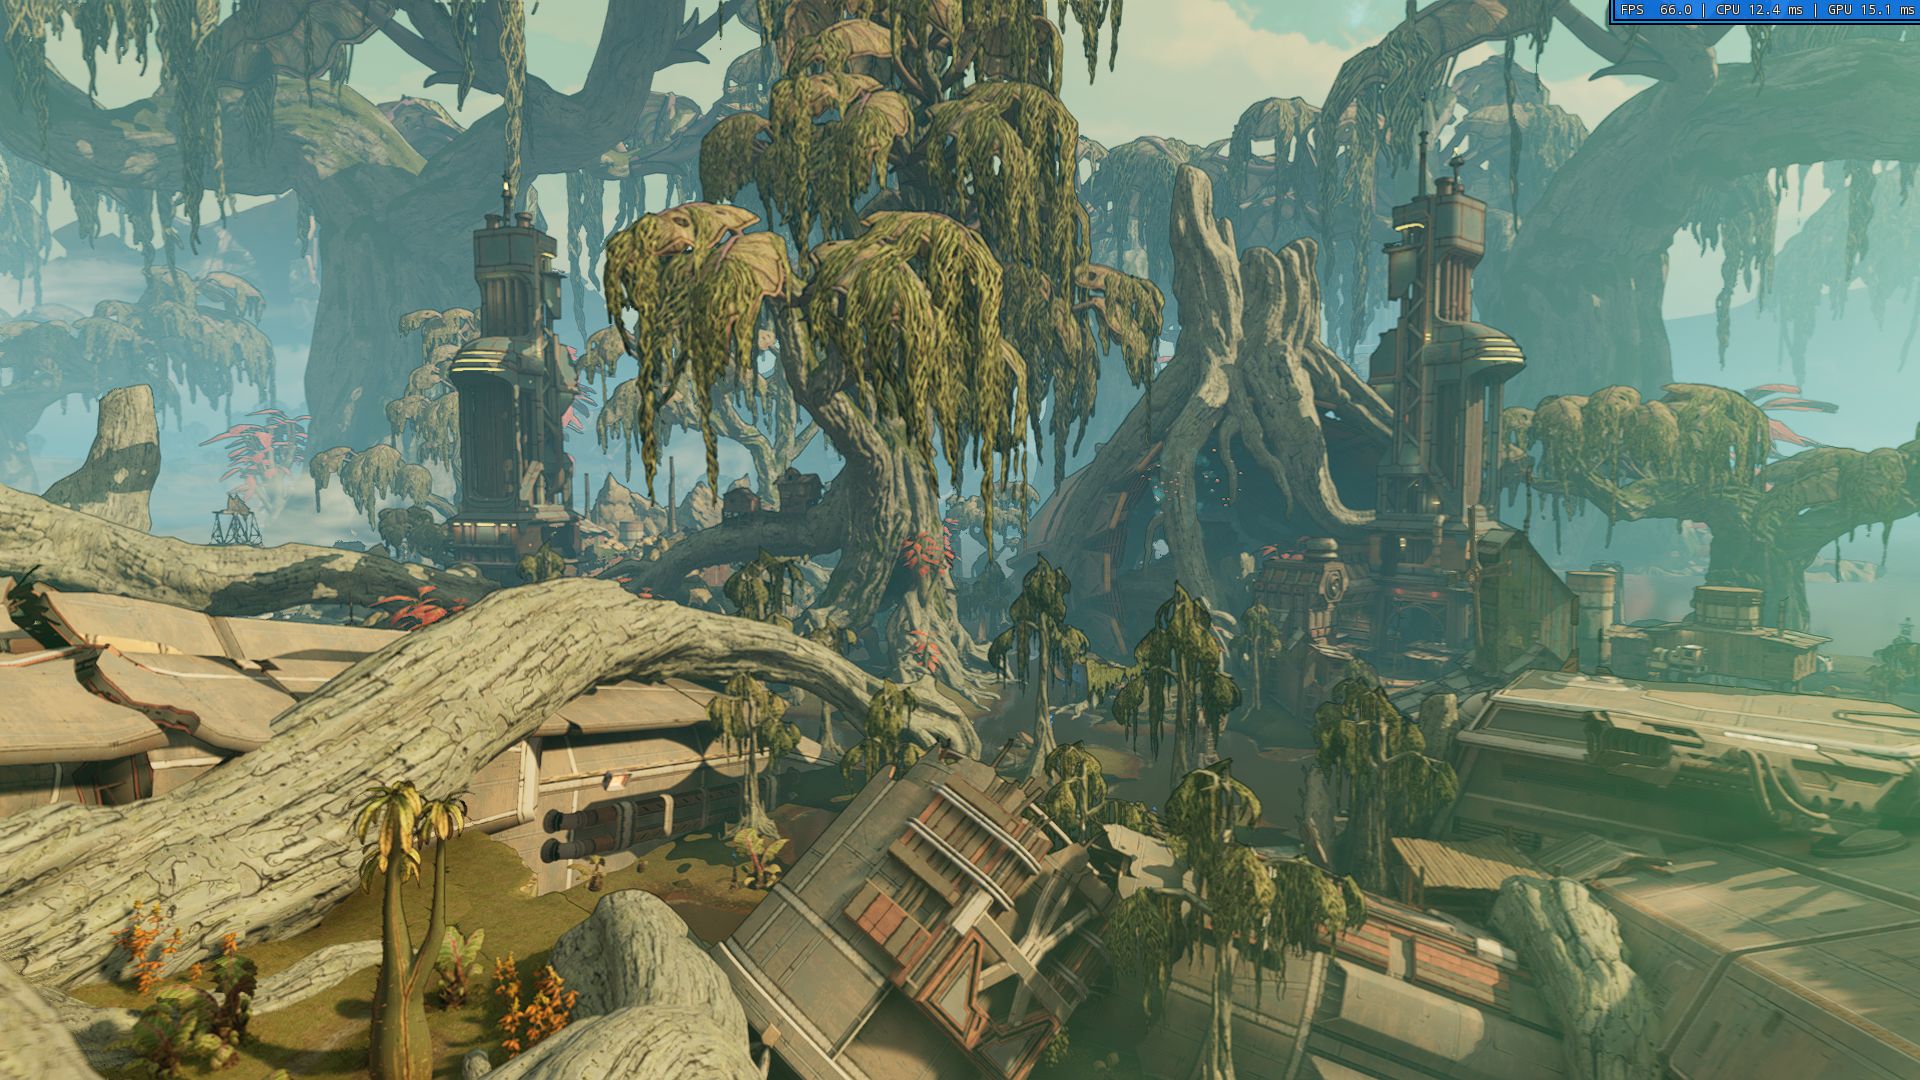
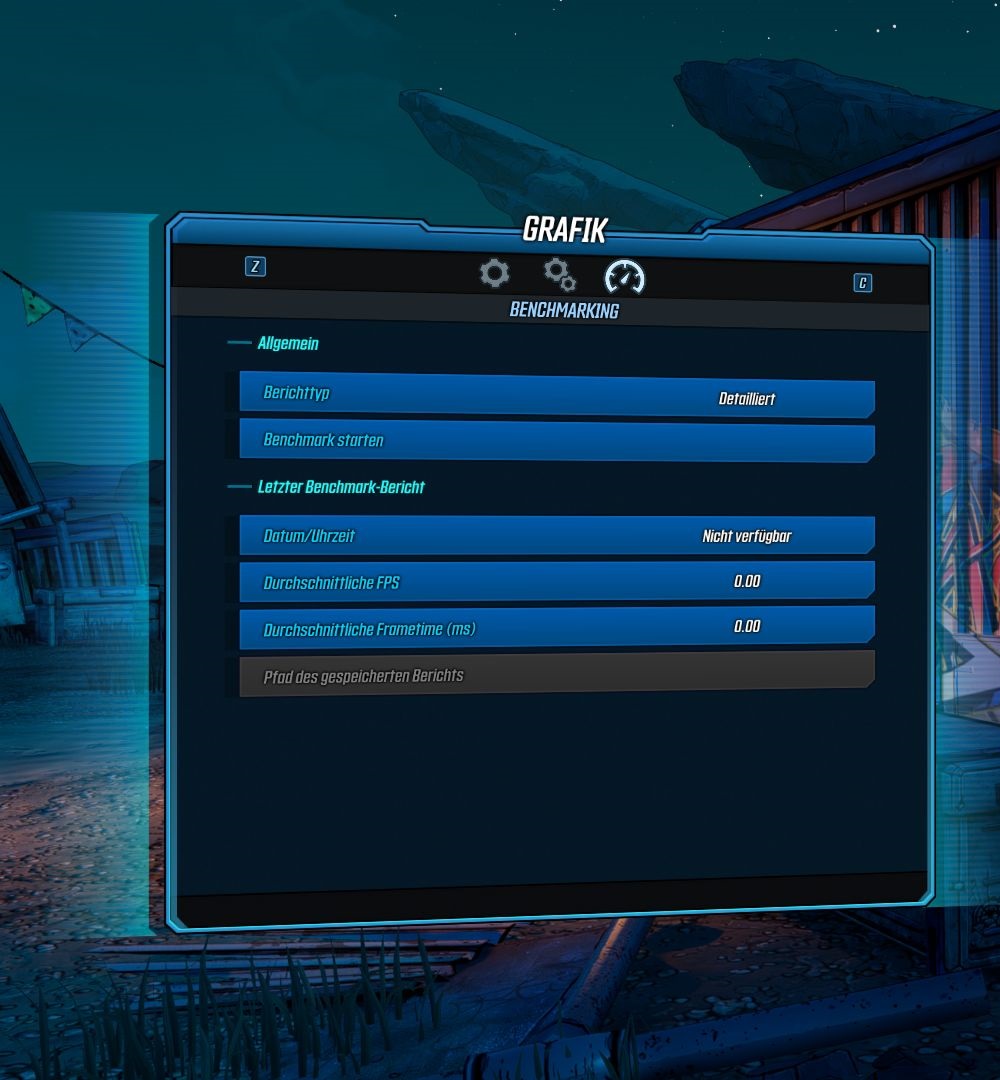
Respekt gebührt den Entwicklern für den eingebauten Benchmark, der Geschwindigkeitsmessungen deutlich erleichtert und faire Vergleichsbedingungen garantiert. In der knapp zweiminütigen Sequenz (siehe Video) erleben wir eine schicke Kamerafahrt durch die teils dicht bewaldete Ödnis, welche von einigen Figuren und Feuergefechten aufgelockert wird.

Basierend auf unseren bisherigen Erfahrungen ist die Framerate im Benchmark (wohl bedingt durch den abweichenden Kamerawinkel) etwas niedriger als im „normalen“ Game. Letzteres läuft im Schnitt ca. 10-20 % flotter, weshalb ein Benchmark-Ergebnis von 40+ FPS für eine ausreichende Leistung spricht. Top: Wer möchte, kann sich vom Spiel einen einfachen oder detaillierten Benchmark-Bericht anlegen lassen. Die Framerate wird während des Benchmarks sowieso eingeblendet.

Resultate

HD (1.280 x 720)

Wie bereits angedeutet, ist Borderlands 3 recht anspruchsvoll, was die Hardware betrifft. Selbst wenn man die Auflösung auf 1.280 x 720 herunterschraubt und minimale Settings nutzt, sind Einsteiger-Chips auf dem Level der Radeon RX Vega 8 tendenziell überfordert. Für diese Einstellungen sollte es zumindest eine ältere Midrange-GPU sein (z. B. die GTX 950M). Falls Sie sich über das Ranking in der HD-Tabelle wundern: Oberhalb einer bestimmten Grafikpower läuft Borderlands 3 ins CPU-Limit.

Borderlands 3
    1280x720 Very Low Overall Quality (DX11)
NVIDIA GeForce RTX 2080 Mobile
MSI GT76 Titan DT 9SG, i9-9900K
150 fps ∼48%
NVIDIA GeForce GTX 1080 (Desktop)
MSI GeForce GTX 1080, i9-9900K
142 fps ∼46%
NVIDIA GeForce GTX 1070 (Desktop)
MSI GeForce GTX 1070, i9-9900K
141 fps ∼45%
NVIDIA GeForce GTX 1060 (Desktop)
NVIDIA GeForce GTX 1060, i9-9900K
139 fps ∼45%
NVIDIA GeForce RTX 2060 (Desktop)
MSI GeForce RTX 2060, i9-9900K
139 fps ∼45%
NVIDIA GeForce RTX 2080 (Desktop)
MSI GeForce RTX 2080, i9-9900K
139 fps ∼45%
NVIDIA GeForce RTX 2070 (Desktop)
MSI GeForce RTX 2070, i9-9900K
138 fps ∼45%
NVIDIA GeForce GTX 1660 Ti Mobile
MSI GP65 Leopard 9SD, i7-9750H
131 fps ∼42%
NVIDIA GeForce RTX 2060 Mobile
MSI GE65 Raider 9SE, i7-9750H
129 fps ∼42%
NVIDIA GeForce RTX 2070 Mobile
MSI GP65 Leopard 9SF, i7-9750H
125 fps ∼40%
NVIDIA GeForce GTX 1650 Mobile
MSI GP75 Leopard 9SC, i7-9750H
124 fps ∼40%
NVIDIA GeForce GTX 1080 Mobile
Alienware 17 R4, i7-7820HK
113 fps ∼36%
NVIDIA GeForce GTX 1070 Mobile
Asus G752VS, 6820HK
99.1 fps ∼32%
NVIDIA GeForce GTX 1060 Mobile
MSI GT62VR, 6820HK
92.9 fps ∼30%
NVIDIA GeForce GTX 1050 Ti Mobile
MSI GE72 7RE, i7-7700HQ
91.2 fps ∼29%
AMD Radeon RX 460 (Desktop)
XFX RX-460P4DFG5 Double Dissipation 4 GB, Asus X299 Prime , i7-7740X
90 fps ∼29%
NVIDIA GeForce GTX 1050 Mobile
Asus GL753VD, i7-7700HQ
77.3 fps ∼25%
NVIDIA GeForce GTX 965M
MSI GE72 965M Ti, 6700HQ
64.8 fps ∼21%
AMD Radeon RX Vega 8 (Ryzen 2000/3000)
Honor Magicbook, R5 2500U
32 fps ∼10%

FHD (1.920 x 1.080)

Ab 1.920 x 1.080 Pixeln und mittleren Details ist im Endeffekt ein waschechtes Gaming-Modell nötig. Genügt für das Preset Medium noch eine GeForce GTX 1050 Ti, raten wir bei hohen Details mindestens zu einer GeForce GTX 1060 oder GTX 1650. Maximale Details erfordern derweil eine GeForce GTX 1070 bzw. GTX 1660 Ti oder schneller.

Borderlands 3
    1920x1080 Medium Overall Quality (DX11)     1920x1080 High Overall Quality (DX11)     1920x1080 Badass Overall Quality (DX11)
NVIDIA GeForce RTX 2080 Mobile, i9-9900K
MSI GT76 Titan DT 9SG
132 fps ∼48%
103 fps ∼40%
81.9 fps ∼34%
NVIDIA GeForce RTX 2080 (Desktop), i9-9900K
MSI GeForce RTX 2080
124 fps ∼45%
107 fps ∼42%
89.8 fps ∼37%
NVIDIA GeForce RTX 2070 (Desktop), i9-9900K
MSI GeForce RTX 2070
120 fps ∼44%
93.7 fps ∼37%
74.4 fps ∼31%
NVIDIA GeForce GTX 1080 (Desktop), i9-9900K
MSI GeForce GTX 1080
118 fps ∼43%
89.2 fps ∼35%
70.2 fps ∼29%
NVIDIA GeForce RTX 2060 (Desktop), i9-9900K
MSI GeForce RTX 2060
116 fps ∼42%
82.8 fps ∼32%
64 fps ∼26%
NVIDIA GeForce RTX 2070 Mobile, i7-9750H
MSI GP65 Leopard 9SF
110 fps ∼40%
83 fps ∼33%
64.5 fps ∼27%
NVIDIA GeForce GTX 1070 (Desktop), i9-9900K
MSI GeForce GTX 1070
106 fps ∼39%
74.6 fps ∼29%
57.9 fps ∼24%
NVIDIA GeForce RTX 2060 Mobile, i7-9750H
MSI GE65 Raider 9SE
100 fps ∼37%
69.6 fps ∼27%
53.2 fps ∼22%
NVIDIA GeForce GTX 1660 Ti Mobile, i7-9750H
MSI GP65 Leopard 9SD
96 fps ∼35%
64.2 fps ∼25%
48.6 fps ∼20%
NVIDIA GeForce GTX 1080 Mobile, i7-7820HK
Alienware 17 R4
95.1 fps ∼35%
78.9 fps ∼31%
62.3 fps ∼26%
NVIDIA GeForce GTX 1070 Mobile, 6820HK
Asus G752VS
83.4 fps ∼31%
66.4 fps ∼26%
52.2 fps ∼22%
NVIDIA GeForce GTX 1060 (Desktop), i9-9900K
NVIDIA GeForce GTX 1060
77.7 fps ∼28%
51.1 fps ∼20%
39 fps ∼16%
NVIDIA GeForce GTX 1060 Mobile, 6820HK
MSI GT62VR
67.1 fps ∼25%
45.6 fps ∼18%
34.7 fps ∼14%
NVIDIA GeForce GTX 1650 Mobile, i7-9750H
MSI GP75 Leopard 9SC
64.3 fps ∼24%
41 fps ∼16%
30.7 fps ∼13%
NVIDIA GeForce GTX 1050 Ti Mobile, i7-7700HQ
MSI GE72 7RE
44.6 fps ∼16%
28.1 fps ∼11%
20.1 fps ∼8%
NVIDIA GeForce GTX 965M, 6700HQ
MSI GE72 965M Ti
38 fps ∼14%
24.7 fps ∼10%
18.7 fps ∼8%
AMD Radeon RX 460 (Desktop), i7-7740X
XFX RX-460P4DFG5 Double Dissipation 4 GB, Asus X299 Prime
37.6 fps ∼14%
23 fps ∼9%
17.4 fps ∼7%
NVIDIA GeForce GTX 1050 Mobile, i7-7700HQ
Asus GL753VD
36 fps ∼13%
22.7 fps ∼9%
16.4 fps ∼7%
AMD Radeon RX Vega 8 (Ryzen 2000/3000), R5 2500U
Honor Magicbook
13.7 fps ∼5%
9.1 fps ∼4%
6.5 fps ∼3%

QHD (2.560 x 1.440) & UHD (3.840 x 2.160)

Richtig knackig wird es bei einer Kombination aus 2.560 x 1.440 Pixeln und dem Badass-Preset. Hier kommt man nicht um einen teuren High-End-Vertreter auf dem Niveau der GeForce GTX 1080 oder RTX 2070 herum. 3.840 x 2.160 Pixel sind in maximalen Settings aktuell für jeden Notebook-Chip zu viel des Guten.

Borderlands 3
    2560x1440 Badass Overall Quality (DX11)     3840x2160 Badass Overall Quality (DX11)
NVIDIA GeForce RTX 2080 (Desktop), i9-9900K
MSI GeForce RTX 2080
65.4 fps ∼29%
35.4 fps ∼25%
NVIDIA GeForce RTX 2080 Mobile, i9-9900K
MSI GT76 Titan DT 9SG
58.6 fps ∼26%
31.9 fps ∼22%
NVIDIA GeForce RTX 2070 (Desktop), i9-9900K
MSI GeForce RTX 2070
52.6 fps ∼23%
28.5 fps ∼20%
NVIDIA GeForce GTX 1080 (Desktop), i9-9900K
MSI GeForce GTX 1080
49.4 fps ∼22%
26.5 fps ∼18%
NVIDIA GeForce GTX 1080 Mobile, i7-7820HK
Alienware 17 R4
46.4 fps ∼21%
24.9 fps ∼17%
NVIDIA GeForce RTX 2070 Mobile, i7-9750H
MSI GP65 Leopard 9SF
45.1 fps ∼20%
24.2 fps ∼17%
NVIDIA GeForce RTX 2060 (Desktop), i9-9900K
MSI GeForce RTX 2060
44.1 fps ∼20%
19.5 fps ∼14%
NVIDIA GeForce GTX 1070 (Desktop), i9-9900K
MSI GeForce GTX 1070
40 fps ∼18%
21.4 fps ∼15%
NVIDIA GeForce RTX 2060 Mobile, i7-9750H
MSI GE65 Raider 9SE
36.4 fps ∼16%
16.6 fps ∼12%
NVIDIA GeForce GTX 1070 Mobile, 6820HK
Asus G752VS
36.2 fps ∼16%
19.3 fps ∼13%
NVIDIA GeForce GTX 1660 Ti Mobile, i7-9750H
MSI GP65 Leopard 9SD
32.1 fps ∼14%
11.8 fps ∼8%
NVIDIA GeForce GTX 1060 (Desktop), i9-9900K
NVIDIA GeForce GTX 1060
26.7 fps ∼12%
14 fps ∼10%
NVIDIA GeForce GTX 1060 Mobile, 6820HK
MSI GT62VR
23.8 fps ∼11%
12.4 fps ∼9%
NVIDIA GeForce GTX 1650 Mobile, i7-9750H
MSI GP75 Leopard 9SC
18.3 fps ∼8%
6.3 fps ∼4%
NVIDIA GeForce GTX 1050 Ti Mobile, i7-7700HQ
MSI GE72 7RE
14.9 fps ∼7%
3 fps ∼2%
NVIDIA GeForce GTX 965M, 6700HQ
MSI GE72 965M Ti
12.5 fps ∼6%
AMD Radeon RX 460 (Desktop), i7-7740X
XFX RX-460P4DFG5 Double Dissipation 4 GB, Asus X299 Prime
11.7 fps ∼5%
NVIDIA GeForce GTX 1050 Mobile, i7-7700HQ
Asus GL753VD
11.5 fps ∼5%
5.1 fps ∼4%

Hinweis

Da Gaming-Tests sehr zeitaufwändig sind und oft durch Installations- bzw. Aktivierungslimits behindert werden, können wir Ihnen zur Veröffentlichung der Artikel nur einen Teil der Benchmarks liefern. Weitere Grafikkarten werden jeweils in den kommenden Tagen und Wochen eingebaut.

Übersicht

Einschränkungen anzeigen
PosModell< PrevNext >Borderlands 3
 Borderlands 3 (2019)
low
1280x720
Very Low Overall Quality (DX11)
med.
1920x1080
Medium Overall Quality (DX11)
high
1920x1080
High Overall Quality (DX11)
ultra
1920x1080
Badass Overall Quality (DX11)
QHD
2560x1440
Badass Overall Quality (DX11)
4K
3840x2160
Badass Overall Quality (DX11)
NVIDIA GeForce RTX 4090
237n19
209n19
192.9n19
182n19
180.9n18
133.75n18
AMD Radeon RX 7900 XTX
248n2
218n2
200.7n2
180.95n2
153.75n2
90.3n2
NVIDIA GeForce RTX 4080 Super
260n2
230n2
212n2
198.4n2
171.6n2
97.95n2
NVIDIA GeForce RTX 4080
247.5n2
227n3
200.45n2
193.3n2
166.85n2
95.45n2
NVIDIA GeForce RTX 3090 Ti
204n2
187.6n2
173.3n2
143.1n2
83.8n2
NVIDIA GeForce RTX 4070 Ti SUPER
192.1
176.8
169.6
143.6
79.4
AMD Radeon RX 7900 XT
248
220
199.2
169.4
135.2
74.6
NVIDIA GeForce RTX 4070 Ti
240.5n2
208n2
202n4
178.6n4
138.45n4
73.3n4
AMD Radeon RX 7900 GRE
208.8n2
184.9n2
160.45n2
138.4n2
110.05n2
62.9n2
AMD Radeon RX 6950 XT
208.6n2
188.5n2
169.3n2
148.8n2
121.15n2
65.4n2
NVIDIA GeForce RTX 4090 Laptop GPU
208n3
182.1n3
163.6n3
163.5n4
129.7n4
71.35n4
NVIDIA GeForce RTX 3090
231n12
201n13
179.4n13
156.3n13
128.3n13
73.2n13
NVIDIA GeForce RTX 3080 Ti
229n3
195.3n3
179.7n3
156n4
126.85n4
72.9n4
AMD Radeon RX 7800 XT
240
211
173.8
141.8
105.5
57.9
NVIDIA GeForce RTX 4070 SUPER
193.6
181.75n2
165n2
128.3n2
67.55n2
AMD Radeon RX 6900 XT
197
169
152
130.5n2
106n2
58.45n2
NVIDIA GeForce RTX 4080 Laptop GPU
207.7
176.6
158.1
133.5
108.7
59.8
NVIDIA GeForce RTX 3080 12 GB
166.2
150
139.2
128.5
104
59.9
NVIDIA GeForce RTX 3080
156n2
135n2
124.5n2
122.5n2
99.35n2
61.7n2
PosModell< PrevNext >Borderlands 3
low med. high ultra QHD 4K
NVIDIA GeForce RTX 4070
251
228
185.5n2
155.4n2
111n2
58.7n2
AMD Radeon RX 6800 XT
161
158
139
120
93.6
53.6
AMD Radeon RX 6800
230n3
205n3
159.6n3
126.8n3
92.2n3
49.1n3
AMD Radeon RX 7700 XT
244
210
158.2
126.4
89.4
48
NVIDIA Titan RTX
175n29
155n29
136n29
115n29
84.4n29
46.9n29
NVIDIA GeForce RTX 3070 Ti
238.5n2
209.5n2
165.2n2
132.25n2
96.05n2
53.25n2
NVIDIA GeForce RTX 4060 Ti 16G
229
195.3
147.6
117.3
81.7
42.5
NVIDIA GeForce RTX 4060 Ti 8G
241n3
206n3
156.8n3
121.8n3
84.2n3
43.7n3
NVIDIA GeForce RTX 3080 Ti Laptop GPU
123.6
106.4
99.8
90.7
78.2
46.1
NVIDIA GeForce RTX 4070 Laptop GPU
217.2n2
173n2
131.8n3
100.3n3
71.5n3
37.85n2
NVIDIA GeForce RTX 3070
149n5
132n5
118n5
98.8n5
75.9n5
44.2n5
AMD Radeon RX 6750 XT
209.45n2
184.6n2
148.4n2
123.6n2
98.5n2
54.35n2
NVIDIA GeForce RTX 2080 Ti (Desktop)
154.9n2
136.55n2
121.75n2
105.15n2
80.5n2
45.3n2
AMD Radeon RX 6700 XT
194.6n3
174.3n3
133.3n3
104.6n3
73n3
38.1n3
NVIDIA GeForce RTX 3080 Laptop GPU
158.7
135.2
103n3
85.5n3
62.5n3
34.9n3
NVIDIA GeForce RTX 3060 Ti
158.6n6
137.75n6
109.65n6
89.8n6
67.25n6
38.25n6
Intel Arc A770
116.7
100.4
95.8
84.3
65.4
35.5
NVIDIA GeForce RTX 4060
242
186.7
124.8
93.9
64.8
33.8
AMD Radeon RX 7600
253
182.6
125
96.2
65.7
34.5
AMD Radeon RX 6850M XT
112.8
102.1
94.2
85.6
68.6
PosModell< PrevNext >Borderlands 3
low med. high ultra QHD 4K
NVIDIA GeForce RTX 3070 Ti Laptop GPU
104.2
92.4
80.9
58.7
NVIDIA GeForce RTX 4060 Laptop GPU
171.3
144.6
106.5
83.9
NVIDIA GeForce RTX 2080 Super (Desktop)
150.3
131.9
108.2
91
65.5
35.9
AMD Radeon RX 6800M
115.05n2
101.05n2
91.65n2
79n3
62.1n2
33.05n2
AMD Radeon RX 6650 XT
194n3
169.7n3
118.2n3
89n3
60.2n3
31.6n3
AMD Radeon RX 6600 XT
232
186
103
81.9
57
29.9
NVIDIA GeForce RTX 2080 (Desktop)
139
124
107
89.8
65.4
35.4
NVIDIA GeForce RTX 2080 Super Mobile
131
102.5n2
88.9n2
65n2
36.15n2
NVIDIA GeForce RTX 3070 Laptop GPU
138.7n2
121.1n2
101n4
84.65n4
62.4n4
34.5n4
AMD Radeon RX 7600M XT
124n5
109.2n5
95.5n5
81.5n5
58.1n5
30.8n5
Intel Arc A750
126.5
110.5
93.2
78.4
60
33.1
NVIDIA GeForce RTX 3060
156n5
139.25n6
103n5
78.5n5
57.7n4
31.6n4
Apple M2 Max 38-Core GPU
72
60.2
48.6
NVIDIA GeForce RTX 2080 Mobile
139n2
124.5n2
98.2n4
83.1n4
60n2
32.55n2
AMD Radeon RX 6700M
100
86.9
71.2
NVIDIA GeForce GTX 1080 Ti (Desktop)
145
128
103
85.4
61.7
34.07
NVIDIA Titan X Pascal
233n3
154n3
107.5n3
84.1n3
59.3n3
32.4n3
NVIDIA GeForce RTX 2070 Super (Desktop)
157n5
133n5
101n5
79.4n5
56.7n5
31n5
AMD Radeon VII
146
128
96.9
78.9
57
31.8
AMD Radeon RX 5700 XT (Desktop)
202n3
154.8n3
106.9n3
79n3
55.8n3
30.3n3
PosModell< PrevNext >Borderlands 3
low med. high ultra QHD 4K
NVIDIA GeForce RTX 2070 (Desktop)
145n2
123n2
92.7n2
72.65n2
51.2n2
27.6n2
Apple M2 Max 30-Core GPU
53.2
45.2
35.1
NVIDIA GeForce RTX 3060 Laptop GPU
124.85n2
104.7n2
90.3n3
72.6n4
51.85n2
28.5
Apple M1 Max 32-Core GPU
66.45n2
54.25n2
46.85n2
40.15n2
33
20.6
NVIDIA GeForce RTX 2070 Super Mobile
127
92.1
70.6
49.8
26.8
NVIDIA GeForce GTX 1080 (Desktop)
142
118
89.2
70.2
49.4
26.5
NVIDIA GeForce RTX 2080 Super Max-Q
130.4n2
105.7n3
80.45n4
65.8n4
50.4n2
26.75n2
Apple M1 Max 24-Core GPU
57.2
47.7
40.7
34.6
Intel Arc A580
152.1
124.4
93
75.2
53.4
28.9
NVIDIA GeForce RTX 2060 Super (Desktop)
191n4
131.9n4
92.35n4
71n4
50.15n4
27.5n4
Intel Arc A770M
99.4
87
78.9
69.2
53.5
29.1
AMD Radeon RX 6600
193.5n3
144.4n3
91.6n3
68n3
45.9n3
24.1n3
Apple M2 Pro 19-Core GPU
77.45n2
57.15n2
40.3n2
29.7n2
AMD Radeon RX 5700 (Desktop)
198.2n3
146.6n3
94.7n3
69.9n3
49.2n3
26.5n3
AMD Radeon RX 6650M
110.4
95.9
85.2
67.4
AMD Radeon RX 6600M
114.7n5
100.7n5
84.5n6
66.2n5
45n3
23.8n3
NVIDIA GeForce RTX 2070 Mobile
109.5n2
97n2
81.4n3
63.3n3
45.1
24.2
NVIDIA GeForce RTX 2080 Max-Q
128.8
110.8
84.7
67.1
NVIDIA GeForce RTX 2060 (Desktop)
139
116
82.8
64
44.1
19.5
AMD Radeon RX Vega 64
140.3
114
78
58.1
42.2
23.4
PosModell< PrevNext >Borderlands 3
low med. high ultra QHD 4K
NVIDIA GeForce GTX 1080 Mobile
113
95.1
78.9
62.3
46.4
24.9
Apple M2 Pro 16-Core GPU
80.8
52
38
28.9
Apple M1 Pro 16-Core GPU
56.6
48
34.8
26.2
NVIDIA GeForce RTX 2070 Super Max-Q
112
77.6n4
59.25n4
43.65n2
23.35n2
Apple M1 Pro 14-Core GPU
61.9
39.4
31.9
24.1
NVIDIA GeForce RTX 2070 Max-Q
135.6
103.2
69.3n3
55.15n4
21.5
NVIDIA GeForce RTX 2060 Mobile
124.45n4
90.9n4
63.3n6
49.4n7
36.4
16.6
NVIDIA GeForce RTX 3050
213n2
118.5n2
75.65n2
56.65n2
40.35n2
21.65n2
NVIDIA GeForce GTX 1070 (Desktop)
141
106
74.6
57.9
40
21.4
AMD Radeon RX 5600 XT (Desktop)
197.9n3
140.3n3
91.6n3
68.1n3
48.1n3
24.3n3
NVIDIA GeForce GTX 1080 Max-Q
91
82
68
55.2
39.2
20.7
NVIDIA GeForce GTX 1070 Mobile
99.1
83.4
66.4
52.2
36.2
19.3
NVIDIA GeForce RTX 2060 Max-Q
117
89.5
61.9
48.3
NVIDIA GeForce GTX 1660 Ti (Desktop)
143
102
68.3
60.7
41.7
17.5
NVIDIA GeForce GTX 1660 Super (Desktop)
225n3
108.4n3
69.6n3
52.3n3
36.1n3
16.8n3
AMD Radeon RX 6500 XT
206n3
93.5n3
57.1n3
41.1n3
23.5n3
10.1n2
AMD Radeon RX 5500 XT (Desktop)
196.2n3
96.1n3
59.9n3
43.9n3
31.1n3
16.6n3
NVIDIA GeForce RTX 4050 Laptop GPU
171
139
96
73
50
26
Intel Arc A730M
93.2
79.3
67.7
57
21.2
AMD Radeon RX 5600M
105.2
81.7
61.2
47.8
PosModell< PrevNext >Borderlands 3
low med. high ultra QHD 4K
NVIDIA GeForce GTX 1660 Ti Mobile
119.45n2
91.7n3
61.7n3
47.8n3
32.1
11.8
NVIDIA GeForce RTX 3050 Ti Laptop GPU
110.25n2
88n3
56.8n3
45n3
35.6
16.3
NVIDIA GeForce GTX 980 Ti
53.3
37.5
20.2
NVIDIA GeForce GTX 1660 (Desktop)
219n3
98.1n3
64.4n3
49n3
33.8n3
15n3
NVIDIA GeForce GTX 1650 Super (Desktop)
207n3
89.5n3
57.7n3
43.4n3
29.5n3
11.8n3
NVIDIA GeForce RTX 3050 4GB Laptop GPU
111.7
75.25n2
53.25n2
39.15n2
26.4n2
15.6
NVIDIA GeForce GTX 1660 Ti Max-Q
101.75n2
76.8n2
53.9n2
41.9n2
AMD Radeon RX 6500M
78.2
66.6
47.1
34.5
AMD Radeon RX 590 (Desktop)
137.8
84.1
53.7
42.1
29.8
16.1
NVIDIA GeForce GTX 1060 (Desktop)
139
77.7
51.1
39
26.7
14
AMD Radeon RX 570 (Desktop)
137.6
71.4
45.4
35.2
24.4
13.4
NVIDIA GeForce GTX 1060 Mobile
92.9
67.1
45.6
34.7
23.8
12.4
NVIDIA GeForce GTX 1650 Ti Mobile
125.15n2
63.4n3
40.8n3
30.5n3
20.1
7.1
Intel Arc A370M
76.4
47.5
29.5
22
14.5
AMD Radeon RX 5500M
75.6n2
64.15n2
47.2n3
35.75n4
23.9
6.7
AMD Radeon Pro 5500M
41.4
30.8
21.4
3.8
NVIDIA GeForce GTX 1650 (Desktop)
138.2
62.5
40.2
30.1
17.1
6
NVIDIA GeForce GTX 1650 Mobile
102.8n5
60.1n5
39.2n5
30.7n5
18.3
6.3
Intel Arc A380
136.5
62
39.5
29.8
AMD Radeon RX 5300M
97.3
63.6
40.9
32.75n2
PosModell< PrevNext >Borderlands 3
low med. high ultra QHD 4K
NVIDIA GeForce GTX 970
74
48.6
36.7
NVIDIA GeForce GTX 1650 Ti Max-Q
102.8
52.6
34.7
26.1
NVIDIA GeForce GTX 1650 Max-Q
94.55n2
52.05n2
34.05n2
25.55n2
NVIDIA T1200 Laptop GPU
99
62
43
33
23
NVIDIA Quadro T1000 (Laptop)
117.9
58.7
38
28.5
Intel Arc 8-Cores iGPU
68.5
38.5
27.7
22.6
AMD Radeon RX Vega M GH
80.8
50
31.5
21.9
16.8
6.6
AMD Radeon 780M
93.85n6
45.6n6
29.6n6
23.25n6
NVIDIA GeForce GTX 1050 Ti Mobile
91.2
44.6
28.1
20.1
14.9
3
NVIDIA GeForce GTX 1050 Ti (Desktop)
115
47.5
29.6
21.8
15
AMD Radeon 680M
80.45n12
32.75n12
22.15n12
17.6n12
14.3
6.8
NVIDIA GeForce MX450
79.5n3
30.15n2
18.4n2
12.75n2
AMD Radeon RX Vega M GL / 870
87.5
39.3
24.2
18.5
12.6
5.4
NVIDIA GeForce GTX 1050 (Desktop)
98
40.1
25
18.4
2.1
NVIDIA GeForce GTX 1050 Mobile
78.3n2
38.1n2
24.35n2
17.85n2
11.5
5.1
NVIDIA GeForce GTX 1050 Max-Q
81.3
35.3
22.5
16.5
11.6
4.9
Apple M2 10-Core GPU
66.8n3
34.2n3
23.8n3
16.4n3
AMD Radeon 660M
49
20.5
13.6
10.7
AMD Radeon RX 460 (Desktop)
90
37.6
23
17.4
11.7
NVIDIA GeForce GTX 965M
64.8
38
24.7
18.7
12.5
PosModell< PrevNext >Borderlands 3
low med. high ultra QHD 4K
AMD Radeon RX 560X (Laptop)
69.5
34.5
23.2
17.7
Intel Iris Xe MAX Graphics
51.3
28.6
18.2
11.7
AMD Radeon Pro 560X
78
33.6
20.8
15.8
10.8
3.1
Intel Iris Xe Graphics G7 96EUs
51.75n16
25n16
15.55n16
11.6n13
NVIDIA GeForce MX350
67.05n2
26.8n2
16.95n2
13.65n2
NVIDIA GeForce GT 1030 (Desktop)
59.5
22.4
14.2
10.6
7.1
NVIDIA GeForce MX250
51.55n2
19.3n2
12.6n2
10.2
NVIDIA GeForce MX330
45.4
14.2
12.1
8.8
NVIDIA GeForce MX150
41.5
18
11.5
8.4
Intel Iris Xe Graphics G7 80EUs
46.7n5
21.4n5
13.1n5
10.52n2
NVIDIA GeForce GT 710
13.55n2
5.23n2
3.32n2
2.37
NVIDIA GeForce GTX 950M
48.9
47.4
13.9
10.3
AMD Radeon 540X
42.5
26.3
9.7
AMD Radeon RX Vega 11
47.1n2
18n2
10.71n2
7.54n2
Intel UHD Graphics 64EUs (Alder Lake 12th Gen)
36.8n7
16.7n7
10.7n7
8.03n7
Intel Iris Plus Graphics G7 (Ice Lake 64 EU)
30.95n4
13.8n3
8.7n3
6.6
AMD Radeon RX Vega 10
42.3n3
17.5n3
10.9n3
8.5n2
AMD Radeon RX Vega 9
28.3
13.5
7.8
Intel UHD Graphics Xe G4 48EUs
22.3n2
8.94n2
Intel UHD Graphics Xe 32EUs (Tiger Lake-H)
26.1n3
11n3
6.29n3
4.74
PosModell< PrevNext >Borderlands 3
low med. high ultra QHD 4K
Intel UHD Graphics 730 (Rocket Lake)
19.7
8.36
4.99
NVIDIA GeForce MX230
39.6
16
10.1
7.4
Apple M2 8-Core GPU
43
29.7
16.6
13.4
Apple M1 8-Core GPU
53.25n4
31.6n4
20n3
AMD Radeon RX Vega 8 (Ryzen 4000/5000)
69.7n8
27.75n8
16.9n8
12.8n8
9.06n3
4.55n3
Apple M1 7-Core GPU
45.2
28
17.7
AMD Radeon RX Vega 7
54.3n5
21.3n5
13.3n5
10.3n4
NVIDIA GeForce MX130
33
13.2
AMD Radeon RX Vega 8 (Ryzen 2000/3000)
34.9n3
14.2n3
9.1n3
7.1n3
Intel Iris Plus Graphics G4 (Ice Lake 48 EU)
25.4n2
9.4n2
6.2n2
3.5
NVIDIA GeForce 930MX
28.7
10.5
6.6
Intel Iris Plus Graphics 655
23n2
10.3n2
6.53n2
NVIDIA GeForce 930M
26
Intel Iris Graphics 550
21
8.8
AMD Radeon 530
24.6
9.6
6
AMD Radeon RX Vega 6 (Ryzen 4000/5000)
39.6n2
16n3
10.6
NVIDIA GeForce MX110
24.5
9.4
Intel UHD Graphics 24EUs (Alder Lake-N)
13.65n4
5.83n4
3.38n4
2.4n4
AMD Radeon 610M
40.3
14.9
9.04
6.48
AMD Radeon RX Vega 6 (Ryzen 2000/3000)
22.5
9.4
PosModell< PrevNext >Borderlands 3
low med. high ultra QHD 4K
AMD Radeon RX Vega 5
37.5
14.8
9
Intel UHD Graphics G1 (Ice Lake 32 EU)
19.55n2
7
Intel UHD Graphics 630
17.8
6.8
Intel UHD Graphics Xe 16EUs (Tiger Lake-H)
13.9n2
5.77
3.3
Intel HD Graphics 630
14.2
5.6
AMD Radeon R5 (Bristol Ridge)
10.2
Intel UHD Graphics 620
14.8n3
5.83
3.69
AMD Radeon R5 M255
17.8
AMD Radeon RX Vega 3
15.3
6.3
NVIDIA GeForce GT 720M
14.3
Intel HD Graphics 4600
9.3
Intel HD Graphics 5500
13.9
Intel UHD Graphics (Jasper Lake 32 EU)
11.66n2
7.96
4.68
Intel UHD Graphics 615
7.3
3.1
Intel HD Graphics 4400
8
AMD Radeon R4 (Stoney Ridge)
8.2
AMD Radeon R5 (Beema/Carrizo-L)
7.1
(-) * Geringere Werte sind besser. / n123 Anzahl der Benchmarks die zu diesem Wert beitragen / * Geschätzte Position


Legende
5ruckelt - Das Spiel wird in dieser Detailstufe wahrscheinlich nicht flüssig mit dieser Grafikkarte laufen. Mindestens ein Benchmarkwert ist kleiner als 25fps
könnte ruckeln - Interpolierte Information. Bei einer langsameren Grafikkarte wurde dieses Spiel als ruckelnd klassifiziert und daher wird dies auch bei dieser angenommen, da keine Benchmarkwerte eingetragen sind.
30flüssig - Dieses Spiel sollte in den betroffenen Einstellungen flüssig laufen, da kein Benchmarkwert eingetragen wird, der die Grenze unterschreitet: 25fps
40flüssig - Dieses Spiel sollte in den betroffenen Einstellungen flüssig laufen, da kein Benchmarkwert eingetragen wird, der die Grenze unterschreitet: 35fps
60flüssig - Dieses Spiel sollte in den betroffenen Einstellungen flüssig laufen, da kein Benchmarkwert eingetragen wird, der die Grenze unterschreitet: 58fps
könnte flüssig laufen - Eine langsamere Grafikkarte wurde als schnell genug klassifiziert und daher wird dies auch für diese geschätzt (da keine Benchmarkwerte eingetragen sind).
?unsicher - Zwei mögliche Fälle: Der kleinste gefundene Benchmarkwert ist zwar unter dem Grenzwert für eine flüssige Darstellung, jedoch ist der Durchschnitt darüber. Zweiter Fall, der Benchmarkwert ist unter der Grenze, jedoch ist die nächst-langsamere Karte als flüssig eingestuft.
unsicher vererbt - Die nächst-langsamere Karte ist als "unsicher" eingestuft und daher wird dieser Wert auch an schnellere Karten vererbt, die keine Benchmarkwerte haben.
Der Wert in den einzelnen Feldern beziffert die durchschnittlichen Bilder pro Sekunde. Bewegen Sie den Mauszeiger auf diesen Wert um eine detaillierte Auflistung aller Benchmarks zu sehen.

Testsysteme

Gerät Grafikkarte Prozessor Arbeitsspeicher Betriebssystem
Desktop-PC I MSI GeForce RTX 2080 (8 GB GDDR6)
MSI GeForce RTX 2070 (8 GB GDDR6)
MSI GeForce RTX 2060 (6 GB GDDR6)
MSI GeForce GTX 1080 (8 GB GDDR5X)
MSI GeForce GTX 1070 (8 GB GDDR5)
Nvidia GeForce GTX 1060 (6 GB GDDR5)
Intel Core i9-9900K 4 x 8 GB DDR4 Windows 10 64 Bit
Desktop-PC II Nvidia GeForce GTX 1080 Ti (11 GB GDDR5X)
Asus GeForce GTX 980 Ti (6 GB GDDR5)
XFX Radeon R9 Fury (4 GB HBM)
Sapphire Radeon R9 290X (4 GB GDDR5)
Sapphire Radeon R9 280X (3 GB GDDR5)
MSI Radeon R7 370 (2 GB GDDR5)
Intel Core i7-7740X 2 x 8 GB DDR4 Windows 10 64 Bit
Desktop-PC III Nvidia GeForce RTX 2070 Super (8 GB GDDR6)
Nvidia GeForce RTX 2060 Super (8 GB GDDR6)
Nvidia Titan X (Pascal) (12 GB GDDR5X)
AMD Radeon RX Vega 64 (8 GB HBM2)
XFX AMD Radeon RX 590 (8 GB GDDR5)
Sapphire AMD Radeon RX 580 (8 GB GDDR5)
Sapphire AMD Radeon RX 570 (8 GB GDDR5)
Gainward GeForce GTX 1650 (4 GB GDDR5)
Zotac GeForce GT 1030 (2 GB GDDR5)
AMD Ryzen 7 2700X 2 x 8 GB DDR4 Windows 10 64 Bit
Desktop-PC IV Nvidia Titan RTX (24 GB GDDR6) AMD Ryzen Threadripper 2920X 4 x 16 GB DDR4 Windows 10 64 Bit
MSI GT76 Nvidia GeForce RTX 2080 (8 GB GDDR6) Intel Core i9-9900K 2 x 16 GB DDR4 Windows 10 64 Bit
MSI GP65 Nvidia GeForce RTX 2070 (8 GB GDDR6) Intel Core i7-9750H 2 x 16 GB DDR4 Windows 10 64 Bit
MSI GE65 Nvidia GeForce RTX 2060 (6 GB GDDR6) Intel Core i7-9750H 2 x 8 GB DDR4 Windows 10 64 Bit
MSI GP65 Nvidia GeForce GTX 1660 Ti (6 GB GDDR6) Intel Core i7-9750H 2 x 16 GB DDR4 Windows 10 64 Bit
MSI GP75 Nvidia GeForce GTX 1650 (4 GB GDDR5) Intel Core i7-9750H 2 x 8 GB DDR4 Windows 10 64 Bit
Alienware 17 R4 Nvidia GeForce GTX 1080 (8 GB GDDR5X) Intel Core i7-7820HK 2 x 16 GB DDR4 Windows 10 64 Bit
Asus G752VS Nvidia GeForce GTX 1070 (8 GB GDDR5) Intel Core i7-6820HK 2 x 16 GB DDR4 Windows 10 64 Bit
MSI GT62VR Nvidia GeForce GTX 1060 (6 GB GDDR5) Intel Core i7-6820HK 2 x 8 GB DDR4 Windows 10 64 Bit
MSI GE72 Nvidia GeForce GTX 1050 Ti (2 GB GDDR5) Intel Core i7-7700HQ 2 x 4 GB DDR4 Windows 10 64 Bit
Asus GL753VD Nvidia GeForce GTX 1050 (4 GB GDDR5) Intel Core i7-7700HQ 1 x 16 GB DDR4 Windows 10 64 Bit
MSI GL62 Nvidia GeForce GTX 1050 (2 GB GDDR5) Intel Core i7-7700HQ 2 x 4 GB DDR4 Windows 10 64 Bit
MSI GE72 Nvidia GeForce GTX 965M (2 GB GDDR5) Intel Core i7-6700HQ 1 x 8 GB DDR4 Windows 10 64 Bit
MSI PE60 Nvidia GeForce GTX 950M (2 GB GDDR5) Intel Core i7-6700HQ 2 x 4 GB DDR4 Windows 10 64 Bit
MSI CX72 Nvidia GeForce 940MX (2 GB DDR3) Intel Core i7-6700HQ 2 x 8 GB DDR4 Windows 10 64 Bit
MSI GP62 Nvidia GeForce 940M (2 GB DDR3) Intel Core i7-5700HQ 1 x 8 GB DDR3 Windows 10 64 Bit
MSI CX61 Nvidia GeForce 920M (2 GB DDR3) Intel Celeron 2970M 1 x 8 GB DDR3 Windows 10 64 Bit
Honor Magicbook AMD Radeon RX Vega 8 AMD Ryzen 5 2500U 1 x 8 GB DDR4 Windows 10 64 Bit
4K Monitore Nvidia Treiber AMD Treiber
Asus PB287Q, Philips Momentum 436M6VBPAB ForceWare 436.30 Adrenalin 19.9.1
static version load dynamic
Loading Comments
Diesen Artikel kommentieren / Antworten
Teilen Sie diesen Artikel, um uns zu unterstützen. Jeder Link hilft!
> Notebook Test, Laptop Test und News > Tests > Sonstige Tests > Borderlands 3 Notebook- und Desktop-Benchmarks
Autor: Florian Glaser, 19.09.2019 (Update: 25.09.2019)