Intel HD Graphics 515 vs Intel UHD Graphics 605 vs Intel HD Graphics 500
Intel HD Graphics 515 ► remove from comparison
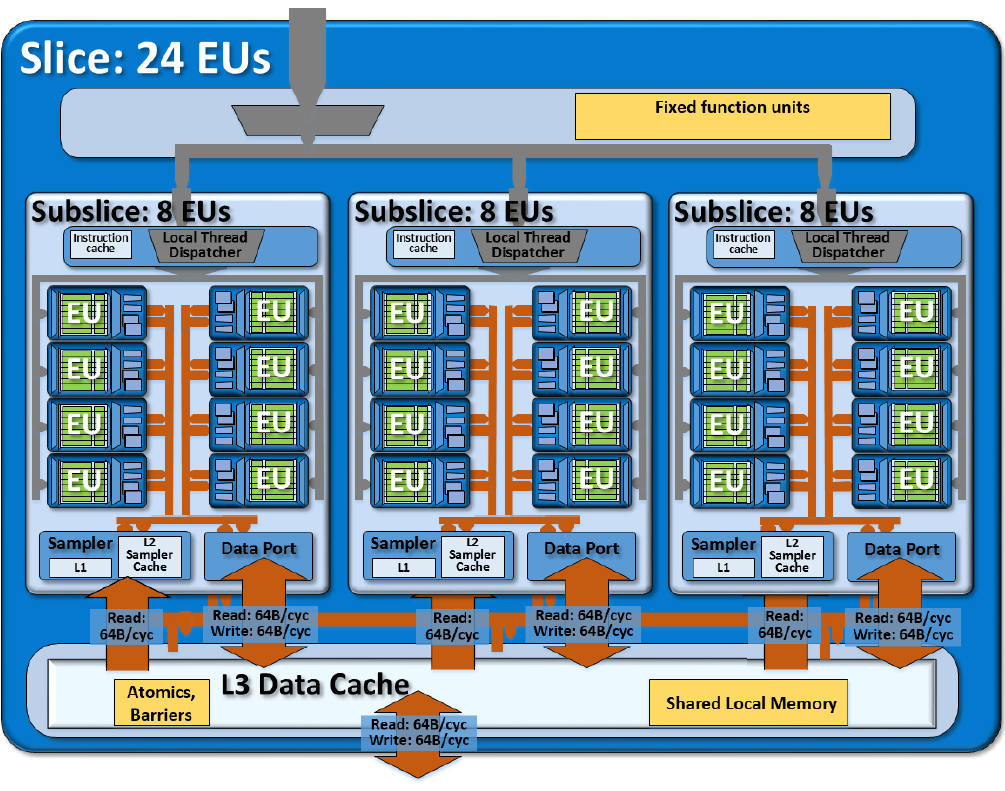
Die Intel HD Graphics 515 (GT2) ist eine Prozessorgrafikkarte der im September 2015 vorgestellten Core-m-CPUs der Skylake-Generation (z.B. Core m7-6Y75 ). Zwar glänzt die GPU mit einer extrem niedrigen Leistungsaufnahme, allerdings siedelt sich die Performance nur im absoluten Low-End-Segment an und ist für neuere Spiele kaum ausreichend. Als sogenannte GT2-Ausbaustufe der Skylake-GPU verfügt die HD Graphics 515 über 24 Execution Units (EUs), die je nach Modell mit bis zu 1.000 MHz takten.
Mangels eigenem Grafikspeicher oder eDRAM-Cache greift die HD Graphics 515 über das Interface des Prozessors auf den System-RAM zu (2x 64 Bit DDR3L-1600/LPDDR3-1866).
Performance
Die exakte Leistung der HD Graphics 515 hängt stark vom jeweiligen CPU-Modell und Endgerät ab, da sich Maximaltaktrate und TDP-Einstellung unterscheiden können. Zum anderen bestimmt auch der eingesetzte Speicher die Performance.
Im Optimalfall übertrifft die HD 515 sogar leicht die ältere HD Graphics 4400 , kann aktuelle Spiele (Stand 2015) aber dennoch allenfalls in niedrigsten Einstellungen flüssig darstellen.
Features
Der überarbeitete Videodecoder decodiert nun auch H.265-/HEVC-Videos vollständig in Hardware und arbeitet dadurch deutlich effizienter als bislang. Die Bildausgabe erfolgt über DP 1.2/eDP 1.3 (max. 3.840 x 2.160 @ 60 Hz), wohingegen HDMI nur in der älteren Version 1.4a angeboten wird. Ein HDMI-2.0-Anschluss kann aber mittels Konverter von DisplayPort ergänzt werden. Maximal lassen sich drei Displays parallel angesteuern.
Leistungsaufnahme
Die TDP des gesamten Chips liegt standardmäßig bei 4,5 Watt, sodass viele Ultrabooks oder 2-in-1-Geräte mit einer rein passiven Kühlung auskommen. Teils kann die TDP auch auf niedrigere (3,5/3,8 Watt) oder höhere Werte (7 Watt) angepasst werden.
Intel UHD Graphics 605 ► remove from comparison
Die Intel UHD Graphics 605 ist eine Prozessorgrafikkarte der Ende 2017 vorgestellten Gemini-Lake-Generation (z.B. Pentium Silver N5000). Zwar glänzt die GPU mit einer sehr niedrigen Leistungsaufnahme, allerdings siedelt sich die Performance nur im Low-End-Segment an und ist für neuere Spiele nicht ausreichend. Als maximale Ausbaustufe der Gemini-Lake-GPU verfügt die UHD Graphics 605 über 18 Execution Units (EUs), die mit bis zu 750 MHz takten. Technisch basiert die GPU auf der Intel-Gen9-Architektur, die auch bei der teureren Skylake-Serie zum Einsatz kommt. Im Vergleich zur alten Intel HD Graphics 505 in Apollo Lake , wurden nur die Displayausgänge verbessert (Gen. 10). Performance und Architektur blieben unangetastet.
Mangels eigenem Grafikspeicher oder eDRAM-Cache greift die UHD Graphics 605 über das Interface des Prozessors auf den System-RAM zu (2x 64 Bit DDR3L/LPDDR4-2400).
Performance
Die theoretische Grafikleistung entspricht in etwa der älteren Core-M-Grafikeinheit HD Graphics 5300 . Dadurch sind nur wenige anspruchslose Spiele flüssig spielbar (siehe auch die Spielebenchmarks der Intel HD Graphics 505 ). In unseren Tests erreichte z.B. nur wenige Spiele wie Dirt Rally oder Sims 4 spielbare Frameraten in niedrigsten Detailstufe.
Features
Der überarbeitete Videodecoder decodiert und encodiert H.265-/HEVC-Videos (8b und 10b) sowie VP9 vollständig in Hardware und arbeitet dadurch deutlich effizienter als bislang. Bei der Bildausgabe unterstützt der SoC dank Gen.10 nun auch HDMI 2.0a mit HDCP 2.2 un DisplayPort 1.2a nativ.
Leistungsaufnahme
Die TDP des gesamten Chips liegt beim Pentium N5000 standardmäßig bei 6 Watt, sodass die GPU vor allem in (oftmals passiv gekühlten) Netbooks oder schlanken Notebooks zu finden ist. Optional kann die TDP auch auf 4,8 Watt abgesenkt werden, wodurch allerdings die Performance sinkt.
Intel HD Graphics 500 ► remove from comparison
Die Intel HD Graphics 500 ist eine Prozessorgrafikkarte der Mitte 2016 vorgestellten Apollo-Lake-Generation (z.B. Celeron N3450 und Celeron N3350 ). Zwar glänzt die GPU mit einer sehr niedrigen Leistungsaufnahme, allerdings siedelt sich die Performance nur im untersten Low-End-Segment an und ist für neuere Spiele zumeist nicht ausreichend. Als teildeaktivierte Variante der Apollo-Lake-GPU verfügt die HD Graphics 500 nur über 12 Execution Units (HD Graphics 505: 18 EUs), die je nach Modell mit bis zu 650 oder 700 MHz takten. Technisch basiert die GPU auf der Intel-Gen9-Architektur, die auch bei der teureren Skylake-Serie zum Einsatz kommt.
Mangels eigenem Grafikspeicher oder eDRAM-Cache greift die HD Graphics 500 über das Interface des Prozessors auf den System-RAM zu (2x 64 Bit DDR3L-/LPDDR3-1866, LPDDR4-2400).
Performance
Die HD Graphics 500 dürfte sich noch knapp unterhalb der älteren Broadwell-Grafikeinheit HD Graphics (Broadwell) ansiedeln, sodass aktuelle Spiele (Stand 2016) nur in den seltensten Fällen und in sehr niedrigen Einstellungen flüssig dargestellt werden.
Features
Der überarbeitete Videodecoder decodiert nun auch H.265-/HEVC-Videos vollständig in Hardware und arbeitet dadurch deutlich effizienter als bislang. Die Bildausgabe auf bis zu drei Displays erfolgt über DP/eDP oder HDMI (4K vermutlich nur bei 30 Hz via HDMI 1.4).
Leistungsaufnahme
Die TDP des gesamten SoCs liegt bei standardmäßig bei 6 Watt, sodass die GPU vor allem in (oftmals passiv gekühlten) Netbooks oder schlanken Notebooks zu finden ist. Optional kann die TDP auch auf 4 Watt abgesenkt werden, wodurch allerdings die Performance sinkt.
Intel HD Graphics 515 Intel UHD Graphics 605 Intel HD Graphics 500 Gen. 9 Serie Codename Skylake GT2 Gemini Lake Apollo Lake Architektur Gen. 9 Skylake Gen. 9 Apollo Lake Gen. 9 Apollo Lake Pipelines 24 - unified 18 - unified 12 - unified Kerntakt 300 - 1000 (Boost) MHz 300 - 750 (Boost) MHz 300 - 700 (Boost) MHz Speicherbandbreite 64/128 Bit 64/128 Bit 64/128 Bit Speichertyp DDR3L/LPDDR3 DDR4 / LPDDR4 Shared Memory ja ja ja API DirectX 12_1, OpenGL 4.4 DirectX 12_1, OpenGL 4.4 DirectX 12_1, OpenGL 4.4 Herstellungsprozess 14 nm 14 nm 14 nm Features QuickSync QuickSync QuickSync Erscheinungsdatum 01.09.2015 11.12.2017 01.09.2016 Herstellerseite ark.intel.com
CPU in HD Graphics 515 GPU Base Speed GPU Boost / Turbo Intel Core m7-6Y75 2 x 1200 MHz, 4.5 W 300 MHz 1000 MHz Intel Core m5-6Y57 2 x 1100 MHz, 4.5 W 300 MHz 900 MHz Intel Core m5-6Y54 2 x 1100 MHz, 4.5 W 300 MHz 900 MHz Intel Core m3-6Y30 2 x 900 MHz, 4.5 W 300 MHz 850 MHz min. - max. 300 MHz 850 - 1000 MHz
CPU in UHD Graphics 605 GPU Base Speed GPU Boost / Turbo Intel Pentium Silver J5040 4 x 2000 MHz, 10 W 250 MHz 800 MHz Intel Pentium Silver N5030 4 x 1100 MHz, 6 W 200 MHz 750 MHz Intel Pentium Silver N5000 4 x 1100 MHz, 6 W 200 MHz 750 MHz min. - max. 200 - 300 MHz 750 - 1000 MHz
CPU in HD Graphics 500 GPU Base Speed GPU Boost / Turbo Intel Celeron J3455 4 x 1500 MHz, 10 W 250 MHz 750 MHz Intel Celeron N3450 4 x 1100 MHz, 6 W 200 MHz 700 MHz Intel Celeron J3355 2 x 2000 MHz, 10 W 250 MHz 700 MHz Intel Celeron N3350 2 x 1100 MHz, 6 W 200 MHz 650 MHz min. - max. 200 - 300 MHz 650 - 1000 MHz
Benchmarks Performance Rating - 3DMark 11 + Fire Strike + Time Spy - HD Graphics 515
0.3 pt (1%)
...
...
max:
Performance Rating - 3DMark 11 + Fire Strike + Time Spy - UHD Graphics 605
0.2 pt (1%)
...
...
max:
Performance Rating - 3DMark 11 + Fire Strike + Time Spy - HD Graphics 500
0.2 pt (0%)
...
...
max:
3DMark - 3DMark Time Spy Score
129 Points (0%)
3DMark - 3DMark Time Spy Graphics
113 Points (0%)
3DMark - 3DMark Ice Storm Unlimited Graphics
min: 43449 avg: 58940 median: 56787 (6%) max: 78808 Points
min: 32770 avg: 43574 median: 45008 (5%) max: 55453 Points
min: 19294 avg: 24491 median: 24609 (3%) max: 29579 Points
3DMark - 3DMark Ice Storm Extreme Graphics
min: 18749 avg: 24669 median: 23314 (3%) max: 33413 Points
min: 13350 avg: 16118 median: 16553.5 (2%) max: 18016 Points
min: 12299 avg: 15195 median: 15085 (2%) max: 18200 Points
3DMark - 3DMark Cloud Gate Score
min: 2705 avg: 3940 median: 3850.5 (4%) max: 5257 Points
min: 2670 avg: 3247 median: 3154 (3%) max: 4294 Points
min: 1932 avg: 2140 median: 2116 (2%) max: 2306 Points
3DMark - 3DMark Cloud Gate Graphics
min: 3982 avg: 5440 median: 5467 (1%) max: 7035 Points
min: 2874 avg: 3518 median: 3359.5 (1%) max: 4485 Points
min: 2578 avg: 3030 median: 3007 (1%) max: 3693 Points
3DMark - 3DMark Fire Strike Standard Score
min: 453 avg: 617 median: 623.5 (1%) max: 780 Points
min: 376 avg: 450.1 median: 419 (1%) max: 620 Points
min: 271 avg: 321.5 median: 307 (1%) max: 401 Points
3DMark - 3DMark Fire Strike Standard Graphics
min: 494 avg: 679 median: 691.5 (1%) max: 892 Points
min: 411 avg: 473.4 median: 454 (1%) max: 576 Points
min: 293 avg: 355.9 median: 362.5 (0%) max: 444 Points
3DMark - 3DMark Ice Storm Graphics
min: 31627 avg: 44439 median: 45108 (5%) max: 54558 Points
min: 20859 avg: 25930 median: 26031 (3%) max: 30797 Points
min: 20140 avg: 26074 median: 23761 (3%) max: 34320 Points
3DMark - 3DMark Sling Shot (ES 3.0) Unlimited
2870 Points (12%)
3DMark - 3DMark Sling Shot (ES 3.0) Unlimited Graphics
2805 Points (6%)
3DMark - 3DMark Sling Shot Extreme (ES 3.1) Unlimited
1628 Points (8%)
3DMark - 3DMark Sling Shot Extreme (ES 3.1) Unlimited Graphics
1450 Points (4%)
3DMark - 3DMark Wild Life Unlimited
882 Points (0%)
3DMark - 3DMark Wild Life Extreme Unlimited
281 Points (0%)
3DMark - 3DMark Night Raid
min: 1614 avg: 1751 median: 1619 (2%) max: 2019 Points
3DMark - 3DMark Night Raid Graphics Score
min: 1849 avg: 2059 median: 1893 (1%) max: 2434 Points
3DMark 11 - 3DM11 Performance Score
min: 785 avg: 1105 median: 1115 (2%) max: 1360 Points
min: 655 avg: 795 median: 748 (1%) max: 1009 Points
min: 414 avg: 533 median: 530 (1%) max: 655 Points
3DMark 11 - 3DM11 Performance GPU
min: 714 avg: 1013 median: 1014 (1%) max: 1254 Points
min: 588 avg: 701 median: 648 (1%) max: 902 Points
min: 368 avg: 478.6 median: 482 (0%) max: 584 Points
3DMark Vantage + Intel HD Graphics 515 3DMark Vantage - 3DM Vant. Perf. total
4672 Points (1%)
3DM Vant. Perf. total + Intel UHD Graphics 605
2162 Points (1%)
3DM Vant. Perf. GPU no PhysX + Intel HD Graphics 515 3DMark Vantage - 3DM Vant. Perf. GPU no PhysX
4218 Points (2%)
3DM Vant. Perf. GPU no PhysX + Intel UHD Graphics 605
1785 Points (1%)
3DMark 2001SE - 3DMark 2001 - Standard
20345 Points (21%)
3DMark 03 - 3DMark 03 - Standard
18019 Points (9%)
8388 Points (4%)
3DMark 05 - 3DMark 05 - Standard
9173 Points (10%)
5802 Points (6%)
3DMark 06 3DMark 06 - Standard 1280x1024 + Intel HD Graphics 515
min: 4968 avg: 6621 median: 6446 (8%) max: 7912 Points
3DMark 06 - Standard 1280x1024 + Intel UHD Graphics 605
min: 2882 avg: 4208 median: 4171 (5%) max: 5570 Points
3DMark 06 - Standard 1280x1024 + Intel HD Graphics 500
min: 3393 avg: 3551 median: 3506 (5%) max: 3753 Points
Unigine Valley 1.0 - Unigine Valley 1.0 DX
1.7 fps (1%)
Unigine Heaven 3.0 - Unigine Heaven 3.0 DX 11
6.5 fps (2%)
Unigine Heaven 3.0 - Unigine Heaven 3.0 OpenGL
7.2 fps (3%)
Unigine Heaven 2.1 - Heaven 2.1 high
min: 15.7 avg: 16.9 median: 16.9 (3%) max: 18 fps
9 fps (2%)
SPECviewperf 12 + Intel HD Graphics 515 SPECviewperf 12 - specvp12 sw-03
17.6 fps (4%)
specvp12 snx-02 + Intel HD Graphics 515 SPECviewperf 12 - specvp12 snx-02
2.1 fps (0%)
specvp12 showcase-01 + Intel HD Graphics 515 SPECviewperf 12 - specvp12 showcase-01
5 fps (1%)
specvp12 mediacal-01 + Intel HD Graphics 515 SPECviewperf 12 - specvp12 mediacal-01
1.8 fps (0%)
specvp12 maya-04 + Intel HD Graphics 515 SPECviewperf 12 - specvp12 maya-04
9 fps (2%)
specvp12 energy-01 + Intel HD Graphics 515 SPECviewperf 12 - specvp12 energy-01
0.1 fps (0%)
specvp12 creo-01 + Intel HD Graphics 515 SPECviewperf 12 - specvp12 creo-01
7.9 fps (3%)
specvp12 catia-04 + Intel HD Graphics 515 SPECviewperf 12 - specvp12 catia-04
9.8 fps (2%)
Cinebench R10 Cinebench R10 Shading (32bit) + Intel HD Graphics 515 Cinebench R10 - Cinebench R10 Shading (32bit)
min: 4740 avg: 6063 median: 6088 (4%) max: 7263 Points
Cinebench R10 Shading (32bit) + Intel UHD Graphics 605
min: 3505 avg: 3812 median: 3773 (3%) max: 4366 Points
Cinebench R10 Shading (32bit) + Intel HD Graphics 500
min: 2791 avg: 2888 median: 2894 (2%) max: 3031 Points
Cinebench R11.5 Cinebench R11.5 OpenGL 64 Bit + Intel HD Graphics 515 Cinebench R11.5 - Cinebench R11.5 OpenGL 64 Bit
min: 16.86 avg: 23.6 median: 23.1 (8%) max: 31.86 fps
Cinebench R11.5 OpenGL 64 Bit + Intel UHD Graphics 605
min: 15.24 avg: 17.9 median: 17.9 (6%) max: 20.5 fps
Cinebench R11.5 OpenGL 64 Bit + Intel HD Graphics 500
min: 7.05 avg: 8.2 median: 8.1 (3%) max: 9.61 fps
Cinebench R15 + Intel HD Graphics 515 Cinebench R15 - Cinebench R15 OpenGL 64 Bit
min: 18.93 avg: 28.6 median: 29.4 (2%) max: 35.98 fps
Cinebench R15 OpenGL 64 Bit + Intel UHD Graphics 605
min: 13.37 avg: 18.2 median: 18.1 (1%) max: 25.6 fps
Cinebench R15 OpenGL 64 Bit + Intel HD Graphics 500
min: 10.15 avg: 12.9 median: 13 (1%) max: 15.74 fps
Cinebench R15 OpenGL Ref. Match 64 Bit + Intel HD Graphics 515 Cinebench R15 - Cinebench R15 OpenGL Ref. Match 64 Bit
min: 97.7 avg: 98 median: 97.8 (98%) max: 99.3 %
Cinebench R15 OpenGL Ref. Match 64 Bit + Intel UHD Graphics 605
97.8 % (98%)
Cinebench R15 OpenGL Ref. Match 64 Bit + Intel HD Graphics 500
min: 97.7 avg: 97.8 median: 97.8 (98%) max: 98 %
GFXBench - GFXBench 5.0 Aztec Ruins High Tier Offscreen
min: 5.9 avg: 6.4 median: 6.4 (1%) max: 6.8 fps
3.6 fps (1%)
GFXBench - GFXBench 5.0 Aztec Ruins Normal Tier Offscreen
min: 9.9 avg: 12.8 median: 12.8 (1%) max: 15.7 fps
9.7 fps (1%)
GFXBench - GFXBench Car Chase Offscreen
20.9 fps (2%)
min: 7.1 avg: 11 median: 11.3 (1%) max: 14.6 fps
8.4 fps (1%)
GFXBench 3.1 - GFXBench Manhattan ES 3.1 Offscreen
min: 25.5 avg: 27.7 median: 27.7 (1%) max: 29.9 fps
min: 13 avg: 17.6 median: 16.5 (0%) max: 23.3 fps
15 fps (0%)
GFXBench 3.0 - GFXBench 3.0 Manhattan Offscreen
min: 31.9 avg: 36.5 median: 36.7 (2%) max: 43.6 fps
min: 16 avg: 23.8 median: 22.1 (1%) max: 33.4 fps
20 fps (1%)
GFXBench (DX / GLBenchmark) 2.7 + Intel HD Graphics 515 GFXBench (DX / GLBenchmark) 2.7 - GFXBench T-Rex HD Offscreen C24Z16
min: 70 avg: 75.4 median: 73.2 (1%) max: 87 fps
GFXBench T-Rex HD Offscreen C24Z16 + Intel UHD Graphics 605 min: 32 avg: 43.1 median: 45.5 (0%) max: 51.9 fps
GFXBench T-Rex HD Offscreen C24Z16 + Intel HD Graphics 500 42 fps (0%)
Basemark GPU 1.2 - Basemark GPU 1.2 Vulkan Official Medium Offscreen 1080
23.3 fps (0%)
16.3 fps (0%)
Basemark GPU 1.2 - Basemark GPU 1.2 Vulkan Official High Offscreen 2160
2 fps (0%)
LuxMark v2.0 64Bit - LuxMark v2.0 Room GPU
min: 173 avg: 183 median: 183 (1%) max: 193 Samples/s
min: 67 avg: 93.5 median: 93.5 (0%) max: 120 Samples/s
49 Samples/s (0%)
LuxMark v2.0 64Bit - LuxMark v2.0 Sala GPU
min: 395 avg: 413.5 median: 416 (1%) max: 427 Samples/s
min: 96 avg: 142 median: 142 (0%) max: 188 Samples/s
79 Samples/s (0%)
ComputeMark v2.1 - ComputeMark v2.1 Result
min: 476 avg: 660 median: 704 (1%) max: 741 Points
min: 432 avg: 490.5 median: 490.5 (1%) max: 549 Points
min: 296 avg: 320 median: 324 (0%) max: 336 Points
Power Consumption - Furmark Stress Test Power Consumption - external Monitor *
min: 10.3 avg: 11 median: 11 (2%) max: 11.6 Watt
8.9 Watt (1%)
Power Consumption - Witcher 3 Power Consumption *
11.8 Watt (3%)
Power Consumption - Witcher 3 ultra Power Efficiency
0.1 fps per Watt (10%)
Clock Speed - GPU Clock Speed Furmark
515 MHz (20%)
450 MHz (18%)
Average Benchmarks Intel HD Graphics 515 → 100% n=21 Average Benchmarks Intel UHD Graphics 605 → 65% n=21 Average Benchmarks Intel HD Graphics 500 → 50% n=21
- Bereich der Benchmarkergebnisse für diese Grafikkarte
- Durchschnittliche Benchmarkergebnisse für diese Grafikkarte
* Smaller numbers mean a higher performance
1 This benchmark is not used for the average calculation
Spiele-Benchmarks Die folgenden Benchmarks basieren auf unseren Spieletests mit Testnotebooks. Die Performance dieser Grafikkarte bei den gelisteten Spielen ist abhängig von der verwendeten CPU, Speicherausstattung, Treiber und auch Betriebssystem. Dadurch müssen die untenstehenden Werte nicht repräsentativ sein. Detaillierte Informationen über das verwendete System sehen Sie nach einem Klick auf den fps-Wert.
UHD Graphics 605:
31.1 [X] Topjoy Falcon Intel Pentium Silver N5000 1.1GHz
UHD Graphics 605
min:
26 fps, max:
58 fps
fps
UHD Graphics 605:
7 8.2 [X] Topjoy Falcon Intel Pentium Silver N5000 1.1GHz
UHD Graphics 605
min:
6 fps, max:
11 fps
~ 8 fps
UHD Graphics 605:
49.8 [X] Topjoy Falcon Intel Pentium Silver N5000 1.1GHz
UHD Graphics 605
min:
41 fps, max:
60 fps
fps
UHD Graphics 605:
39 [X] Topjoy Falcon Intel Pentium Silver N5000 1.1GHz
UHD Graphics 605
min:
24 fps, max:
50 fps
fps
UHD Graphics 605:
26.6 [X] Topjoy Falcon Intel Pentium Silver N5000 1.1GHz
UHD Graphics 605
min:
18 fps, max:
34 fps
fps
UHD Graphics 605:
24.9 [X] Topjoy Falcon Intel Pentium Silver N5000 1.1GHz
UHD Graphics 605
min:
17 fps, max:
32 fps
fps
UHD Graphics 605:
23.6 [X] Topjoy Falcon Intel Pentium Silver N5000 1.1GHz
UHD Graphics 605
min:
11 fps, max:
33 fps
fps
UHD Graphics 605:
15 [X] Topjoy Falcon Intel Pentium Silver N5000 1.1GHz
UHD Graphics 605
min:
8 fps, max:
22 fps
fps
UHD Graphics 605:
11.7 (!) [X] Topjoy Falcon Intel Pentium Silver N5000 1.1GHz
UHD Graphics 605
min:
9 fps, max:
15 fps
17.6 ~ 15 fps
100%
HD Graphics 515:
21 (!) [X] Cube i9 Intel Core m3-6Y30 0.9GHz
HD Graphics 515
max:
30 fps
fps
HD Graphics 500:
0 (!) [X] Jumper EZbook 3 Intel Celeron N3350 1.1GHz
HD Graphics 500
fps
HD Graphics 500:
34.4 (!) [X] Jumper EZbook 3 Intel Celeron N3350 1.1GHz
HD Graphics 500
max:
93 fps
fps
HD Graphics 500:
4.6 (!) [X] Jumper EZbook 3 Intel Celeron N3350 1.1GHz
HD Graphics 500
max:
9 fps
fps
100%
HD Graphics 515:
14.4 [X] Cube i9 Intel Core m3-6Y30 0.9GHz
HD Graphics 515
fps
49%
UHD Graphics 605:
5 6.4 7.2 8.6 [X] Intel NUC7PJYHN Intel Pentium Silver J5040 2GHz
UHD Graphics 605
9.1 ~ 7 fps
UHD Graphics 605:
3.5 5.9 6 6.1 [X] Intel NUC7PJYHN Intel Pentium Silver J5040 2GHz
UHD Graphics 605
~ 5 fps
HD Graphics 500:
3.9 4.7 ~ 4 fps
UHD Graphics 605:
3.1 5.3 5.5 5.5 [X] Intel NUC7PJYHN Intel Pentium Silver J5040 2GHz
UHD Graphics 605
~ 5 fps
HD Graphics 500:
3.6 4.3 ~ 4 fps
UHD Graphics 605:
3.4 4.2 4.4 5.2 7.5 [X] Intel NUC7PJYHN 1.3
Intel Pentium Silver J5040 2GHz
UHD Graphics 605
~ 5 fps
UHD Graphics 605:
3.3 [X] Intel NUC7PJYHN 1.3
Intel Pentium Silver J5040 2GHz
UHD Graphics 605
fps
100%
HD Graphics 515:
42 48 [X] Cube i9 Intel Core m3-6Y30 0.9GHz
HD Graphics 515
min:
42 fps
~ 45 fps
89%
UHD Graphics 605:
38 41.4 ~ 40 fps
100%
HD Graphics 515:
30 36 [X] Cube i9 Intel Core m3-6Y30 0.9GHz
HD Graphics 515
min:
32 fps
~ 33 fps
109%
UHD Graphics 605:
34.5 36.5 ~ 36 fps
52%
HD Graphics 500:
17.2 fps
100%
HD Graphics 515:
14 24 [X] Cube i9 Intel Core m3-6Y30 0.9GHz
HD Graphics 515
min:
20 fps
~ 19 fps
95%
UHD Graphics 605:
17 18.4 ~ 18 fps
100%
HD Graphics 515:
26.6 [X] Cube i9 Intel Core m3-6Y30 0.9GHz
HD Graphics 515
min:
23 fps, max:
29 fps
fps
71%
UHD Graphics 605:
18.8 fps
38%
HD Graphics 500:
10 fps
100%
HD Graphics 515:
28 30.1 [X] Cube i9 Intel Core m3-6Y30 0.9GHz
HD Graphics 515
min:
15 fps, max:
44 fps
~ 29 fps
62%
HD Graphics 500:
18.1 fps
100%
HD Graphics 515:
10.7 [X] Cube i9 Intel Core m3-6Y30 0.9GHz
HD Graphics 515
max:
16 fps
11 ~ 11 fps
91%
UHD Graphics 605:
9.9 10 ~ 10 fps
56%
HD Graphics 500:
6.2 fps
100%
HD Graphics 515:
9.4 fps
34%
UHD Graphics 605:
3.2 fps
100%
HD Graphics 515:
4.3 fps
100%
HD Graphics 515:
17.2 fps
52%
UHD Graphics 605:
9 fps
51%
HD Graphics 500:
8.7 fps
100%
HD Graphics 515:
6.6 fps
100%
HD Graphics 515:
22.3 fps
35%
UHD Graphics 605:
7.9 fps
100%
HD Graphics 515:
10.3 fps
100%
HD Graphics 515:
48 [X] Cube i9 Intel Core m3-6Y30 0.9GHz
HD Graphics 515
min:
42 fps, max:
60 fps
fps
100%
HD Graphics 515:
24.1 [X] Cube i9 Intel Core m3-6Y30 0.9GHz
HD Graphics 515
min:
19 fps, max:
30 fps
fps
100%
HD Graphics 515:
10.1 [X] Cube i9 Intel Core m3-6Y30 0.9GHz
HD Graphics 515
min:
8 fps, max:
14 fps
fps
100%
HD Graphics 515:
21.5 fps
59%
UHD Graphics 605:
12.7 fps
100%
HD Graphics 515:
10.3 fps
53%
UHD Graphics 605:
5.5 fps
100%
HD Graphics 515:
10.7 fps
100%
HD Graphics 515:
7.8 fps
100%
HD Graphics 515:
11.4 [X] Cube i9 Intel Core m3-6Y30 0.9GHz
HD Graphics 515
min:
5 fps, max:
15 fps
fps
100%
HD Graphics 515:
13.8 21.7 [X] Cube i9 Intel Core m3-6Y30 0.9GHz
HD Graphics 515
min:
14 fps, max:
30 fps
~ 18 fps
63%
UHD Graphics 605:
11.4 fps
88%
HD Graphics 500:
15.9 fps
100%
HD Graphics 515:
8.4 fps
99%
UHD Graphics 605:
8.3 fps
100%
HD Graphics 515:
6.1 8.4 ~ 7 fps
100%
HD Graphics 515:
5.9 fps
100%
HD Graphics 515:
10.1 fps
100%
HD Graphics 515:
9.2 fps
100%
HD Graphics 515:
12 fps
36%
UHD Graphics 605:
4.3 fps
100%
HD Graphics 515:
8.4 fps
100%
HD Graphics 515:
11 fps
100%
HD Graphics 515:
5 fps
100%
HD Graphics 515:
11.2 fps
100%
HD Graphics 515:
4.9 fps
115%
UHD Graphics 605:
6.9 fps
100%
HD Graphics 515:
25.7 fps
48%
UHD Graphics 605:
12.3 fps
60%
HD Graphics 500:
15.5 fps
100%
HD Graphics 515:
15.2 fps
100%
HD Graphics 515:
13.1 fps
100%
HD Graphics 515:
8.7 fps
100%
HD Graphics 515:
18.7 fps
100%
HD Graphics 515:
10.4 fps
100%
HD Graphics 515:
12.4 fps
100%
HD Graphics 515:
8.1 fps
100%
HD Graphics 515:
15.5 fps
100%
HD Graphics 515:
9.3 fps
100%
HD Graphics 515:
42 (!) fps
100%
HD Graphics 515:
32 [X] Cube i9 Intel Core m3-6Y30 0.9GHz
HD Graphics 515
min:
13 fps, max:
48 fps
32.1 42.8 ~ 36 fps
67%
UHD Graphics 605:
22.7 24.7 [X] Topjoy Falcon Intel Pentium Silver N5000 1.1GHz
UHD Graphics 605
min:
11 fps, max:
35 fps
~ 24 fps
53%
HD Graphics 500:
19.1 fps
100%
HD Graphics 515:
23.6 [X] Cube i9 Intel Core m3-6Y30 0.9GHz
HD Graphics 515
min:
10 fps, max:
42 fps
26.3 30.2 ~ 27 fps
53%
UHD Graphics 605:
14.3 fps
100%
HD Graphics 515:
7.4 11.7 ~ 10 fps
100%
HD Graphics 515:
25.7 fps
84%
UHD Graphics 605:
21.6 fps
64%
HD Graphics 500:
16.4 fps
100%
HD Graphics 515:
15.3 fps
103%
UHD Graphics 605:
15.8 fps
63%
HD Graphics 500:
9.7 fps
100%
HD Graphics 515:
48 [X] Cube i9 Intel Core m3-6Y30 0.9GHz
HD Graphics 515
min:
42.2 fps
fps
77%
UHD Graphics 605:
32.5 33.7 35 35.9 36.5 49.5 [X] Intel NUC7PJYHN Intel Pentium Silver J5040 2GHz
UHD Graphics 605
min:
42.8 fps, max:
-1 fps
~ 37 fps
100%
HD Graphics 515:
25.4 [X] Cube i9 Intel Core m3-6Y30 0.9GHz
HD Graphics 515
min:
21.5 fps
30 [X] Cube i9 Intel Core m3-6Y30 0.9GHz
HD Graphics 515
~ 28 fps
54%
UHD Graphics 605:
11.5 14 14.3 14.3 15.1 18.6 [X] Intel NUC7PJYHN Intel Pentium Silver J5040 2GHz
UHD Graphics 605
min:
13.1 fps, max:
-1 fps
~ 15 fps
100%
HD Graphics 515:
9.4 [X] Cube i9 Intel Core m3-6Y30 0.9GHz
HD Graphics 515
min:
8.7 fps
fps
85%
UHD Graphics 605:
5.9 6.7 7.4 7.8 10.6 [X] Intel NUC7PJYHN Intel Pentium Silver J5040 2GHz
UHD Graphics 605
min:
8.7 fps, max:
-1 fps
~ 8 fps
60%
HD Graphics 500:
5.6 fps
100%
HD Graphics 515:
8.1 [X] Cube i9 Intel Core m3-6Y30 0.9GHz
HD Graphics 515
min:
7.1 fps
fps
99%
UHD Graphics 605:
5.9 6.7 10 [X] Intel NUC7PJYHN Intel Pentium Silver J5040 2GHz
UHD Graphics 605
min:
8.2 fps, max:
-1 fps
~ 8 fps
63%
HD Graphics 500:
5.1 fps
100%
HD Graphics 515:
7.1 fps
100%
HD Graphics 515:
57 [X] Dell Latitude 12 E7275 Intel Core m7-6Y75 1.2GHz
HD Graphics 515
57.8 65.7 67.2 ~ 62 fps
68%
UHD Graphics 605:
42 fps
46%
HD Graphics 500:
28.5 fps
100%
HD Graphics 515:
13.9 [X] Dell Latitude 12 E7275 Intel Core m7-6Y75 1.2GHz
HD Graphics 515
14.4 15.8 16 ~ 15 fps
83%
UHD Graphics 605:
12.5 fps
83%
HD Graphics 500:
12.5 fps
100%
HD Graphics 515:
12.5 fps
UHD Graphics 605:
9.5 11.6 11.7 [X] Topjoy Falcon Intel Pentium Silver N5000 1.1GHz
UHD Graphics 605
min:
0.501 fps, P1:
5.85 fps, max:
33.2 fps
~ 11 fps
UHD Graphics 605:
9.3 [X] Topjoy Falcon Intel Pentium Silver N5000 1.1GHz
UHD Graphics 605
min:
0.3784 fps, P1:
4.59 fps, max:
34.4 fps
fps
45%
UHD Graphics 605:
10.9 fps
50%
UHD Graphics 605:
9.5 fps
100%
HD Graphics 515:
6.8 8.3 ~ 8 fps
50%
UHD Graphics 605:
4 fps
100%
HD Graphics 515:
4.1 fps
100%
HD Graphics 515:
13.5 fps
58%
UHD Graphics 605:
7.8 fps
100%
HD Graphics 515:
9.3 fps
67%
UHD Graphics 605:
6.2 fps
100%
HD Graphics 515:
41 41 ~ 41 fps
76%
UHD Graphics 605:
31 fps
54%
HD Graphics 500:
22 fps
100%
HD Graphics 515:
27 28 ~ 28 fps
71%
UHD Graphics 605:
20 fps
57%
HD Graphics 500:
16 fps
100%
HD Graphics 515:
15 17 ~ 16 fps
81%
UHD Graphics 605:
13 fps
100%
HD Graphics 515:
12.5 fps
UHD Graphics 605:
17.5 fps
UHD Graphics 605:
13.1 fps
UHD Graphics 605:
14.4 fps
100%
HD Graphics 515:
38.3 fps
100%
HD Graphics 515:
29.6 fps
100%
HD Graphics 515:
15.1 fps
100%
HD Graphics 515:
161.1 fps
60%
UHD Graphics 605:
96.9 fps
44%
HD Graphics 500:
71.6 fps
100%
HD Graphics 515:
39.2 fps
56%
UHD Graphics 605:
21.8 fps
35%
HD Graphics 500:
13.7 fps
100%
HD Graphics 515:
17.1 fps
61%
UHD Graphics 605:
10.5 fps
100%
HD Graphics 515:
10.4 fps
UHD Graphics 605:
14.3 fps
100%
HD Graphics 515:
86.5 fps
68%
UHD Graphics 605:
58.5 fps
51%
HD Graphics 500:
43.8 fps
100%
HD Graphics 515:
26.3 fps
63%
UHD Graphics 605:
16.5 fps
73%
HD Graphics 500:
19.1 fps
100%
HD Graphics 515:
14.9 fps
84%
UHD Graphics 605:
12.5 fps
100%
HD Graphics 515:
12.5 fps
100%
HD Graphics 515:
6.7 10.1 ~ 8 fps
100%
HD Graphics 515:
7.5 fps
UHD Graphics 605:
34.7 fps
UHD Graphics 605:
17.1 fps
100%
HD Graphics 515:
9 fps
54%
HD Graphics 500:
2.7 fps
100%
HD Graphics 515:
80.8 fps
100%
HD Graphics 515:
24.9 fps
100%
HD Graphics 515:
14.6 fps
73%
UHD Graphics 605:
31.6 fps
50%
HD Graphics 500:
21.5 fps
88%
UHD Graphics 605:
18.5 fps
44%
HD Graphics 500:
9.3 fps
78%
UHD Graphics 605:
12.5 fps
100%
HD Graphics 515:
20.2 fps
100%
HD Graphics 515:
12.9 fps
100%
HD Graphics 515:
8.3 fps
UHD Graphics 605:
32.3 fps
UHD Graphics 605:
17.1 fps
UHD Graphics 605:
14.1 fps
100%
HD Graphics 515:
76.7 fps
20%
HD Graphics 500:
14 16.6 ~ 15 fps
100%
HD Graphics 515:
57.3 fps
24%
HD Graphics 500:
14 fps
100%
HD Graphics 515:
35.1 fps
100%
HD Graphics 515:
20.2 fps
100%
HD Graphics 515:
61.9 fps
47%
UHD Graphics 605:
28.8 fps
27%
HD Graphics 500:
12.7 22 ~ 17 fps
100%
HD Graphics 515:
41.8 fps
50%
UHD Graphics 605:
21.1 fps
33%
HD Graphics 500:
13.6 fps
100%
HD Graphics 515:
35.1 fps
53%
UHD Graphics 605:
18.6 fps
100%
HD Graphics 515:
20.5 fps
61%
UHD Graphics 605:
12.5 fps
69%
UHD Graphics 605:
35 fps
55%
HD Graphics 500:
27.8 fps
62%
UHD Graphics 605:
18 fps
42%
HD Graphics 500:
12.2 fps
67%
UHD Graphics 605:
11.4 fps
100%
HD Graphics 515:
9.6 fps
100%
HD Graphics 515:
31.1 fps
64%
UHD Graphics 605:
19.9 fps
36%
HD Graphics 500:
11.2 fps
100%
HD Graphics 515:
18.7 fps
66%
UHD Graphics 605:
12.3 fps
41%
HD Graphics 500:
7.6 fps
100%
HD Graphics 515:
11.6 fps
65%
UHD Graphics 605:
7.5 fps
100%
HD Graphics 515:
7.1 fps
100%
HD Graphics 515:
50 fps
55%
UHD Graphics 605:
27.4 fps
46%
HD Graphics 500:
22.9 fps
100%
HD Graphics 515:
27.2 fps
78%
UHD Graphics 605:
21.2 fps
41%
HD Graphics 500:
11.1 fps
100%
HD Graphics 515:
11.2 fps
60%
UHD Graphics 605:
6.7 fps
UHD Graphics 605:
55.6 fps
UHD Graphics 605:
22.7 fps
UHD Graphics 605:
15.2 fps
UHD Graphics 605:
12.5 fps
UHD Graphics 605:
78.7 fps
UHD Graphics 605:
17.4 fps
Average Gaming Intel HD Graphics 515 → 100% Average Gaming 30-70 fps → 100%
Average Gaming Intel UHD Graphics 605 → 68% Average Gaming 30-70 fps → 76%
Average Gaming Intel HD Graphics 500 → 50% Average Gaming 30-70 fps → 51%
v1.26
log 28. 23:02:32
#0 checking url part for id 6450 +0s ... 0s
#1 checking url part for id 8270 +0s ... 0s
#2 checking url part for id 7543 +0s ... 0s
#3 not redirecting to Ajax server +0s ... 0s
#4 did not recreate cache, as it is less than 5 days old! Created at Sun, 28 Apr 2024 05:41:30 +0200 +0.001s ... 0.001s
#5 composed specs +0.165s ... 0.166s
#6 did output specs +0s ... 0.166s
#7 start showIntegratedCPUs +0s ... 0.166s
#8 getting avg benchmarks for device 6450 +0.055s ... 0.221s
#9 got single benchmarks 6450 +0.095s ... 0.316s
#10 getting avg benchmarks for device 8270 +0.015s ... 0.332s
#11 got single benchmarks 8270 +0.047s ... 0.379s
#12 getting avg benchmarks for device 7543 +0.014s ... 0.393s
#13 got single benchmarks 7543 +0.09s ... 0.483s
#14 got avg benchmarks for devices +0s ... 0.483s
#15 min, max, avg, median took s +0.402s ... 0.886s
#16 before gaming benchmark output +0s ... 0.886s
#17 Got 586 rows for game benchmarks. +0.082s ... 0.968s
#18 composed SQL query for gamebenchmarks +0s ... 0.968s
#19 got data and put it in $dataArray +0.063s ... 1.032s
#20 benchmarks composed for output. +0.192s ... 1.224s
#21 calculated avg scores. +0s ... 1.224s
#22 return log +0.003s ... 1.227s
Teilen Sie diesen Artikel, um uns zu unterstützen. Jeder Link hilft!
Autor: Klaus Hinum, 8.09.2017 (Update: 1.07.2023)
 Deutsch
 English
 Español
 Français
 Italiano
 Nederlands
 Polski
 Português
 Русский
 Türkçe
 Svenska
 Chinese
 Magyar