NVIDIA GeForce RTX 2060 (Desktop) vs NVIDIA GeForce RTX 2070 Super Max-Q vs NVIDIA GeForce RTX 2070 Mobile
NVIDIA GeForce RTX 2060 (Desktop) ► remove from comparison
Die Nvidia GeForce RTX 2060 ist eine schnelle Mittelklasse-Grafikkarte für Desktops und basiert auf der Turing-Architektur. Die RTX 2060 verwendet einen abgespeckten TU106 Chip mit 1.920 Shader-Kernen, 48 ROPs, 120 TMUs, 240 KI-Kerne und einem 192 Bit Speicherbus für 6 GB GDDR6 (7 GHz Taktrate, 14 GHz effektiv führen zu 336 GB/s). Die gleich benannte Notebook-Version der RTX 2060 ist deutlich langsamer, da geringer getaktet (mehr Informationen auf dieser Seite ).
Features
Der TU106-Chip wird in 12nm gefertigt und bietet eine Reihe neuer Features, wie DLSS (Deep Learning Super Sampling) und Real Time Ray Tracing. Dadurch lassen sich vor allem Beleuchtungseffekte sehr viel realistischer darstellen. Weiterhin gibt es Support für DisplayPort 1.4 (ready), HDMI 2.0b, HDR, Simultaneous Multi-Projection (SMP) sowie H.265 Video De- und Encoding (PlayReady 3.0).
Performance
Die Performance der GeForce RTX 2060 ist in Full HD und maximalen Detailstufe in etwa auf dem Niveau einer Radeon RX Vega 64 bzw. zwischen GeForce GTX 1070 und GTX 1080 / 1070 Ti . Dadurch eignet sie sich bei anspruchsvollen Spielen am besten für Full HD mit vollen Details bzw. 2k - 4k bei weniger anspruchsvollen Spielen.
Leistungsaufnahme
Die Leistungsaufnahme der GeForce RTX 2060 wird vom Hersteller mit 160 Watt beziffert und liegt damit über dem Vorgänger GeForce GTX 1060 (120 Watt) .
NVIDIA GeForce RTX 2070 Super Max-Q ► remove from comparison
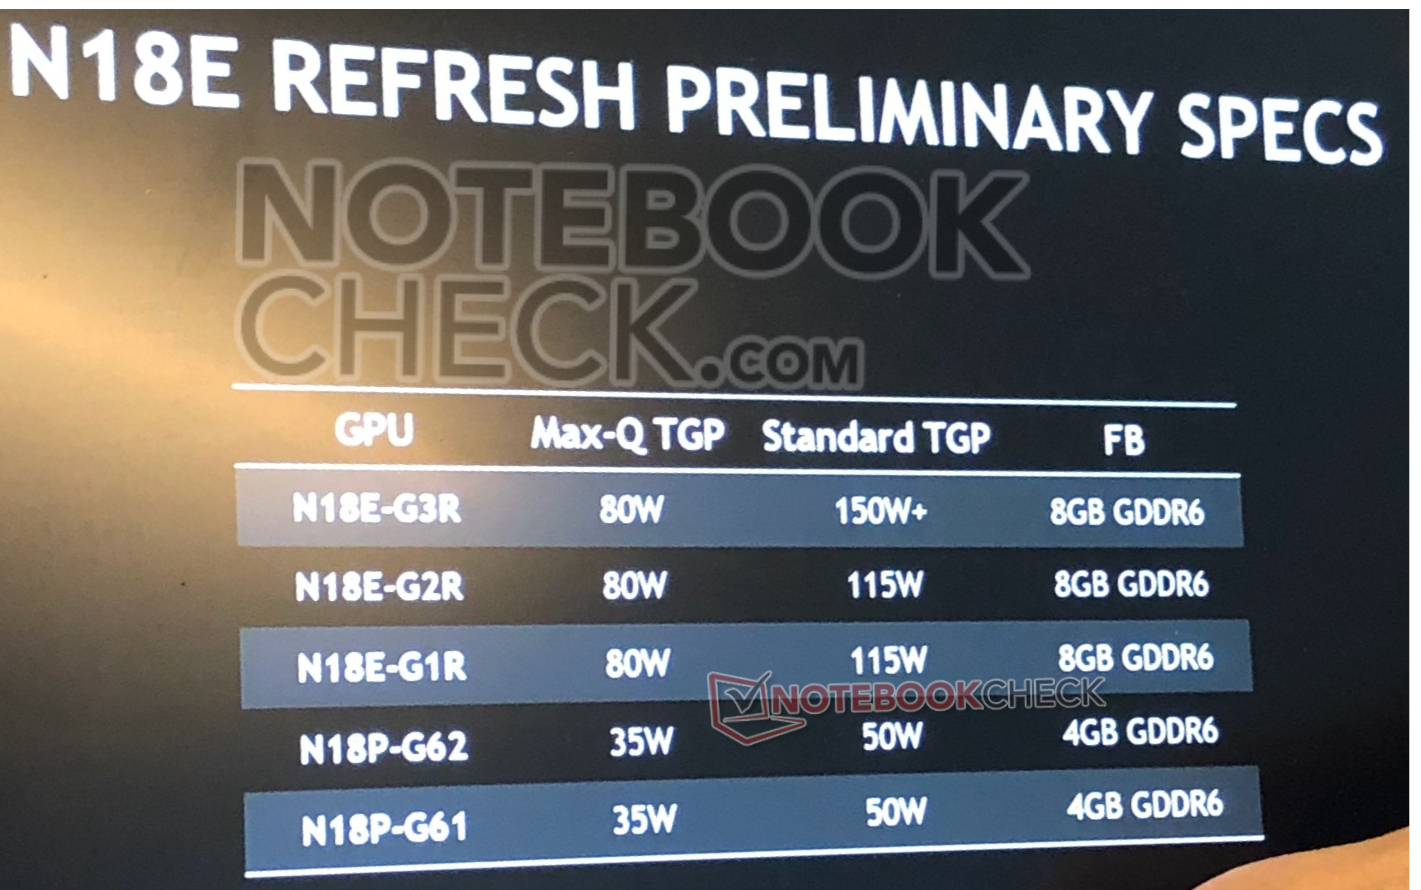
Die Nvidia GeForce RTX 2070 Super Max-Q (für Laptops) ist die Stromsparversion der mobilen GeForce RTX 2070 Super. Sie basiert auf den selben TU104-725-A1 Chip mit 2560 Shader, jedoch bei deutlich reduzierten Taktraten und Stromverbrauch. Es gibt drei Varianten mit einem TGP (Stromverbrauch des Chips) von 80, 85 und 90 Watt. Die Taktung ranginert von 930 - 1080 MHz für den Basistakt und 1155 - 1290 MHz im Boost. Die normale 2070 Super Mobile taktet mit 1140 - 1380 MHz bis zu 23% höher, die gleichnamige Desktop-Version ist nochmals schneller getaktet. Die GPU trägt den Codenamen N18E-G2R-A1 (für Refresh).
Mit dem Refresh wurden die Max-Q Technologien überarbeitet und bieten nun neben einer verbesserten Effizienz durch (neue Spannungswandler, Low-Power-GDDR6) auch zwei optionale Features. Der Notebookhersteller kann Dynamic Boost implementieren um Strom von der CPU zur GPU zu verlagern (TDP in 5 Watt Schritten). Weiters gibt es einen neuen "Dynamic Display Switch" für Advanced Optimus der G-SYNC und bis zu 4K 120 Hz ermöglichen.
Features
Der TU104-Chip wird in 12nm gefertigt und bietet eine Reihe neuer Features, wie DLSS (Deep Learning Super Sampling) und Real Time Ray Tracing. Dadurch lassen sich vor allem Beleuchtungseffekte sehr viel realistischer darstellen. Weiterhin gibt es Support für DisplayPort 1.4 (ready), HDMI 2.0b, HDR, Simultaneous Multi-Projection (SMP) sowie H.265 Video De- und Encoding (PlayReady 3.0).
Performance
Die Performance der mobilen GeForce RTX 2070 Super Max-Q sollte sich zwischen den alten RTX 2070 Max-Q und RTX 2070 Mobile GPUs einordnen und ist damit im im High-End-Segment und kann die meisten Spiele des Jahres 2019 in hohen Einstellungen und 4K-Auflösung flüssig darstellen.
Durch den verringerten Stromverbrauch von 80 - 90 Watt TGP eignet sich die RTX 2070 Super Max-Q auch für dünnere Gaming-Notebooks.
NVIDIA GeForce RTX 2070 Mobile ► remove from comparison
Die Nvidia GeForce RTX 2070 für Laptops ist nach der mobilen RTX 2080 die zweitschnellste mobile Grafikkarte in 2019. Sie basiert auf die Desktop RTX 2070 jedoch werden die Shader deutlich niedriger getaktet (-11% Boost, -14% Base). Die GPU verfügt ebenfalls über die 2.304 Shadereinheiten, sowie 8 GB GDDR6-Speicher an einem 256-Bit-Interface (14 GHz, 448 GB/s).
Mit dem "Super"-Refresh im April 2020 wird auch eine neue Version der RTX 2070 mit höheren Taktraten verfügbar sein (N18E-G1R-A1, TU106-735-A1 Chip). Diese taktet mit 1305 - 1485 MHz minimal höher bei gleichem Stromverbrauch. Der Speichertakt ist jedoch eventuell auf 5501 MHz verringert. Es gibt jedoch auch die schneller taktende RTX 2070 Super Mobile mit 2.560 Shader und geringeren Taktraten.
Features
Der TU106-Chip wird in 12nm gefertigt und bietet eine Reihe neuer Features, wie DLSS (Deep Learning Super Sampling) und Real Time Ray Tracing. Dadurch lassen sich vor allem Beleuchtungseffekte sehr viel realistischer darstellen. Weiterhin gibt es Support für DisplayPort 1.4 (ready), HDMI 2.0b, HDR, Simultaneous Multi-Projection (SMP) sowie H.265 Video De- und Encoding (PlayReady 3.0).
Performance
Die Performance der mobilen GeForce RTX 2070 sollte etwas unterhalb der Desktop RTX 2070 liegen und in etwa auf dem Niveau der mobilen GTX 1080 . Damit ordnet sich die RTX 2070 im absoluten High-End-Segment ein und kann die meisten Spiele des Jahres 2018 in hohen Einstellungen und 4K-Auflösung flüssig darstellen.
Der Stromverbrauch der normalen (Max-P) Notebook-Grafikkarte ist mit 115 Watt von Nvidia spezifiziert und damit 35 Watt höher als bei der Max-Q Version.
NVIDIA GeForce RTX 2060 (Desktop) NVIDIA GeForce RTX 2070 Super Max-Q NVIDIA GeForce RTX 2070 Mobile GeForce RTX 2000 Serie Codename Turing TU106 N18E-G2R N18E-G2 TU106 Architektur Turing Turing Turing Pipelines 1920 - unified 2560 - unified 2304 - unified Kerntakt 1320 - 1620 (Boost) MHz 930 - 1155 (Boost) MHz 1215 - 1440 (Boost) MHz Speichertakt 14000 MHz 11000 MHz 14000 MHz Speicherbandbreite 192 Bit 256 Bit 256 Bit Speichertyp GDDR6 GDDR6 GDDR6 Max. Speichergröße 6 GB 8 GB 8 GB Shared Memory nein nein nein API DirectX 12_1, Shader 6.4, OpenGL 4.6 DirectX 12_1, OpenGL 4.6 DirectX 12_1, OpenGL 4.6 Stromverbrauch 175 Watt 80 Watt 115 Watt Herstellungsprozess 12 nm 12 nm 12 nm Features DLSS, Raytraycing, VR Ready, G-SYNC, Vulkan, Multi Monitor DLSS, Raytraycing, VR Ready, G-SYNC, Vulkan, Multi Monitor, 550 Watt system power recommended DLSS, Raytraycing, VR Ready, G-SYNC, Vulkan, Multi Monitor, 550 Watt system power recommended Erscheinungsdatum 06.01.2019 02.04.2020 06.01.2019 Notebookgröße groß (17" z.B.) groß (17" z.B.) Transistors 10.8 Billion
Benchmarks Performance Rating - 3DMark 11 + Fire Strike + Time Spy - GeForce RTX 2060 (Desktop)
8.8 pt (26%)
...
NVIDIA GeForce RTX 2060 (Desktop)
...
Performance Rating - 3DMark 11 + Fire Strike + Time Spy - GeForce RTX 2070 Super Max-Q
9.5 pt (29%)
...
NVIDIA GeForce RTX 2070 Super Max-Q
...
Performance Rating - 3DMark 11 + Fire Strike + Time Spy - GeForce RTX 2070 Mobile
9.3 pt (28%)
...
NVIDIA GeForce RTX 2070 Mobile
...
3DMark - 3DMark Time Spy Score
7878 Points (23%)
min: 7199 avg: 7605 median: 7611.5 (22%) max: 8066 Points
GPU TDP ? TDP 80 W TDP 115 W 99% 93% 100%
min: 6890 avg: 7537 median: 7499 (22%) max: 8253 Points
GPU TDP ? TDP 80 W TDP 115 W 98% 93% 100%
3DMark - 3DMark Time Spy Graphics
7732 Points (20%)
min: 7084 avg: 7445 median: 7373.5 (20%) max: 7891 Points
GPU TDP ? TDP 80 W TDP 115 W 95% 91% 100%
min: 7006 avg: 7651 median: 7738 (20%) max: 8028 Points
GPU TDP ? TDP 80 W TDP 115 W 97% 91% 100%
3DMark - 3DMark Ice Storm Unlimited Graphics
424149 Points (48%)
min: 461097 avg: 461649 median: 461648 (52%) max: 462200 Points
GPU TDP ? TDP 115 W 96% 100%
min: 423684 avg: 445082 median: 444708 (50%) max: 467230 Points
GPU TDP ? TDP 115 W 96% 100%
3DMark - 3DMark Ice Storm Extreme Graphics
305160 Points (39%)
min: 150368 avg: 238420 median: 163308 (21%) max: 401585 Points
3DMark - 3DMark Cloud Gate Score
44523 Points (48%)
min: 38593 avg: 45672 median: 47119 (50%) max: 49917 Points
GPU TDP ? TDP 115 W 100% 87%
min: 25784 avg: 38327 median: 39206.5 (42%) max: 50713 Points
GPU TDP ? TDP 115 W 100% 99%
3DMark - 3DMark Cloud Gate Graphics
107083 Points (28%)
min: 65295 avg: 117307 median: 126747 (33%) max: 134954 Points
GPU TDP ? TDP 115 W 90% 100%
min: 64283 avg: 117543 median: 123004 (32%) max: 135881 Points
GPU TDP ? TDP 115 W 92% 100%
3DMark - 3DMark Fire Strike Standard Score
16267 Points (29%)
min: 16736 avg: 18097 median: 18395 (32%) max: 18947 Points
GPU TDP ? TDP 80 W TDP 115 W 97% 91% 100%
min: 15686 avg: 17675 median: 17762 (31%) max: 20183 Points
GPU TDP ? TDP 80 W TDP 115 W 96% 91% 100%
3DMark - 3DMark Fire Strike Standard Graphics
19338 Points (22%)
min: 18559 avg: 20277 median: 20872.5 (24%) max: 21446 Points
GPU TDP ? TDP 80 W TDP 115 W 94% 87% 100%
min: 18169 avg: 20123 median: 20392 (23%) max: 21138 Points
GPU TDP ? TDP 80 W TDP 115 W 94% 87% 100%
3DMark - 3DMark Ice Storm Graphics
333335 Points (40%)
66977 Points (8%)
min: 164562 avg: 304404 median: 303114 (36%) max: 446824 Points
3DMark - 3DMark Wild Life Unlimited
48041 Points (24%)
3DMark - 3DMark Night Raid
36093 Points (34%)
3DMark - 3DMark Night Raid Graphics Score
64571 Points (25%)
3DMark 11 - 3DM11 Performance Score
min: 22018 avg: 22982 median: 22982 (32%) max: 23946 Points
min: 20666 avg: 23000 median: 23755.5 (33%) max: 24383 Points
GPU TDP ? TDP 80 W TDP 115 W 100% 88% 93%
min: 17817 avg: 20620 median: 20935 (29%) max: 23447 Points
GPU TDP ? TDP 80 W TDP 115 W 99% 95% 100%
3DMark 11 - 3DM11 Performance GPU
min: 26413 avg: 27163 median: 27162.5 (23%) max: 27912 Points
min: 24244 avg: 27104 median: 27724 (24%) max: 28900 Points
GPU TDP ? TDP 80 W TDP 115 W 100% 88% 99%
min: 23335 avg: 25775 median: 26005 (22%) max: 27298 Points
GPU TDP ? TDP 80 W TDP 115 W 97% 89% 100%
3DMark Vantage + NVIDIA GeForce RTX 2060 (Desktop) 3DMark Vantage - 3DM Vant. Perf. total
60454 Points (18%)
3DM Vant. Perf. total + NVIDIA GeForce RTX 2070 Super Max-Q
65101 Points (19%)
3DM Vant. Perf. total + NVIDIA GeForce RTX 2070 Mobile
64151 Points (19%)
3DM Vant. Perf. GPU no PhysX + NVIDIA GeForce RTX 2060 (Desktop) 3DMark Vantage - 3DM Vant. Perf. GPU no PhysX
60862 Points (35%)
3DM Vant. Perf. GPU no PhysX + NVIDIA GeForce RTX 2070 Super Max-Q
69136 Points (39%)
3DM Vant. Perf. GPU no PhysX + NVIDIA GeForce RTX 2070 Mobile
68082 Points (39%)
3DMark 03 - 3DMark 03 - Standard
125706 Points (66%)
3DMark 05 - 3DMark 05 - Standard
34679 Points (38%)
3DMark 06 3DMark 06 - Standard 1280x1024 + NVIDIA GeForce RTX 2060 (Desktop)
33727 Points (44%)
3DMark 06 - Standard 1280x1024 + NVIDIA GeForce RTX 2070 Super Max-Q
43406 Points (57%)
3DMark 06 - Standard 1280x1024 + NVIDIA GeForce RTX 2070 Mobile
min: 39513 avg: 42028 median: 42409.5 (55%) max: 43781 Points
Unigine Valley 1.0 - Unigine Valley 1.0 DX
91.2 fps (30%)
SPECviewperf 12 + NVIDIA GeForce RTX 2060 (Desktop) SPECviewperf 12 - specvp12 sw-03
57.6 fps (14%)
specvp12 snx-02 + NVIDIA GeForce RTX 2060 (Desktop) SPECviewperf 12 - specvp12 snx-02
8.4 fps (1%)
specvp12 showcase-01 + NVIDIA GeForce RTX 2060 (Desktop) SPECviewperf 12 - specvp12 showcase-01
101 fps (22%)
specvp12 mediacal-01 + NVIDIA GeForce RTX 2060 (Desktop) SPECviewperf 12 - specvp12 mediacal-01
35.2 fps (9%)
specvp12 maya-04 + NVIDIA GeForce RTX 2060 (Desktop) SPECviewperf 12 - specvp12 maya-04
127.4 fps (35%)
specvp12 energy-01 + NVIDIA GeForce RTX 2060 (Desktop) SPECviewperf 12 - specvp12 energy-01
9.2 fps (8%)
specvp12 creo-01 + NVIDIA GeForce RTX 2060 (Desktop) SPECviewperf 12 - specvp12 creo-01
44.5 fps (18%)
specvp12 catia-04 + NVIDIA GeForce RTX 2060 (Desktop) SPECviewperf 12 - specvp12 catia-04
74.8 fps (12%)
specvp12 3dsmax-05 + NVIDIA GeForce RTX 2060 (Desktop) SPECviewperf 12 - specvp12 3dsmax-05
183.6 fps (32%)
SPECviewperf 13 specvp13 sw-04 + NVIDIA GeForce RTX 2060 (Desktop) SPECviewperf 13 - specvp13 sw-04
83.4 fps (22%)
specvp13 sw-04 + NVIDIA GeForce RTX 2070 Super Max-Q
min: 80.2 avg: 85.8 median: 85.8 (23%) max: 91.3 fps
GPU TDP ? TDP 80 W 100% 92%
specvp13 sw-04 + NVIDIA GeForce RTX 2070 Mobile
81.2 fps (22%)
GPU TDP ? TDP 80 W 100% 94%
specvp13 snx-03 + NVIDIA GeForce RTX 2060 (Desktop) SPECviewperf 13 - specvp13 snx-03
15 fps (2%)
specvp13 snx-03 + NVIDIA GeForce RTX 2070 Super Max-Q
min: 19.65 avg: 19.9 median: 19.9 (2%) max: 20.06 fps
GPU TDP ? TDP 80 W 89% 100%
specvp13 snx-03 + NVIDIA GeForce RTX 2070 Mobile
15.6 fps (2%)
GPU TDP ? TDP 80 W 86% 100%
specvp13 showcase-02 + NVIDIA GeForce RTX 2060 (Desktop) SPECviewperf 13 - specvp13 showcase-02
101.6 fps (22%)
specvp13 showcase-02 + NVIDIA GeForce RTX 2070 Super Max-Q
min: 94.1 avg: 95.6 median: 95.6 (21%) max: 97 fps
GPU TDP ? TDP 80 W 100% 99%
specvp13 showcase-02 + NVIDIA GeForce RTX 2070 Mobile
101.5 fps (22%)
GPU TDP ? TDP 80 W 100% 98%
specvp13 medical-02 + NVIDIA GeForce RTX 2060 (Desktop) SPECviewperf 13 - specvp13 medical-02
49.1 fps (10%)
specvp13 medical-02 + NVIDIA GeForce RTX 2070 Super Max-Q
min: 48.6 avg: 50.6 median: 50.6 (11%) max: 52.6 fps
GPU TDP ? TDP 80 W 100% 96%
specvp13 medical-02 + NVIDIA GeForce RTX 2070 Mobile
52.2 fps (11%)
GPU TDP ? TDP 80 W 100% 95%
specvp13 maya-05 + NVIDIA GeForce RTX 2060 (Desktop) SPECviewperf 13 - specvp13 maya-05
247 fps (28%)
specvp13 maya-05 + NVIDIA GeForce RTX 2070 Super Max-Q
min: 199.7 avg: 210.6 median: 210.6 (24%) max: 221.5 fps
GPU TDP ? TDP 80 W 100% 85%
specvp13 maya-05 + NVIDIA GeForce RTX 2070 Mobile
253.4 fps (29%)
GPU TDP ? TDP 80 W 100% 83%
specvp13 energy-02 + NVIDIA GeForce RTX 2060 (Desktop) SPECviewperf 13 - specvp13 energy-02
7.6 fps (2%)
specvp13 energy-02 + NVIDIA GeForce RTX 2070 Super Max-Q
min: 18.47 avg: 18.7 median: 18.7 (6%) max: 18.95 fps
GPU TDP ? TDP 80 W 69% 100%
specvp13 energy-02 + NVIDIA GeForce RTX 2070 Mobile
20.2 fps (7%)
GPU TDP ? TDP 80 W 81% 100%
specvp13 creo-02 + NVIDIA GeForce RTX 2060 (Desktop) SPECviewperf 13 - specvp13 creo-02
169.8 fps (25%)
specvp13 creo-02 + NVIDIA GeForce RTX 2070 Super Max-Q
min: 160.4 avg: 166.2 median: 166.2 (24%) max: 172 fps
GPU TDP ? TDP 80 W 100% 94%
specvp13 creo-02 + NVIDIA GeForce RTX 2070 Mobile
172.3 fps (25%)
GPU TDP ? TDP 80 W 100% 94%
specvp13 catia-05 + NVIDIA GeForce RTX 2060 (Desktop) SPECviewperf 13 - specvp13 catia-05
108.2 fps (12%)
specvp13 catia-05 + NVIDIA GeForce RTX 2070 Super Max-Q
min: 124.3 avg: 126.6 median: 126.6 (14%) max: 128.9 fps
GPU TDP ? TDP 80 W 95% 100%
specvp13 catia-05 + NVIDIA GeForce RTX 2070 Mobile
108.6 fps (12%)
GPU TDP ? TDP 80 W 93% 100%
specvp13 3dsmax-06 + NVIDIA GeForce RTX 2060 (Desktop) SPECviewperf 13 - specvp13 3dsmax-06
184.4 fps (32%)
specvp13 3dsmax-06 + NVIDIA GeForce RTX 2070 Super Max-Q
min: 171.5 avg: 176.4 median: 176.4 (31%) max: 181.2 fps
GPU TDP ? TDP 80 W 100% 94%
specvp13 3dsmax-06 + NVIDIA GeForce RTX 2070 Mobile
173.2 fps (30%)
GPU TDP ? TDP 80 W 100% 95%
SPECviewperf 2020 specvp2020 solidworks-05 1080p + NVIDIA GeForce RTX 2070 Super Max-Q SPECviewperf 2020 - specvp2020 solidworks-05 1080p
152.8 fps (30%)
specvp2020 snx-04 1080p + NVIDIA GeForce RTX 2070 Super Max-Q SPECviewperf 2020 - specvp2020 snx-04 1080p
19.5 fps (3%)
specvp2020 medical-03 1080p + NVIDIA GeForce RTX 2070 Super Max-Q SPECviewperf 2020 - specvp2020 medical-03 1080p
24 fps (25%)
specvp2020 maya-06 1080p + NVIDIA GeForce RTX 2070 Super Max-Q SPECviewperf 2020 - specvp2020 maya-06 1080p
221.6 fps (32%)
specvp2020 energy-03 1080p + NVIDIA GeForce RTX 2070 Super Max-Q SPECviewperf 2020 - specvp2020 energy-03 1080p
19.2 fps (15%)
specvp2020 creo-03 1080p + NVIDIA GeForce RTX 2070 Super Max-Q SPECviewperf 2020 - specvp2020 creo-03 1080p
76.8 fps (38%)
specvp2020 catia-06 1080p + NVIDIA GeForce RTX 2070 Super Max-Q SPECviewperf 2020 - specvp2020 catia-06 1080p
49 fps (32%)
specvp2020 3dsmax-07 1080p + NVIDIA GeForce RTX 2070 Super Max-Q SPECviewperf 2020 - specvp2020 3dsmax-07 1080p
86.4 fps (39%)
Cinebench R10 Cinebench R10 Shading (32bit) + NVIDIA GeForce RTX 2070 Super Max-Q Cinebench R10 - Cinebench R10 Shading (32bit)
6835 Points (5%)
Cinebench R10 Shading (32bit) + NVIDIA GeForce RTX 2070 Mobile
min: 3561 avg: 10562 median: 13457 (10%) max: 14667 Points
Cinebench R11.5 Cinebench R11.5 OpenGL 64 Bit + NVIDIA GeForce RTX 2070 Super Max-Q Cinebench R11.5 - Cinebench R11.5 OpenGL 64 Bit
88.5 fps (31%)
Cinebench R11.5 OpenGL 64 Bit + NVIDIA GeForce RTX 2070 Mobile
min: 78.7 avg: 82.3 median: 82.3 (28%) max: 85.8 fps
Cinebench R15 + NVIDIA GeForce RTX 2070 Super Max-Q Cinebench R15 - Cinebench R15 OpenGL 64 Bit
min: 129 avg: 139.5 median: 138 (8%) max: 157 fps
GPU TDP ? TDP 80 W TDP 115 W 96% 100% 92%
Cinebench R15 OpenGL 64 Bit + NVIDIA GeForce RTX 2070 Mobile
min: 91.9 avg: 131.1 median: 133 (8%) max: 186 fps
GPU TDP ? TDP 80 W TDP 115 W 92% 100% 92%
Cinebench R15 OpenGL Ref. Match 64 Bit + NVIDIA GeForce RTX 2070 Super Max-Q Cinebench R15 - Cinebench R15 OpenGL Ref. Match 64 Bit
99.6 % (100%)
GPU TDP ? TDP 80 W TDP 115 W 100% 100% 100%
Cinebench R15 OpenGL Ref. Match 64 Bit + NVIDIA GeForce RTX 2070 Mobile
min: 99.2 avg: 99.6 median: 99.6 (100%) max: 99.6 %
GPU TDP ? TDP 80 W TDP 115 W 100% 100% 100%
GFXBench - GFXBench Car Chase Offscreen
349 fps (39%)
329 fps (37%)
LuxMark v2.0 64Bit - LuxMark v2.0 Room GPU
2586 Samples/s (12%)
3171 Samples/s (14%)
LuxMark v2.0 64Bit - LuxMark v2.0 Sala GPU
5655 Samples/s (10%)
6570 Samples/s (12%)
ComputeMark v2.1 - ComputeMark v2.1 Result
14375 Points (16%)
14015 Points (15%)
14446 Points (16%)
Power Consumption - Furmark Stress Test Power Consumption - external Monitor *
295.2 Watt (42%)
Power Consumption - The Witcher 3 Power Consumption - external Monitor *
288.8 Watt (40%)
153 Watt (21%)
Power Consumption - Witcher 3 Power Consumption *
min: 144 avg: 156 median: 155 (34%) max: 176 Watt
GPU TDP ? TDP 80 W TDP 115 W 108% 111% 100%
min: 172 avg: 190.2 median: 186.9 (41%) max: 238 Watt
GPU TDP ? TDP 80 W TDP 115 W 100% 113% 102%
Power Consumption - Witcher 3 ultra Power Efficiency
min: 0.4324 avg: 0.5 median: 0.5 (48%) max: 0.531 fps per Watt
GPU TDP ? TDP 80 W TDP 115 W 91% 82% 100%
min: 0.313 avg: 0.4 median: 0.4 (39%) max: 0.4438 fps per Watt
GPU TDP ? TDP 80 W TDP 115 W 79% 82% 100%
Power Consumption - Witcher 3 ultra Power Efficiency - external Monitor
0.3 fps per Watt (21%)
0.5 fps per Watt (43%)
Emissions Witcher 3 Fan Noise + NVIDIA GeForce RTX 2070 Super Max-Q Emissions - Witcher 3 Fan Noise
min: 46 avg: 48.9 median: 48 (77%) max: 53 dB(A)
GPU TDP ? TDP 80 W TDP 115 W 92% 87% 100%
Witcher 3 Fan Noise + NVIDIA GeForce RTX 2070 Mobile
min: 49 avg: 53.5 median: 53.5 (86%) max: 62 dB(A)
GPU TDP ? TDP 80 W TDP 115 W 98% 87% 100%
Clock Speed - GPU Clock Witcher 3 ultra
min: 1320 avg: 1363 median: 1350 (53%) max: 1440 MHz
GPU TDP ? TDP 115 W 99% 100%
min: 1395 avg: 1487 median: 1470 (58%) max: 1650 MHz
GPU TDP ? TDP 115 W 100% 96%
Clock Speed - GPU Clock Speed Furmark
1125 MHz (45%)
Average Benchmarks NVIDIA GeForce RTX 2060 (Desktop) → 100% n=23 Average Benchmarks NVIDIA GeForce RTX 2070 Super Max-Q → 108% n=23 Average Benchmarks NVIDIA GeForce RTX 2070 Mobile → 109% n=23
- Bereich der Benchmarkergebnisse für diese Grafikkarte
- Durchschnittliche Benchmarkergebnisse für diese Grafikkarte
* Smaller numbers mean a higher performance
1 This benchmark is not used for the average calculation
Spiele-Benchmarks Die folgenden Benchmarks basieren auf unseren Spieletests mit Testnotebooks. Die Performance dieser Grafikkarte bei den gelisteten Spielen ist abhängig von der verwendeten CPU, Speicherausstattung, Treiber und auch Betriebssystem. Dadurch müssen die untenstehenden Werte nicht repräsentativ sein. Detaillierte Informationen über das verwendete System sehen Sie nach einem Klick auf den fps-Wert.
GeForce RTX 2070 Mobile:
150 [X] MSI GP65 Leopard 9SF Intel Core i7-9750H 2.6GHz
GeForce RTX 2070 Mobile
min:
113 fps
fps
GeForce RTX 2070 Mobile:
139 [X] MSI GP65 Leopard 9SF Intel Core i7-9750H 2.6GHz
GeForce RTX 2070 Mobile
min:
121 fps
fps
GeForce RTX 2070 Mobile:
82 [X] MSI GP65 Leopard 9SF Intel Core i7-9750H 2.6GHz
GeForce RTX 2070 Mobile
min:
67 fps
fps
GeForce RTX 2070 Mobile:
63 [X] MSI GP65 Leopard 9SF Intel Core i7-9750H 2.6GHz
GeForce RTX 2070 Mobile
min:
55 fps
fps
GeForce RTX 2070 Mobile:
34 [X] MSI GP65 Leopard 9SF Intel Core i7-9750H 2.6GHz
GeForce RTX 2070 Mobile
min:
30 fps
fps
GeForce RTX 2070 Mobile:
115 [X] MSI GP65 Leopard 9SF Intel Core i7-9750H 2.6GHz
GeForce RTX 2070 Mobile
min:
23.4 fps, P0.1:
27.6 fps, P1:
57.3 fps, max:
239 fps
fps
GeForce RTX 2070 Mobile:
101 [X] MSI GP65 Leopard 9SF Intel Core i7-9750H 2.6GHz
GeForce RTX 2070 Mobile
min:
23.8 fps, P0.1:
28.2 fps, P1:
50.7 fps, max:
207 fps
fps
GeForce RTX 2070 Mobile:
74.9 [X] MSI GP65 Leopard 9SF Intel Core i7-9750H 2.6GHz
GeForce RTX 2070 Mobile
min:
19.8 fps, P0.1:
25.8 fps, P1:
38.2 fps, max:
155 fps
fps
GeForce RTX 2070 Mobile:
55.4 [X] MSI GP65 Leopard 9SF Intel Core i7-9750H 2.6GHz
GeForce RTX 2070 Mobile
min:
22.9 fps, P0.1:
25.5 fps, P1:
34 fps, max:
145 fps
fps
GeForce RTX 2070 Mobile:
31.9 [X] MSI GP65 Leopard 9SF Intel Core i7-9750H 2.6GHz
GeForce RTX 2070 Mobile
min:
20.6 fps, P0.1:
21.3 fps, P1:
23.3 fps, max:
82.2 fps
fps
GeForce RTX 2070 Mobile:
116 [X] MSI GP65 Leopard 9SF Intel Core i7-9750H 2.6GHz
GeForce RTX 2070 Mobile
min:
25.5 fps, P0.1:
49 fps, P1:
64.1 fps, max:
325 fps
fps
GeForce RTX 2070 Mobile:
112 [X] MSI GP65 Leopard 9SF Intel Core i7-9750H 2.6GHz
GeForce RTX 2070 Mobile
min:
25.3 fps, P0.1:
37.7 fps, P1:
60.6 fps, max:
311 fps
fps
GeForce RTX 2070 Mobile:
106 [X] MSI GP65 Leopard 9SF Intel Core i7-9750H 2.6GHz
GeForce RTX 2070 Mobile
min:
18.7 fps, P0.1:
35.4 fps, P1:
60.3 fps, max:
299 fps
fps
GeForce RTX 2070 Mobile:
74 [X] MSI GP65 Leopard 9SF Intel Core i7-9750H 2.6GHz
GeForce RTX 2070 Mobile
min:
16.1 fps, P0.1:
28.2 fps, P1:
53.9 fps, max:
214 fps
fps
GeForce RTX 2070 Mobile:
126 [X] MSI GP65 Leopard 9SF Intel Core i7-9750H 2.6GHz
GeForce RTX 2070 Mobile
min:
77.9 fps, P0.1:
84.8 fps, P1:
94.1 fps, max:
186 fps
fps
GeForce RTX 2070 Mobile:
126 [X] MSI GP65 Leopard 9SF Intel Core i7-9750H 2.6GHz
GeForce RTX 2070 Mobile
min:
9.39 fps, P0.1:
92.9 fps, P1:
104 fps, max:
180 fps
fps
GeForce RTX 2070 Mobile:
110 [X] MSI GP65 Leopard 9SF Intel Core i7-9750H 2.6GHz
GeForce RTX 2070 Mobile
min:
83.3 fps, P0.1:
86.9 fps, P1:
90.9 fps, max:
157 fps
fps
GeForce RTX 2070 Mobile:
106 [X] MSI GP65 Leopard 9SF Intel Core i7-9750H 2.6GHz
GeForce RTX 2070 Mobile
min:
20.2 fps, P0.1:
20.4 fps, P1:
28.8 fps, max:
235 fps
fps
GeForce RTX 2070 Mobile:
94.3 [X] MSI GP65 Leopard 9SF Intel Core i7-9750H 2.6GHz
GeForce RTX 2070 Mobile
min:
14.6 fps, P0.1:
18.4 fps, P1:
23.6 fps, max:
202 fps
fps
GeForce RTX 2070 Mobile:
81.7 [X] MSI GP65 Leopard 9SF Intel Core i7-9750H 2.6GHz
GeForce RTX 2070 Mobile
min:
12.2 fps, P0.1:
18.3 fps, P1:
23.5 fps, max:
172 fps
fps
GeForce RTX 2070 Mobile:
60.5 [X] MSI GP65 Leopard 9SF Intel Core i7-9750H 2.6GHz
GeForce RTX 2070 Mobile
min:
11 fps, P0.1:
14.9 fps, P1:
25 fps, max:
159 fps
fps
GeForce RTX 2070 Mobile:
32.8 [X] MSI GP65 Leopard 9SF Intel Core i7-9750H 2.6GHz
GeForce RTX 2070 Mobile
min:
4.11 fps, P0.1:
6.57 fps, P1:
17.3 fps, max:
102 fps
fps
GeForce RTX 2070 Mobile:
136 [X] MSI GP65 Leopard 9SF Intel Core i7-9750H 2.6GHz
GeForce RTX 2070 Mobile
min:
59 fps
fps
GeForce RTX 2070 Mobile:
124 [X] MSI GP65 Leopard 9SF Intel Core i7-9750H 2.6GHz
GeForce RTX 2070 Mobile
min:
55 fps
fps
GeForce RTX 2070 Mobile:
113 [X] MSI GP65 Leopard 9SF Intel Core i7-9750H 2.6GHz
GeForce RTX 2070 Mobile
min:
45 fps
fps
GeForce RTX 2070 Mobile:
77.1 [X] MSI GP65 Leopard 9SF Intel Core i7-9750H 2.6GHz
GeForce RTX 2070 Mobile
min:
26 fps
fps
GeForce RTX 2070 Mobile:
41.4 [X] MSI GP65 Leopard 9SF Intel Core i7-9750H 2.6GHz
GeForce RTX 2070 Mobile
min:
20 fps
fps
GeForce RTX 2070 Super Max-Q:
117.8 fps
GeForce RTX 2070 Super Max-Q:
67.7 fps
GeForce RTX 2070 Mobile:
75.8 [X] MSI GP65 Leopard 9SF Intel Core i7-9750H 2.6GHz
GeForce RTX 2070 Mobile
min:
12.6 fps, P0.1:
47.8 fps, P1:
58.3 fps, max:
98.9 fps
fps
GeForce RTX 2070 Super Max-Q:
56.7 fps
GeForce RTX 2070 Mobile:
61.9 [X] MSI GP65 Leopard 9SF Intel Core i7-9750H 2.6GHz
GeForce RTX 2070 Mobile
min:
15.4 fps, P0.1:
45.9 fps, P1:
52.7 fps, max:
110 fps
fps
GeForce RTX 2070 Super Max-Q:
48.5 fps
GeForce RTX 2070 Mobile:
52.9 [X] MSI GP65 Leopard 9SF Intel Core i7-9750H 2.6GHz
GeForce RTX 2070 Mobile
min:
14.1 fps, P0.1:
41 fps, P1:
44.1 fps, max:
76.4 fps
fps
GeForce RTX 2070 Mobile:
34.5 [X] MSI GP65 Leopard 9SF Intel Core i7-9750H 2.6GHz
GeForce RTX 2070 Mobile
min:
15.4 fps, P0.1:
23.4 fps, P1:
30 fps, max:
68.4 fps
fps
GeForce RTX 2070 Mobile:
16.3 [X] MSI GP65 Leopard 9SF Intel Core i7-9750H 2.6GHz
GeForce RTX 2070 Mobile
min:
12 fps, P0.1:
13 fps, P1:
14.7 fps, max:
27.3 fps
fps
GeForce RTX 2070 Mobile:
82 [X] MSI GP65 Leopard 9SF Intel Core i7-9750H 2.6GHz
GeForce RTX 2070 Mobile
min:
39 fps
fps
GeForce RTX 2070 Mobile:
72 [X] MSI GP65 Leopard 9SF Intel Core i7-9750H 2.6GHz
GeForce RTX 2070 Mobile
min:
31 fps
fps
GeForce RTX 2070 Mobile:
67 [X] MSI GP65 Leopard 9SF Intel Core i7-9750H 2.6GHz
GeForce RTX 2070 Mobile
min:
28 fps
fps
GeForce RTX 2070 Mobile:
55 [X] MSI GP65 Leopard 9SF Intel Core i7-9750H 2.6GHz
GeForce RTX 2070 Mobile
min:
24 fps
fps
GeForce RTX 2070 Mobile:
36 [X] MSI GP65 Leopard 9SF Intel Core i7-9750H 2.6GHz
GeForce RTX 2070 Mobile
min:
22 fps
fps
GeForce RTX 2070 Super Max-Q:
135.7 fps
100%
GeForce RTX 2060 (Desktop):
98.1 [X] MSI GeForce RTX 2060 Intel Core i9-9900K 3.6GHz
GeForce RTX 2060 (Desktop)
min:
49.4 fps, P0.1:
54.4 fps, P1:
64.7 fps, max:
162 fps
fps
105%
GeForce RTX 2070 Super Max-Q:
102.6 fps
102%
GeForce RTX 2070 Mobile:
100 [X] MSI GP65 Leopard 9SF Intel Core i7-9750H 2.6GHz
GeForce RTX 2070 Mobile
min:
45.1 fps, P0.1:
57.5 fps, P1:
65.3 fps, max:
145 fps
fps
100%
GeForce RTX 2060 (Desktop):
95.5 [X] MSI GeForce RTX 2060 Intel Core i9-9900K 3.6GHz
GeForce RTX 2060 (Desktop)
min:
16.7 fps, P0.1:
55.2 fps, P1:
61.8 fps, max:
167 fps
fps
106%
GeForce RTX 2070 Super Max-Q:
101.6 fps
100%
GeForce RTX 2070 Mobile:
95.6 [X] MSI GP65 Leopard 9SF Intel Core i7-9750H 2.6GHz
GeForce RTX 2070 Mobile
min:
25.5 fps, P0.1:
51.3 fps, P1:
63.4 fps, max:
145 fps
fps
100%
GeForce RTX 2060 (Desktop):
80.5 [X] MSI GeForce RTX 2060 Intel Core i9-9900K 3.6GHz
GeForce RTX 2060 (Desktop)
min:
42.4 fps, P0.1:
47.5 fps, P1:
50.8 fps, max:
148 fps
fps
107%
GeForce RTX 2070 Super Max-Q:
86.1 fps
100%
GeForce RTX 2070 Mobile:
80.3 [X] MSI GP65 Leopard 9SF Intel Core i7-9750H 2.6GHz
GeForce RTX 2070 Mobile
min:
38.6 fps, P0.1:
42.1 fps, P1:
47.6 fps, max:
127 fps
fps
100%
GeForce RTX 2060 (Desktop):
54.2 [X] MSI GeForce RTX 2060 Intel Core i9-9900K 3.6GHz
GeForce RTX 2060 (Desktop)
min:
28.4 fps, P0.1:
34.5 fps, P1:
36.8 fps, max:
105 fps
fps
102%
GeForce RTX 2070 Mobile:
55.5 [X] MSI GP65 Leopard 9SF Intel Core i7-9750H 2.6GHz
GeForce RTX 2070 Mobile
min:
25 fps, P0.1:
25.9 fps, P1:
32.1 fps, max:
127 fps
fps
100%
GeForce RTX 2060 (Desktop):
27.8 [X] MSI GeForce RTX 2060 Intel Core i9-9900K 3.6GHz
GeForce RTX 2060 (Desktop)
min:
15.3 fps, P0.1:
15.5 fps, P1:
16.3 fps, max:
79.5 fps
fps
103%
GeForce RTX 2070 Mobile:
28.6 [X] MSI GP65 Leopard 9SF Intel Core i7-9750H 2.6GHz
GeForce RTX 2070 Mobile
min:
17.2 fps, P0.1:
17.3 fps, P1:
18.8 fps, max:
73.1 fps
fps
GeForce RTX 2070 Super Max-Q:
163.7 fps
100%
GeForce RTX 2060 (Desktop):
95.4 [X] MSI GeForce RTX 2060 Intel Core i9-9900K 3.6GHz
GeForce RTX 2060 (Desktop)
min:
53.1 fps, P0.1:
66 fps, P1:
75.6 fps, max:
321 fps
fps
98%
GeForce RTX 2070 Super Max-Q:
93.6 fps
99%
GeForce RTX 2070 Mobile:
94.9 [X] MSI GP65 Leopard 9SF Intel Core i7-9750H 2.6GHz
GeForce RTX 2070 Mobile
min:
43.6 fps, P0.1:
58.5 fps, P1:
70.9 fps, max:
252 fps
fps
100%
GeForce RTX 2060 (Desktop):
80.7 [X] MSI GeForce RTX 2060 Intel Core i9-9900K 3.6GHz
GeForce RTX 2060 (Desktop)
min:
41.9 fps, P0.1:
60.2 fps, P1:
64.2 fps, max:
278 fps
fps
107%
GeForce RTX 2070 Super Max-Q:
86.2 fps
100%
GeForce RTX 2070 Mobile:
80.7 [X] MSI GP65 Leopard 9SF Intel Core i7-9750H 2.6GHz
GeForce RTX 2070 Mobile
min:
33.1 fps, P0.1:
49.6 fps, P1:
59.2 fps, max:
234 fps
fps
100%
GeForce RTX 2060 (Desktop):
67.1 [X] MSI GeForce RTX 2060 Intel Core i9-9900K 3.6GHz
GeForce RTX 2060 (Desktop)
min:
28 fps, P0.1:
46.2 fps, P1:
51.4 fps, max:
229 fps
fps
115%
GeForce RTX 2070 Super Max-Q:
77.4 fps
108%
GeForce RTX 2070 Mobile:
72.5 [X] MSI GP65 Leopard 9SF Intel Core i7-9750H 2.6GHz
GeForce RTX 2070 Mobile
min:
32.2 fps, P0.1:
47.2 fps, P1:
54.9 fps, max:
159 fps
fps
100%
GeForce RTX 2060 (Desktop):
46.9 [X] MSI GeForce RTX 2060 Intel Core i9-9900K 3.6GHz
GeForce RTX 2060 (Desktop)
min:
26.3 fps, P0.1:
35 fps, P1:
38.3 fps, max:
112 fps
fps
110%
GeForce RTX 2070 Mobile:
51.7 [X] MSI GP65 Leopard 9SF Intel Core i7-9750H 2.6GHz
GeForce RTX 2070 Mobile
min:
13.4 fps, P0.1:
32.7 fps, P1:
40.3 fps, max:
182 fps
fps
100%
GeForce RTX 2060 (Desktop):
21.5 [X] MSI GeForce RTX 2060 Intel Core i9-9900K 3.6GHz
GeForce RTX 2060 (Desktop)
min:
15.7 fps, P0.1:
16.2 fps, P1:
16.9 fps, max:
28.9 fps
fps
129%
GeForce RTX 2070 Mobile:
27.7 [X] MSI GP65 Leopard 9SF Intel Core i7-9750H 2.6GHz
GeForce RTX 2070 Mobile
min:
18.6 fps, P0.1:
19.6 fps, P1:
20.8 fps, max:
42.1 fps
fps
GeForce RTX 2070 Super Max-Q:
118 fps
100%
GeForce RTX 2060 (Desktop):
79 [X] MSI GeForce RTX 2060 Intel Core i9-9900K 3.6GHz
GeForce RTX 2060 (Desktop)
P0.1:
44 fpsP1:
fps
fps
103%
GeForce RTX 2070 Super Max-Q:
81 fps
103%
GeForce RTX 2070 Mobile:
81 [X] MSI GP65 Leopard 9SF Intel Core i7-9750H 2.6GHz
GeForce RTX 2070 Mobile
P0.1:
28 fpsP1:
fps
fps
100%
GeForce RTX 2060 (Desktop):
64 [X] MSI GeForce RTX 2060 Intel Core i9-9900K 3.6GHz
GeForce RTX 2060 (Desktop)
P0.1:
9 fpsP1:
fps
fps
109%
GeForce RTX 2070 Super Max-Q:
70 fps
108%
GeForce RTX 2070 Mobile:
69 [X] MSI GP65 Leopard 9SF Intel Core i7-9750H 2.6GHz
GeForce RTX 2070 Mobile
P0.1:
7 fpsP1:
fps
fps
100%
GeForce RTX 2060 (Desktop):
55 [X] MSI GeForce RTX 2060 Intel Core i9-9900K 3.6GHz
GeForce RTX 2060 (Desktop)
P0.1:
38 fpsP1:
fps
fps
109%
GeForce RTX 2070 Super Max-Q:
60 fps
107%
GeForce RTX 2070 Mobile:
59 [X] MSI GP65 Leopard 9SF Intel Core i7-9750H 2.6GHz
GeForce RTX 2070 Mobile
P0.1:
14 fpsP1:
fps
fps
100%
GeForce RTX 2060 (Desktop):
42 [X] MSI GeForce RTX 2060 Intel Core i9-9900K 3.6GHz
GeForce RTX 2060 (Desktop)
P0.1:
26 fpsP1:
fps
fps
112%
GeForce RTX 2070 Mobile:
47 [X] MSI GP65 Leopard 9SF Intel Core i7-9750H 2.6GHz
GeForce RTX 2070 Mobile
P0.1:
32 fpsP1:
fps
fps
100%
GeForce RTX 2060 (Desktop):
24 [X] MSI GeForce RTX 2060 Intel Core i9-9900K 3.6GHz
GeForce RTX 2060 (Desktop)
P0.1:
17 fpsP1:
fps
fps
117%
GeForce RTX 2070 Mobile:
28 [X] MSI GP65 Leopard 9SF Intel Core i7-9750H 2.6GHz
GeForce RTX 2070 Mobile
P0.1:
21 fpsP1:
fps
fps
GeForce RTX 2070 Super Max-Q:
160 fps
100%
GeForce RTX 2060 (Desktop):
86 [X] MSI GeForce RTX 2060 Intel Core i9-9900K 3.6GHz
GeForce RTX 2060 (Desktop)
min:
20.7 fps, P0.1:
63.1 fps, P1:
73.7 fps, max:
147.6 fps
fps
111%
GeForce RTX 2070 Super Max-Q:
95.6 fps
103%
GeForce RTX 2070 Mobile:
88.2 [X] MSI GP65 Leopard 9SF Intel Core i7-9750H 2.6GHz
GeForce RTX 2070 Mobile
min:
42.6 fps, P0.1:
65.2 fps, P1:
76.4 fps, max:
145.2 fps
fps
100%
GeForce RTX 2060 (Desktop):
68.9 [X] MSI GeForce RTX 2060 Intel Core i9-9900K 3.6GHz
GeForce RTX 2060 (Desktop)
min:
20.1 fps, P0.1:
50.2 fps, P1:
60.4 fps, max:
122.5 fps
fps
113%
GeForce RTX 2070 Super Max-Q:
78.2 fps
101%
GeForce RTX 2070 Mobile:
69.4 [X] MSI GP65 Leopard 9SF Intel Core i7-9750H 2.6GHz
GeForce RTX 2070 Mobile
min:
25 fps, P0.1:
56.7 fps, P1:
60.4 fps, max:
93.9 fps
fps
100%
GeForce RTX 2060 (Desktop):
40.6 [X] MSI GeForce RTX 2060 Intel Core i9-9900K 3.6GHz
GeForce RTX 2060 (Desktop)
min:
19.8 fps, P0.1:
31 fps, P1:
33.7 fps, max:
50.9 fps
fps
160%
GeForce RTX 2070 Super Max-Q:
65.1 fps
102%
GeForce RTX 2070 Mobile:
41.3 [X] MSI GP65 Leopard 9SF Intel Core i7-9750H 2.6GHz
GeForce RTX 2070 Mobile
min:
31.7 fps, P0.1:
32.1 fps, P1:
33.1 fps, max:
55.8 fps
fps
100%
GeForce RTX 2060 (Desktop):
35.2 [X] MSI GeForce RTX 2060 Intel Core i9-9900K 3.6GHz
GeForce RTX 2060 (Desktop)
min:
19.4 fps, P0.1:
27.4 fps, P1:
29.7 fps, max:
42.9 fps
fps
100%
GeForce RTX 2070 Mobile:
35.3 [X] MSI GP65 Leopard 9SF Intel Core i7-9750H 2.6GHz
GeForce RTX 2070 Mobile
min:
27.2 fps, P0.1:
28.3 fps, P1:
29.9 fps, max:
44.3 fps
fps
100%
GeForce RTX 2060 (Desktop):
26.4 [X] MSI GeForce RTX 2060 Intel Core i9-9900K 3.6GHz
GeForce RTX 2060 (Desktop)
min:
18.8 fps, P0.1:
19.8 fps, P1:
22.7 fps, max:
30.6 fps
fps
100%
GeForce RTX 2070 Mobile:
26.3 [X] MSI GP65 Leopard 9SF Intel Core i7-9750H 2.6GHz
GeForce RTX 2070 Mobile
min:
19.3 fps, P0.1:
20.6 fps, P1:
22.8 fps, max:
30.6 fps
fps
GeForce RTX 2070 Super Max-Q:
100 fps
100%
GeForce RTX 2060 (Desktop):
101 [X] MSI GeForce RTX 2060 Intel Core i9-9900K 3.6GHz
GeForce RTX 2060 (Desktop)
min:
24.46 fps, P1:
76.42 fps, max:
146.37 fps
fps
95%
GeForce RTX 2070 Super Max-Q:
96 fps
92%
GeForce RTX 2070 Mobile:
93.1 [X] MSI GP65 Leopard 9SF Intel Core i7-9750H 2.6GHz
GeForce RTX 2070 Mobile
min:
43.4 fps, P1:
66.69 fps, max:
135.67 fps
fps
100%
GeForce RTX 2060 (Desktop):
87.4 [X] MSI GeForce RTX 2060 Intel Core i9-9900K 3.6GHz
GeForce RTX 2060 (Desktop)
min:
31.57 fps, P1:
65.79 fps, max:
133.96 fps
fps
96%
GeForce RTX 2070 Super Max-Q:
84 fps
93%
GeForce RTX 2070 Mobile:
81.6 [X] MSI GP65 Leopard 9SF Intel Core i7-9750H 2.6GHz
GeForce RTX 2070 Mobile
min:
30.3 fps, P1:
57.94 fps, max:
114.03 fps
fps
100%
GeForce RTX 2060 (Desktop):
45.3 [X] MSI GeForce RTX 2060 Intel Core i9-9900K 3.6GHz
GeForce RTX 2060 (Desktop)
min:
14.9 fps, P1:
18.44 fps, max:
121.44 fps
fps
130%
GeForce RTX 2070 Super Max-Q:
59 fps
124%
GeForce RTX 2070 Mobile:
56.1 [X] MSI GP65 Leopard 9SF Intel Core i7-9750H 2.6GHz
GeForce RTX 2070 Mobile
min:
34.32 fps, P1:
44.63 fps, max:
95.56 fps
fps
100%
GeForce RTX 2060 (Desktop):
30.3 [X] MSI GeForce RTX 2060 Intel Core i9-9900K 3.6GHz
GeForce RTX 2060 (Desktop)
min:
12.85 fps, P1:
14.85 fps, max:
97.52 fps
fps
137%
GeForce RTX 2070 Mobile:
41.6 [X] MSI GP65 Leopard 9SF Intel Core i7-9750H 2.6GHz
GeForce RTX 2070 Mobile
min:
26.18 fps, P1:
34.32 fps, max:
63.27 fps
fps
100%
GeForce RTX 2060 (Desktop):
17.4 [X] MSI GeForce RTX 2060 Intel Core i9-9900K 3.6GHz
GeForce RTX 2060 (Desktop)
min:
9.45 fps, P1:
10.44 fps, max:
60.75 fps
fps
134%
GeForce RTX 2070 Mobile:
23.4 [X] MSI GP65 Leopard 9SF Intel Core i7-9750H 2.6GHz
GeForce RTX 2070 Mobile
min:
11.68 fps, P1:
17.65 fps, max:
71.07 fps
fps
100%
GeForce RTX 2060 (Desktop):
260 [X] MSI GeForce RTX 2060 1.5.4.5
Intel Core i9-9900K 3.6GHz
GeForce RTX 2060 (Desktop)
min:
10.2 fps, P1:
182 fps, max:
363 fps
fps
87%
GeForce RTX 2070 Mobile:
225 [X] MSI GP65 Leopard 9SF Intel Core i7-9750H 2.6GHz
GeForce RTX 2070 Mobile
min:
4.71 fps, P1:
167 fps, max:
300 fps
fps
100%
GeForce RTX 2060 (Desktop):
254 [X] MSI GeForce RTX 2060 1.5.4.5
Intel Core i9-9900K 3.6GHz
GeForce RTX 2060 (Desktop)
min:
14.2 fps, P1:
178 fps, max:
354 fps
fps
88%
GeForce RTX 2070 Mobile:
223 [X] MSI GP65 Leopard 9SF Intel Core i7-9750H 2.6GHz
GeForce RTX 2070 Mobile
min:
10.8 fps, P1:
164 fps, max:
308 fps
fps
100%
GeForce RTX 2060 (Desktop):
244 [X] MSI GeForce RTX 2060 1.5.4.5
Intel Core i9-9900K 3.6GHz
GeForce RTX 2060 (Desktop)
min:
51.6 fps, P1:
171 fps, max:
335 fps
fps
86%
GeForce RTX 2070 Mobile:
211 [X] MSI GP65 Leopard 9SF Intel Core i7-9750H 2.6GHz
GeForce RTX 2070 Mobile
min:
12.9 fps, P1:
155 fps, max:
287 fps
fps
100%
GeForce RTX 2060 (Desktop):
240 [X] MSI GeForce RTX 2060 1.5.4.5
Intel Core i9-9900K 3.6GHz
GeForce RTX 2060 (Desktop)
min:
18 fps, P1:
171 fps, max:
329 fps
fps
88%
GeForce RTX 2070 Mobile:
210 [X] MSI GP65 Leopard 9SF Intel Core i7-9750H 2.6GHz
GeForce RTX 2070 Mobile
min:
14.2 fps, P1:
158 fps, max:
282 fps
fps
100%
GeForce RTX 2060 (Desktop):
236 [X] MSI GeForce RTX 2060 1.5.4.5
Intel Core i9-9900K 3.6GHz
GeForce RTX 2060 (Desktop)
min:
98.6 fps, P1:
165 fps, max:
314 fps
fps
87%
GeForce RTX 2070 Mobile:
206 [X] MSI GP65 Leopard 9SF Intel Core i7-9750H 2.6GHz
GeForce RTX 2070 Mobile
min:
13.4 fps, P1:
156 fps, max:
280 fps
fps
100%
GeForce RTX 2060 (Desktop):
171 [X] MSI GeForce RTX 2060 1.5.4.5
Intel Core i9-9900K 3.6GHz
GeForce RTX 2060 (Desktop)
min:
78.7 fps, P1:
124 fps, max:
267 fps
fps
101%
GeForce RTX 2070 Mobile:
173 [X] MSI GP65 Leopard 9SF Intel Core i7-9750H 2.6GHz
GeForce RTX 2070 Mobile
min:
14.3 fps, P1:
129 fps, max:
240 fps
fps
100%
GeForce RTX 2060 (Desktop):
373 [X] MSI GeForce RTX 2060 1.5.4.5
Intel Core i9-9900K 3.6GHz
GeForce RTX 2060 (Desktop)
min:
131 fps, P1:
244 fps, max:
564 fps
fps
71%
GeForce RTX 2070 Mobile:
265 [X] MSI GP65 Leopard 9SF 1.5.4.5
Intel Core i7-9750H 2.6GHz
GeForce RTX 2070 Mobile
min:
123 fps, P1:
180 fps, max:
389 fps
fps
100%
GeForce RTX 2060 (Desktop):
269 [X] MSI GeForce RTX 2060 1.5.4.5
Intel Core i9-9900K 3.6GHz
GeForce RTX 2060 (Desktop)
min:
140 fps, P1:
211 fps, max:
399 fps
fps
87%
GeForce RTX 2070 Mobile:
234 [X] MSI GP65 Leopard 9SF 1.5.4.5
Intel Core i7-9750H 2.6GHz
GeForce RTX 2070 Mobile
min:
104 fps, P1:
179 fps, max:
368 fps
fps
100%
GeForce RTX 2060 (Desktop):
227 [X] MSI GeForce RTX 2060 1.5.4.5
Intel Core i9-9900K 3.6GHz
GeForce RTX 2060 (Desktop)
min:
152 fps, P1:
179 fps, max:
329 fps
fps
100%
GeForce RTX 2070 Mobile:
228 [X] MSI GP65 Leopard 9SF 1.5.4.5
Intel Core i7-9750H 2.6GHz
GeForce RTX 2070 Mobile
min:
46.6 fps, P1:
147 fps, max:
336 fps
fps
100%
GeForce RTX 2060 (Desktop):
214 [X] MSI GeForce RTX 2060 1.5.4.5
Intel Core i9-9900K 3.6GHz
GeForce RTX 2060 (Desktop)
min:
145 fps, P1:
170 fps, max:
292 fps
fps
100%
GeForce RTX 2070 Mobile:
214 [X] MSI GP65 Leopard 9SF 1.5.4.5
Intel Core i7-9750H 2.6GHz
GeForce RTX 2070 Mobile
min:
142 fps, P1:
163 fps, max:
308 fps
fps
100%
GeForce RTX 2060 (Desktop):
137 [X] MSI GeForce RTX 2060 1.5.4.5
Intel Core i9-9900K 3.6GHz
GeForce RTX 2060 (Desktop)
min:
88.9 fps, P1:
104 fps, max:
214 fps
fps
102%
GeForce RTX 2070 Mobile:
140 [X] MSI GP65 Leopard 9SF 1.5.4.5
Intel Core i7-9750H 2.6GHz
GeForce RTX 2070 Mobile
min:
99.2 fps, P1:
116 fps, max:
191 fps
fps
100%
GeForce RTX 2060 (Desktop):
78.2 [X] MSI GeForce RTX 2060 1.5.4.5
Intel Core i9-9900K 3.6GHz
GeForce RTX 2060 (Desktop)
min:
55 fps, P1:
65.8 fps, max:
114 fps
fps
100%
GeForce RTX 2070 Mobile:
78 [X] MSI GP65 Leopard 9SF 1.5.4.5
Intel Core i7-9750H 2.6GHz
GeForce RTX 2070 Mobile
min:
61.6 fps, P1:
67.1 fps, max:
100 fps
fps
100%
GeForce RTX 2060 (Desktop):
147 [X] MSI GeForce RTX 2060 1.5.4.5
Intel Core i9-9900K 3.6GHz
GeForce RTX 2060 (Desktop)
min:
71 fps, P1:
104 fps, max:
233 fps
fps
90%
GeForce RTX 2070 Mobile:
133 [X] MSI GP65 Leopard 9SF 1.5.4.5
Intel Core i7-9750H 2.6GHz
GeForce RTX 2070 Mobile
min:
51.9 fps, P1:
91.4 fps, max:
200 fps
fps
100%
GeForce RTX 2060 (Desktop):
97.9 [X] MSI GeForce RTX 2060 1.5.4.5
Intel Core i9-9900K 3.6GHz
GeForce RTX 2060 (Desktop)
min:
54.2 fps, P1:
70.7 fps, max:
203 fps
fps
100%
GeForce RTX 2070 Mobile:
98.1 [X] MSI GP65 Leopard 9SF 1.5.4.5
Intel Core i7-9750H 2.6GHz
GeForce RTX 2070 Mobile
min:
49.2 fps, P1:
72.3 fps, max:
170 fps
fps
100%
GeForce RTX 2060 (Desktop):
91.1 [X] MSI GeForce RTX 2060 1.5.4.5
Intel Core i9-9900K 3.6GHz
GeForce RTX 2060 (Desktop)
min:
58.6 fps, P1:
67.1 fps, max:
170 fps
fps
98%
GeForce RTX 2070 Mobile:
89.6 [X] MSI GP65 Leopard 9SF 1.5.4.5
Intel Core i7-9750H 2.6GHz
GeForce RTX 2070 Mobile
min:
53.5 fps, P1:
64.7 fps, max:
153 fps
fps
100%
GeForce RTX 2060 (Desktop):
61.1 [X] MSI GeForce RTX 2060 1.5.4.5
Intel Core i9-9900K 3.6GHz
GeForce RTX 2060 (Desktop)
min:
47 fps, P1:
50.6 fps, max:
104 fps
fps
99%
GeForce RTX 2070 Mobile:
60.5 [X] MSI GP65 Leopard 9SF 1.5.4.5
Intel Core i7-9750H 2.6GHz
GeForce RTX 2070 Mobile
min:
28 fps, P1:
42.4 fps, max:
124 fps
fps
100%
GeForce RTX 2060 (Desktop):
31.7 [X] MSI GeForce RTX 2060 1.5.4.5
Intel Core i9-9900K 3.6GHz
GeForce RTX 2060 (Desktop)
min:
27.6 fps, P1:
28.6 fps, max:
39.4 fps
fps
97%
GeForce RTX 2070 Mobile:
30.6 [X] MSI GP65 Leopard 9SF 1.5.4.5
Intel Core i7-9750H 2.6GHz
GeForce RTX 2070 Mobile
min:
1.389 fps, P1:
26.7 fps, max:
125 fps
fps
100%
GeForce RTX 2060 (Desktop):
180 [X] MSI GeForce RTX 2060 Intel Core i9-9900K 3.6GHz
GeForce RTX 2060 (Desktop)
min:
4.6 fps, P1:
119 fps, max:
418 fps
fps
71%
GeForce RTX 2070 Super Max-Q:
127 fps
66%
GeForce RTX 2070 Mobile:
119 [X] MSI GP65 Leopard 9SF Intel Core i7-9750H 2.6GHz
GeForce RTX 2070 Mobile
min:
7.05 fps, P1:
68.9 fps, max:
215 fps
fps
100%
GeForce RTX 2060 (Desktop):
100 [X] MSI GeForce RTX 2060 Intel Core i9-9900K 3.6GHz
GeForce RTX 2060 (Desktop)
min:
3.66 fps, P1:
36.5 fps, max:
205 fps
fps
88%
GeForce RTX 2070 Super Max-Q:
87.7 fps
74%
GeForce RTX 2070 Mobile:
73.9 [X] MSI GP65 Leopard 9SF Intel Core i7-9750H 2.6GHz
GeForce RTX 2070 Mobile
min:
2.73 fps, P1:
34.4 fps, max:
153 fps
fps
100%
GeForce RTX 2060 (Desktop):
104 [X] MSI GeForce RTX 2060 Intel Core i9-9900K 3.6GHz
GeForce RTX 2060 (Desktop)
min:
5.26 fps, P1:
57.5 fps, max:
175 fps
fps
79%
GeForce RTX 2070 Super Max-Q:
81.9 fps
69%
GeForce RTX 2070 Mobile:
71.4 [X] MSI GP65 Leopard 9SF Intel Core i7-9750H 2.6GHz
GeForce RTX 2070 Mobile
min:
2.8 fps, P1:
33.7 fps, max:
152 fps
fps
100%
GeForce RTX 2060 (Desktop):
70 [X] MSI GeForce RTX 2060 Intel Core i9-9900K 3.6GHz
GeForce RTX 2060 (Desktop)
min:
8.11 fps, P1:
36.6 fps, max:
129 fps
fps
97%
GeForce RTX 2070 Super Max-Q:
67.7 fps
88%
GeForce RTX 2070 Mobile:
61.3 [X] MSI GP65 Leopard 9SF Intel Core i7-9750H 2.6GHz
GeForce RTX 2070 Mobile
min:
2.51 fps, P1:
26.3 fps, max:
108 fps
fps
100%
GeForce RTX 2060 (Desktop):
57.6 [X] MSI GeForce RTX 2060 Intel Core i9-9900K 3.6GHz
GeForce RTX 2060 (Desktop)
min:
21.3 fps, P1:
36.5 fps, max:
103 fps
fps
95%
GeForce RTX 2070 Mobile:
54.5 [X] MSI GP65 Leopard 9SF Intel Core i7-9750H 2.6GHz
GeForce RTX 2070 Mobile
min:
16.3 fps, P1:
33.7 fps, max:
91.2 fps
fps
100%
GeForce RTX 2060 (Desktop):
36.6 [X] MSI GeForce RTX 2060 Intel Core i9-9900K 3.6GHz
GeForce RTX 2060 (Desktop)
min:
14.8 fps, P1:
23.1 fps, max:
79.6 fps
fps
100%
GeForce RTX 2060 (Desktop):
138 [X] MSI GeForce RTX 2060 Intel Core i9-9900K 3.6GHz
GeForce RTX 2060 (Desktop)
min:
61.5 fps, P0.1:
66.9 fps, P1:
104 fps, max:
272 fps
fps
96%
GeForce RTX 2070 Mobile:
133 [X] MSI GP65 Leopard 9SF Intel Core i7-9750H 2.6GHz
GeForce RTX 2070 Mobile
min:
54.9 fps, P0.1:
61.3 fps, P1:
94.2 fps, max:
262 fps
fps
100%
GeForce RTX 2060 (Desktop):
70.8 [X] MSI GeForce RTX 2060 Intel Core i9-9900K 3.6GHz
GeForce RTX 2060 (Desktop)
min:
27.1 fps, P0.1:
38.1 fps, P1:
49 fps, max:
133 fps
fps
100%
GeForce RTX 2070 Mobile:
70.8 [X] MSI GP65 Leopard 9SF Intel Core i7-9750H 2.6GHz
GeForce RTX 2070 Mobile
min:
15.9 fps, P0.1:
29.9 fps, P1:
33.7 fps, max:
204 fps
fps
100%
GeForce RTX 2060 (Desktop):
49.6 [X] MSI GeForce RTX 2060 Intel Core i9-9900K 3.6GHz
GeForce RTX 2060 (Desktop)
min:
33.6 fps, P0.1:
34.9 fps, P1:
40.1 fps, max:
74.1 fps
fps
101%
GeForce RTX 2070 Mobile:
50.2 [X] MSI GP65 Leopard 9SF Intel Core i7-9750H 2.6GHz
GeForce RTX 2070 Mobile
min:
32.7 fps, P0.1:
34 fps, P1:
41.2 fps, max:
75.1 fps
fps
100%
GeForce RTX 2060 (Desktop):
27.8 [X] MSI GeForce RTX 2060 Intel Core i9-9900K 3.6GHz
GeForce RTX 2060 (Desktop)
min:
6.33 fps, P0.1:
11 fps, P1:
22.8 fps, max:
37.9 fps
fps
117%
GeForce RTX 2070 Mobile:
32.6 [X] MSI GP65 Leopard 9SF Intel Core i7-9750H 2.6GHz
GeForce RTX 2070 Mobile
min:
26 fps, P0.1:
27.2 fps, P1:
28.4 fps, max:
43.5 fps
fps
100%
GeForce RTX 2060 (Desktop):
17.6 [X] MSI GeForce RTX 2060 Intel Core i9-9900K 3.6GHz
GeForce RTX 2060 (Desktop)
min:
5.02 fps, P0.1:
5.49 fps, P1:
9.06 fps, max:
75 fps
fps
115%
GeForce RTX 2070 Mobile:
20.3 [X] MSI GP65 Leopard 9SF Intel Core i7-9750H 2.6GHz
GeForce RTX 2070 Mobile
min:
8.78 fps, P0.1:
11.4 fps, P1:
17.5 fps, max:
62.9 fps
fps
100%
GeForce RTX 2060 (Desktop):
79.1 [X] MSI GeForce RTX 2060 1.5.4.5
Intel Core i9-9900K 3.6GHz
GeForce RTX 2060 (Desktop)
min:
8.43 fps, P1:
59.856 fps, max:
97.8 fps
fps
89%
GeForce RTX 2070 Mobile:
70.6 [X] MSI GP65 Leopard 9SF 1.5.4.5
Intel Core i7-9750H 2.6GHz
GeForce RTX 2070 Mobile
min:
5.61 fps, P1:
49.268 fps, max:
89.7 fps
fps
100%
GeForce RTX 2060 (Desktop):
68.6 [X] MSI GeForce RTX 2060 1.5.4.5
Intel Core i9-9900K 3.6GHz
GeForce RTX 2060 (Desktop)
min:
4.83 fps, P1:
51.935 fps, max:
81 fps
fps
88%
GeForce RTX 2070 Mobile:
60.1 [X] MSI GP65 Leopard 9SF 1.5.4.5
Intel Core i7-9750H 2.6GHz
GeForce RTX 2070 Mobile
min:
5.3 fps, P1:
44.126 fps, max:
76.1 fps
fps
100%
GeForce RTX 2060 (Desktop):
51.6 [X] MSI GeForce RTX 2060 1.5.4.5
Intel Core i9-9900K 3.6GHz
GeForce RTX 2060 (Desktop)
min:
6.21 fps, P1:
41.962 fps, max:
63.4 fps
fps
95%
GeForce RTX 2070 Mobile:
48.9 [X] MSI GP65 Leopard 9SF 1.5.4.5
Intel Core i7-9750H 2.6GHz
GeForce RTX 2070 Mobile
min:
6.4 fps, P1:
35.9 fps, max:
61 fps
fps
100%
GeForce RTX 2060 (Desktop):
35.9 [X] MSI GeForce RTX 2060 1.5.4.5
Intel Core i9-9900K 3.6GHz
GeForce RTX 2060 (Desktop)
min:
7.81 fps, P1:
28.35 fps, max:
47.2 fps
fps
98%
GeForce RTX 2070 Mobile:
35.3 [X] MSI GP65 Leopard 9SF 1.5.4.5
Intel Core i7-9750H 2.6GHz
GeForce RTX 2070 Mobile
min:
7.24 fps, P1:
27.587 fps, max:
46.5 fps
fps
100%
GeForce RTX 2060 (Desktop):
26.4 [X] MSI GeForce RTX 2060 1.5.4.5
Intel Core i9-9900K 3.6GHz
GeForce RTX 2060 (Desktop)
min:
10.7 fps, P1:
18.1 fps, max:
45.8 fps
fps
102%
GeForce RTX 2070 Mobile:
26.8 [X] MSI GP65 Leopard 9SF 1.5.4.5
Intel Core i7-9750H 2.6GHz
GeForce RTX 2070 Mobile
min:
10.2 fps, P1:
21.544 fps, max:
42.1 fps
fps
100%
GeForce RTX 2060 (Desktop):
15.5 [X] MSI GeForce RTX 2060 1.5.4.5
Intel Core i9-9900K 3.6GHz
GeForce RTX 2060 (Desktop)
min:
7.23 fps, P1:
9.94 fps, max:
34.7 fps
fps
105%
GeForce RTX 2070 Mobile:
16.3 [X] MSI GP65 Leopard 9SF 1.5.4.5
Intel Core i7-9750H 2.6GHz
GeForce RTX 2070 Mobile
min:
9.45 fps, P1:
13.937 fps, max:
37.7 fps
fps
100%
GeForce RTX 2060 (Desktop):
146 [X] MSI GeForce RTX 2060 Intel Core i9-9900K 3.6GHz
GeForce RTX 2060 (Desktop)
min:
57 fps
fps
99%
GeForce RTX 2070 Super Max-Q:
145 fps
90%
GeForce RTX 2070 Mobile:
131 [X] MSI GP65 Leopard 9SF Intel Core i7-9750H 2.6GHz
GeForce RTX 2070 Mobile
min:
37 fps
fps
100%
GeForce RTX 2060 (Desktop):
101 [X] MSI GeForce RTX 2060 Intel Core i9-9900K 3.6GHz
GeForce RTX 2060 (Desktop)
min:
43 fps
fps
119%
GeForce RTX 2070 Super Max-Q:
120 fps
99%
GeForce RTX 2070 Mobile:
100 [X] MSI GP65 Leopard 9SF Intel Core i7-9750H 2.6GHz
GeForce RTX 2070 Mobile
min:
30 fps
fps
100%
GeForce RTX 2060 (Desktop):
86 [X] MSI GeForce RTX 2060 Intel Core i9-9900K 3.6GHz
GeForce RTX 2060 (Desktop)
min:
40 fps
fps
124%
GeForce RTX 2070 Super Max-Q:
107 fps
99%
GeForce RTX 2070 Mobile:
85 [X] MSI GP65 Leopard 9SF Intel Core i7-9750H 2.6GHz
GeForce RTX 2070 Mobile
min:
30 fps
fps
100%
GeForce RTX 2060 (Desktop):
69 [X] MSI GeForce RTX 2060 Intel Core i9-9900K 3.6GHz
GeForce RTX 2060 (Desktop)
min:
41 fps
fps
135%
GeForce RTX 2070 Super Max-Q:
93 fps
97%
GeForce RTX 2070 Mobile:
67 [X] MSI GP65 Leopard 9SF Intel Core i7-9750H 2.6GHz
GeForce RTX 2070 Mobile
min:
26 fps
fps
100%
GeForce RTX 2060 (Desktop):
52 [X] MSI GeForce RTX 2060 Intel Core i9-9900K 3.6GHz
GeForce RTX 2060 (Desktop)
min:
30 fps
fps
98%
GeForce RTX 2070 Mobile:
51 [X] MSI GP65 Leopard 9SF Intel Core i7-9750H 2.6GHz
GeForce RTX 2070 Mobile
min:
25 fps
fps
100%
GeForce RTX 2060 (Desktop):
30 [X] MSI GeForce RTX 2060 Intel Core i9-9900K 3.6GHz
GeForce RTX 2060 (Desktop)
min:
18 fps
fps
97%
GeForce RTX 2070 Mobile:
29 [X] MSI GP65 Leopard 9SF Intel Core i7-9750H 2.6GHz
GeForce RTX 2070 Mobile
min:
15 fps
fps
100%
GeForce RTX 2060 (Desktop):
173 [X] MSI GeForce RTX 2060 Intel Core i9-9900K 3.6GHz
GeForce RTX 2060 (Desktop)
min:
101 fps
fps
95%
GeForce RTX 2070 Super Max-Q:
164.3 fps
88%
GeForce RTX 2070 Mobile:
149.3 156 [X] MSI GP65 Leopard 9SF Intel Core i7-9750H 2.6GHz
GeForce RTX 2070 Mobile
min:
111 fps
~ 153 fps
100%
GeForce RTX 2060 (Desktop):
118 [X] MSI GeForce RTX 2060 Intel Core i9-9900K 3.6GHz
GeForce RTX 2060 (Desktop)
min:
93 fps
fps
97%
GeForce RTX 2070 Super Max-Q:
114.5 fps
107%
GeForce RTX 2070 Mobile:
125 [X] MSI GP65 Leopard 9SF Intel Core i7-9750H 2.6GHz
GeForce RTX 2070 Mobile
min:
94 fps
126 ~ 126 fps
100%
GeForce RTX 2060 (Desktop):
111 [X] MSI GeForce RTX 2060 Intel Core i9-9900K 3.6GHz
GeForce RTX 2060 (Desktop)
min:
91 fps
fps
94%
GeForce RTX 2070 Super Max-Q:
104.3 fps
104%
GeForce RTX 2070 Mobile:
114.6 115 [X] MSI GP65 Leopard 9SF Intel Core i7-9750H 2.6GHz
GeForce RTX 2070 Mobile
min:
91 fps
~ 115 fps
100%
GeForce RTX 2060 (Desktop):
107 [X] MSI GeForce RTX 2060 Intel Core i9-9900K 3.6GHz
GeForce RTX 2060 (Desktop)
min:
88 fps
fps
95%
GeForce RTX 2070 Super Max-Q:
101.8 fps
106%
GeForce RTX 2070 Mobile:
112 113 [X] MSI GP65 Leopard 9SF Intel Core i7-9750H 2.6GHz
GeForce RTX 2070 Mobile
min:
61 fps
~ 113 fps
100%
GeForce RTX 2060 (Desktop):
76.4 [X] MSI GeForce RTX 2060 Intel Core i9-9900K 3.6GHz
GeForce RTX 2060 (Desktop)
min:
65 fps
fps
103%
GeForce RTX 2070 Mobile:
78.8 [X] MSI GP65 Leopard 9SF Intel Core i7-9750H 2.6GHz
GeForce RTX 2070 Mobile
min:
53 fps
fps
100%
GeForce RTX 2060 (Desktop):
42.3 [X] MSI GeForce RTX 2060 Intel Core i9-9900K 3.6GHz
GeForce RTX 2060 (Desktop)
min:
36 fps
fps
101%
GeForce RTX 2070 Mobile:
42.6 [X] MSI GP65 Leopard 9SF Intel Core i7-9750H 2.6GHz
GeForce RTX 2070 Mobile
min:
33 fps
fps
100%
GeForce RTX 2060 (Desktop):
288 [X] MSI GeForce RTX 2060 Intel Core i9-9900K 3.6GHz
GeForce RTX 2060 (Desktop)
min:
225 fps
fps
90%
GeForce RTX 2070 Super Max-Q:
258 [X] Aorus 15G XB Intel Core i7-10875H 2.3GHz
GeForce RTX 2070 Super Max-Q
min:
213 fps, max:
280 fps
fps
72%
GeForce RTX 2070 Mobile:
182 [X] MSI GP65 Leopard 9SF Intel Core i7-9750H 2.6GHz
GeForce RTX 2070 Mobile
min:
154 fps
230 ~ 206 fps
100%
GeForce RTX 2060 (Desktop):
211 [X] MSI GeForce RTX 2060 Intel Core i9-9900K 3.6GHz
GeForce RTX 2060 (Desktop)
min:
181 fps
fps
77%
GeForce RTX 2070 Super Max-Q:
163 [X] Aorus 15G XB Intel Core i7-10875H 2.3GHz
GeForce RTX 2070 Super Max-Q
min:
153 fps, max:
178 fps
fps
79%
GeForce RTX 2070 Mobile:
155 [X] MSI GP65 Leopard 9SF Intel Core i7-9750H 2.6GHz
GeForce RTX 2070 Mobile
min:
132 fps
177 ~ 166 fps
100%
GeForce RTX 2060 (Desktop):
172 [X] MSI GeForce RTX 2060 Intel Core i9-9900K 3.6GHz
GeForce RTX 2060 (Desktop)
min:
149 fps
fps
84%
GeForce RTX 2070 Super Max-Q:
145 [X] Aorus 15G XB Intel Core i7-10875H 2.3GHz
GeForce RTX 2070 Super Max-Q
min:
131 fps, max:
158 fps
fps
85%
GeForce RTX 2070 Mobile:
146 [X] MSI GP65 Leopard 9SF Intel Core i7-9750H 2.6GHz
GeForce RTX 2070 Mobile
min:
127 fps
148 ~ 147 fps
100%
GeForce RTX 2060 (Desktop):
120 [X] MSI GeForce RTX 2060 Intel Core i9-9900K 3.6GHz
GeForce RTX 2060 (Desktop)
min:
98 fps
fps
87%
GeForce RTX 2070 Super Max-Q:
104 [X] Aorus 15G XB Intel Core i7-10875H 2.3GHz
GeForce RTX 2070 Super Max-Q
min:
88 fps, max:
122 fps
fps
95%
GeForce RTX 2070 Mobile:
112 [X] MSI GP65 Leopard 9SF Intel Core i7-9750H 2.6GHz
GeForce RTX 2070 Mobile
min:
95 fps
115 ~ 114 fps
100%
GeForce RTX 2060 (Desktop):
89 [X] MSI GeForce RTX 2060 Intel Core i9-9900K 3.6GHz
GeForce RTX 2060 (Desktop)
min:
75 fps
fps
98%
GeForce RTX 2070 Mobile:
87 [X] MSI GP65 Leopard 9SF Intel Core i7-9750H 2.6GHz
GeForce RTX 2070 Mobile
min:
72 fps
fps
100%
GeForce RTX 2060 (Desktop):
52 [X] MSI GeForce RTX 2060 Intel Core i9-9900K 3.6GHz
GeForce RTX 2060 (Desktop)
min:
44 fps
fps
96%
GeForce RTX 2070 Mobile:
50 [X] MSI GP65 Leopard 9SF Intel Core i7-9750H 2.6GHz
GeForce RTX 2070 Mobile
min:
42 fps
fps
100%
GeForce RTX 2060 (Desktop):
264 [X] MSI GeForce RTX 2060 Intel Core i9-9900K 3.6GHz
GeForce RTX 2060 (Desktop)
min:
202 fps
fps
90%
GeForce RTX 2070 Mobile:
237 [X] MSI GP65 Leopard 9SF Intel Core i7-9750H 2.6GHz
GeForce RTX 2070 Mobile
min:
180 fps
fps
100%
GeForce RTX 2060 (Desktop):
248 [X] MSI GeForce RTX 2060 Intel Core i9-9900K 3.6GHz
GeForce RTX 2060 (Desktop)
min:
198 fps
fps
94%
GeForce RTX 2070 Mobile:
234 [X] MSI GP65 Leopard 9SF Intel Core i7-9750H 2.6GHz
GeForce RTX 2070 Mobile
min:
177 fps
fps
100%
GeForce RTX 2060 (Desktop):
247 [X] MSI GeForce RTX 2060 Intel Core i9-9900K 3.6GHz
GeForce RTX 2060 (Desktop)
min:
192 fps
fps
93%
GeForce RTX 2070 Mobile:
230 [X] MSI GP65 Leopard 9SF Intel Core i7-9750H 2.6GHz
GeForce RTX 2070 Mobile
min:
173 fps
fps
100%
GeForce RTX 2060 (Desktop):
241 [X] MSI GeForce RTX 2060 Intel Core i9-9900K 3.6GHz
GeForce RTX 2060 (Desktop)
min:
189 fps
fps
95%
GeForce RTX 2070 Mobile:
229 [X] MSI GP65 Leopard 9SF Intel Core i7-9750H 2.6GHz
GeForce RTX 2070 Mobile
min:
168 fps
fps
100%
GeForce RTX 2060 (Desktop):
208 [X] MSI GeForce RTX 2060 Intel Core i9-9900K 3.6GHz
GeForce RTX 2060 (Desktop)
min:
189 fps
fps
97%
GeForce RTX 2070 Mobile:
202 [X] MSI GP65 Leopard 9SF Intel Core i7-9750H 2.6GHz
GeForce RTX 2070 Mobile
min:
165 fps
fps
100%
GeForce RTX 2060 (Desktop):
309 [X] MSI GeForce RTX 2060 Intel Core i9-9900K 3.6GHz
GeForce RTX 2060 (Desktop)
fps
88%
GeForce RTX 2070 Super Max-Q:
272.4 fps
77%
GeForce RTX 2070 Mobile:
226.5 248 [X] MSI GP65 Leopard 9SF Intel Core i7-9750H 2.6GHz
GeForce RTX 2070 Mobile
~ 237 fps
100%
GeForce RTX 2060 (Desktop):
193 [X] MSI GeForce RTX 2060 Intel Core i9-9900K 3.6GHz
GeForce RTX 2060 (Desktop)
fps
86%
GeForce RTX 2070 Super Max-Q:
165.8 fps
91%
GeForce RTX 2070 Mobile:
169.9 182 [X] MSI GP65 Leopard 9SF Intel Core i7-9750H 2.6GHz
GeForce RTX 2070 Mobile
~ 176 fps
100%
GeForce RTX 2060 (Desktop):
120 [X] MSI GeForce RTX 2060 Intel Core i9-9900K 3.6GHz
GeForce RTX 2060 (Desktop)
fps
93%
GeForce RTX 2070 Super Max-Q:
109 109.2 116 ~ 111 fps
101%
GeForce RTX 2070 Mobile:
115.2 119 128 [X] MSI GP65 Leopard 9SF Intel Core i7-9750H 2.6GHz
GeForce RTX 2070 Mobile
~ 121 fps
100%
GeForce RTX 2060 (Desktop):
82.9 [X] MSI GeForce RTX 2060 Intel Core i9-9900K 3.6GHz
GeForce RTX 2060 (Desktop)
fps
101%
GeForce RTX 2070 Super Max-Q:
79 82.2 90.6 ~ 84 fps
105%
GeForce RTX 2070 Mobile:
85 [X] MSI GP65 Leopard 9SF Intel Core i7-9750H 2.6GHz
GeForce RTX 2070 Mobile
85.8 90.9 ~ 87 fps
100%
GeForce RTX 2060 (Desktop):
57.1 [X] MSI GeForce RTX 2060 Intel Core i9-9900K 3.6GHz
GeForce RTX 2060 (Desktop)
fps
105%
GeForce RTX 2070 Mobile:
59.9 [X] MSI GP65 Leopard 9SF Intel Core i7-9750H 2.6GHz
GeForce RTX 2070 Mobile
fps
100%
GeForce RTX 2060 (Desktop):
31.1 [X] MSI GeForce RTX 2060 Intel Core i9-9900K 3.6GHz
GeForce RTX 2060 (Desktop)
fps
102%
GeForce RTX 2070 Mobile:
31.6 [X] MSI GP65 Leopard 9SF Intel Core i7-9750H 2.6GHz
GeForce RTX 2070 Mobile
fps
100%
GeForce RTX 2060 (Desktop):
281 [X] MSI GeForce RTX 2060 Intel Core i9-9900K 3.6GHz
GeForce RTX 2060 (Desktop)
min:
132 fps
fps
82%
GeForce RTX 2070 Super Max-Q:
229.6 232.3 ~ 231 fps
85%
GeForce RTX 2070 Mobile:
217.6 259 [X] MSI GP65 Leopard 9SF Intel Core i7-9750H 2.6GHz
GeForce RTX 2070 Mobile
min:
112 fps
~ 238 fps
100%
GeForce RTX 2060 (Desktop):
185 [X] MSI GeForce RTX 2060 Intel Core i9-9900K 3.6GHz
GeForce RTX 2060 (Desktop)
min:
123 fps
fps
85%
GeForce RTX 2070 Super Max-Q:
152 157 164.1 ~ 158 fps
92%
GeForce RTX 2070 Mobile:
162 177 [X] MSI GP65 Leopard 9SF Intel Core i7-9750H 2.6GHz
GeForce RTX 2070 Mobile
min:
111 fps
~ 170 fps
100%
GeForce RTX 2060 (Desktop):
167 [X] MSI GeForce RTX 2060 Intel Core i9-9900K 3.6GHz
GeForce RTX 2060 (Desktop)
min:
122 fps
fps
93%
GeForce RTX 2070 Mobile:
148.9 157 [X] MSI GP65 Leopard 9SF Intel Core i7-9750H 2.6GHz
GeForce RTX 2070 Mobile
min:
109 fps
161 ~ 156 fps
100%
GeForce RTX 2060 (Desktop):
162 [X] MSI GeForce RTX 2060 Intel Core i9-9900K 3.6GHz
GeForce RTX 2060 (Desktop)
min:
115 fps
fps
94%
GeForce RTX 2070 Mobile:
145.1 154 [X] MSI GP65 Leopard 9SF Intel Core i7-9750H 2.6GHz
GeForce RTX 2070 Mobile
min:
104 fps
157 ~ 152 fps
100%
GeForce RTX 2060 (Desktop):
102 [X] MSI GeForce RTX 2060 Intel Core i9-9900K 3.6GHz
GeForce RTX 2060 (Desktop)
min:
71 fps
fps
98%
GeForce RTX 2070 Super Max-Q:
99.6 fps
102%
GeForce RTX 2070 Mobile:
104 [X] MSI GP65 Leopard 9SF Intel Core i7-9750H 2.6GHz
GeForce RTX 2070 Mobile
min:
78 fps
fps
100%
GeForce RTX 2060 (Desktop):
45.9 [X] MSI GeForce RTX 2060 Intel Core i9-9900K 3.6GHz
GeForce RTX 2060 (Desktop)
min:
31 fps
fps
112%
GeForce RTX 2070 Super Max-Q:
51.2 fps
119%
GeForce RTX 2070 Mobile:
54.7 [X] MSI GP65 Leopard 9SF Intel Core i7-9750H 2.6GHz
GeForce RTX 2070 Mobile
min:
44 fps
fps
100%
GeForce RTX 2060 (Desktop):
228 [X] MSI GeForce RTX 2060 Intel Core i9-9900K 3.6GHz
GeForce RTX 2060 (Desktop)
min:
202 fps
fps
86%
GeForce RTX 2070 Mobile:
184.2 205 [X] MSI GP65 Leopard 9SF Intel Core i7-9750H 2.6GHz
GeForce RTX 2070 Mobile
min:
176 fps
~ 195 fps
100%
GeForce RTX 2060 (Desktop):
120 [X] MSI GeForce RTX 2060 Intel Core i9-9900K 3.6GHz
GeForce RTX 2060 (Desktop)
min:
112 fps
fps
91%
GeForce RTX 2070 Super Max-Q:
109 fps
103%
GeForce RTX 2070 Mobile:
123 [X] MSI GP65 Leopard 9SF Intel Core i7-9750H 2.6GHz
GeForce RTX 2070 Mobile
min:
113 fps
124 ~ 124 fps
100%
GeForce RTX 2060 (Desktop):
104 [X] MSI GeForce RTX 2060 Intel Core i9-9900K 3.6GHz
GeForce RTX 2060 (Desktop)
min:
95 fps
fps
90%
GeForce RTX 2070 Super Max-Q:
91.6 96.8 ~ 94 fps
99%
GeForce RTX 2070 Mobile:
101 101.7 105 [X] MSI GP65 Leopard 9SF Intel Core i7-9750H 2.6GHz
GeForce RTX 2070 Mobile
min:
96 fps
~ 103 fps
100%
GeForce RTX 2060 (Desktop):
63.8 [X] MSI GeForce RTX 2060 Intel Core i9-9900K 3.6GHz
GeForce RTX 2060 (Desktop)
min:
60 fps
fps
89%
GeForce RTX 2070 Super Max-Q:
56.8 fps
103%
GeForce RTX 2070 Mobile:
65.8 [X] MSI GP65 Leopard 9SF Intel Core i7-9750H 2.6GHz
GeForce RTX 2070 Mobile
min:
62 fps
fps
100%
GeForce RTX 2060 (Desktop):
30.3 [X] MSI GeForce RTX 2060 Intel Core i9-9900K 3.6GHz
GeForce RTX 2060 (Desktop)
min:
28 fps
fps
90%
GeForce RTX 2070 Super Max-Q:
27.4 fps
103%
GeForce RTX 2070 Mobile:
31.3 [X] MSI GP65 Leopard 9SF Intel Core i7-9750H 2.6GHz
GeForce RTX 2070 Mobile
min:
29 fps
fps
100%
GeForce RTX 2060 (Desktop):
121 [X] MSI GeForce RTX 2060 Intel Core i9-9900K 3.6GHz
GeForce RTX 2060 (Desktop)
min:
119 fps
fps
100%
GeForce RTX 2070 Mobile:
121 [X] MSI GP65 Leopard 9SF Intel Core i7-9750H 2.6GHz
GeForce RTX 2070 Mobile
min:
118 fps
fps
100%
GeForce RTX 2060 (Desktop):
121 [X] MSI GeForce RTX 2060 Intel Core i9-9900K 3.6GHz
GeForce RTX 2060 (Desktop)
min:
117 fps
fps
100%
GeForce RTX 2070 Super Max-Q:
121 fps
100%
GeForce RTX 2070 Mobile:
121 [X] MSI GP65 Leopard 9SF Intel Core i7-9750H 2.6GHz
GeForce RTX 2070 Mobile
min:
117 fps
fps
100%
GeForce RTX 2060 (Desktop):
121 [X] MSI GeForce RTX 2060 Intel Core i9-9900K 3.6GHz
GeForce RTX 2060 (Desktop)
min:
113 fps
fps
98%
GeForce RTX 2070 Super Max-Q:
116 121 ~ 119 fps
99%
GeForce RTX 2070 Mobile:
119 [X] MSI GP65 Leopard 9SF Intel Core i7-9750H 2.6GHz
GeForce RTX 2070 Mobile
min:
108 fps
120 ~ 120 fps
100%
GeForce RTX 2060 (Desktop):
119 [X] MSI GeForce RTX 2060 Intel Core i9-9900K 3.6GHz
GeForce RTX 2060 (Desktop)
min:
111 fps
fps
95%
GeForce RTX 2070 Super Max-Q:
107 119 ~ 113 fps
93%
GeForce RTX 2070 Mobile:
104 118 [X] MSI GP65 Leopard 9SF Intel Core i7-9750H 2.6GHz
GeForce RTX 2070 Mobile
min:
97 fps
~ 111 fps
100%
GeForce RTX 2060 (Desktop):
86.2 [X] MSI GeForce RTX 2060 Intel Core i9-9900K 3.6GHz
GeForce RTX 2060 (Desktop)
min:
81 fps
fps
93%
GeForce RTX 2070 Super Max-Q:
79.8 fps
91%
GeForce RTX 2070 Mobile:
78.8 [X] MSI GP65 Leopard 9SF Intel Core i7-9750H 2.6GHz
GeForce RTX 2070 Mobile
min:
74 fps
fps
100%
GeForce RTX 2060 (Desktop):
39.8 [X] MSI GeForce RTX 2060 Intel Core i9-9900K 3.6GHz
GeForce RTX 2060 (Desktop)
min:
34 fps
fps
92%
GeForce RTX 2070 Super Max-Q:
36.8 fps
95%
GeForce RTX 2070 Mobile:
37.8 [X] MSI GP65 Leopard 9SF Intel Core i7-9750H 2.6GHz
GeForce RTX 2070 Mobile
min:
34 fps
fps
100%
GeForce RTX 2060 (Desktop):
154 [X] MSI GeForce RTX 2060 Intel Core i9-9900K 3.6GHz
GeForce RTX 2060 (Desktop)
min:
13 fps
fps
86%
GeForce RTX 2070 Super Max-Q:
132.8 fps
79%
GeForce RTX 2070 Mobile:
117 [X] MSI GP65 Leopard 9SF Intel Core i7-9750H 2.6GHz
GeForce RTX 2070 Mobile
min:
21 fps
127.9 ~ 122 fps
100%
GeForce RTX 2060 (Desktop):
102 [X] MSI GeForce RTX 2060 Intel Core i9-9900K 3.6GHz
GeForce RTX 2060 (Desktop)
min:
14 fps
fps
87%
GeForce RTX 2070 Super Max-Q:
86.6 91.3 ~ 89 fps
96%
GeForce RTX 2070 Mobile:
97.5 99.2 [X] MSI GP65 Leopard 9SF Intel Core i7-9750H 2.6GHz
GeForce RTX 2070 Mobile
min:
20 fps
~ 98 fps
100%
GeForce RTX 2060 (Desktop):
68.5 [X] MSI GeForce RTX 2060 Intel Core i9-9900K 3.6GHz
GeForce RTX 2060 (Desktop)
min:
6 fps
fps
98%
GeForce RTX 2070 Mobile:
66.4 66.8 67.4 [X] MSI GP65 Leopard 9SF Intel Core i7-9750H 2.6GHz
GeForce RTX 2070 Mobile
min:
20 fps
~ 67 fps
100%
GeForce RTX 2060 (Desktop):
43.6 [X] MSI GeForce RTX 2060 Intel Core i9-9900K 3.6GHz
GeForce RTX 2060 (Desktop)
min:
6 fps
fps
99%
GeForce RTX 2070 Mobile:
42.4 42.6 [X] MSI GP65 Leopard 9SF Intel Core i7-9750H 2.6GHz
GeForce RTX 2070 Mobile
min:
17 fps
43 ~ 43 fps
100%
GeForce RTX 2060 (Desktop):
35.1 [X] MSI GeForce RTX 2060 Intel Core i9-9900K 3.6GHz
GeForce RTX 2060 (Desktop)
min:
7 fps
fps
94%
GeForce RTX 2070 Super Max-Q:
32 34.3 ~ 33 fps
100%
GeForce RTX 2070 Mobile:
35 [X] MSI GP65 Leopard 9SF Intel Core i7-9750H 2.6GHz
GeForce RTX 2070 Mobile
min:
16 fps
fps
100%
GeForce RTX 2060 (Desktop):
24 [X] MSI GeForce RTX 2060 Intel Core i9-9900K 3.6GHz
GeForce RTX 2060 (Desktop)
min:
7 fps
fps
88%
GeForce RTX 2070 Super Max-Q:
20.5 22 ~ 21 fps
95%
GeForce RTX 2070 Mobile:
22.9 [X] MSI GP65 Leopard 9SF Intel Core i7-9750H 2.6GHz
GeForce RTX 2070 Mobile
min:
6 fps
fps
100%
GeForce RTX 2060 (Desktop):
109 [X] MSI GeForce RTX 2060 Intel Core i9-9900K 3.6GHz
GeForce RTX 2060 (Desktop)
min:
68 fps
fps
100%
GeForce RTX 2070 Super Max-Q:
108 109 ~ 109 fps
97%
GeForce RTX 2070 Mobile:
106 [X] MSI GP65 Leopard 9SF Intel Core i7-9750H 2.6GHz
GeForce RTX 2070 Mobile
min:
67 fps
fps
100%
GeForce RTX 2060 (Desktop):
105 [X] MSI GeForce RTX 2060 Intel Core i9-9900K 3.6GHz
GeForce RTX 2060 (Desktop)
min:
66 fps
fps
94%
GeForce RTX 2070 Super Max-Q:
95 98.2 104 ~ 99 fps
90%
GeForce RTX 2070 Mobile:
92.2 98.7 [X] MSI GP65 Leopard 9SF Intel Core i7-9750H 2.6GHz
GeForce RTX 2070 Mobile
min:
63 fps
~ 95 fps
100%
GeForce RTX 2060 (Desktop):
96 [X] MSI GeForce RTX 2060 Intel Core i9-9900K 3.6GHz
GeForce RTX 2060 (Desktop)
min:
63 fps
fps
96%
GeForce RTX 2070 Mobile:
90.7 93 [X] MSI GP65 Leopard 9SF Intel Core i7-9750H 2.6GHz
GeForce RTX 2070 Mobile
min:
60 fps
~ 92 fps
100%
GeForce RTX 2060 (Desktop):
74.2 [X] MSI GeForce RTX 2060 Intel Core i9-9900K 3.6GHz
GeForce RTX 2060 (Desktop)
min:
61 fps
fps
96%
GeForce RTX 2070 Super Max-Q:
71.3 fps
99%
GeForce RTX 2070 Mobile:
73.4 [X] MSI GP65 Leopard 9SF Intel Core i7-9750H 2.6GHz
GeForce RTX 2070 Mobile
min:
55 fps
fps
100%
GeForce RTX 2060 (Desktop):
38.4 [X] MSI GeForce RTX 2060 Intel Core i9-9900K 3.6GHz
GeForce RTX 2060 (Desktop)
min:
35 fps
fps
93%
GeForce RTX 2070 Super Max-Q:
35.9 fps
97%
GeForce RTX 2070 Mobile:
37.3 [X] MSI GP65 Leopard 9SF Intel Core i7-9750H 2.6GHz
GeForce RTX 2070 Mobile
min:
33 fps
fps
100%
GeForce RTX 2060 (Desktop):
122 [X] MSI GeForce RTX 2060 Intel Core i9-9900K 3.6GHz
GeForce RTX 2060 (Desktop)
min:
99 fps
fps
85%
GeForce RTX 2070 Mobile:
104 [X] MSI GP65 Leopard 9SF Intel Core i7-9750H 2.6GHz
GeForce RTX 2070 Mobile
min:
89 fps
fps
100%
GeForce RTX 2060 (Desktop):
113 [X] MSI GeForce RTX 2060 Intel Core i9-9900K 3.6GHz
GeForce RTX 2060 (Desktop)
min:
97 fps
fps
91%
GeForce RTX 2070 Super Max-Q:
103 fps
83%
GeForce RTX 2070 Mobile:
94.2 [X] MSI GP65 Leopard 9SF Intel Core i7-9750H 2.6GHz
GeForce RTX 2070 Mobile
min:
79 fps
fps
100%
GeForce RTX 2060 (Desktop):
103 [X] MSI GeForce RTX 2060 Intel Core i9-9900K 3.6GHz
GeForce RTX 2060 (Desktop)
min:
89 fps
fps
88%
GeForce RTX 2070 Super Max-Q:
88.2 94 ~ 91 fps
83%
GeForce RTX 2070 Mobile:
83.5 88 [X] MSI GP65 Leopard 9SF Intel Core i7-9750H 2.6GHz
GeForce RTX 2070 Mobile
min:
74 fps
~ 86 fps
100%
GeForce RTX 2060 (Desktop):
86.9 [X] MSI GeForce RTX 2060 Intel Core i9-9900K 3.6GHz
GeForce RTX 2060 (Desktop)
min:
69 fps
fps
94%
GeForce RTX 2070 Super Max-Q:
80.7 82.6 ~ 82 fps
90%
GeForce RTX 2070 Mobile:
78.1 78.3 [X] MSI GP65 Leopard 9SF Intel Core i7-9750H 2.6GHz
GeForce RTX 2070 Mobile
min:
56 fps
~ 78 fps
100%
GeForce RTX 2060 (Desktop):
64.1 [X] MSI GeForce RTX 2060 Intel Core i9-9900K 3.6GHz
GeForce RTX 2060 (Desktop)
min:
56 fps
fps
94%
GeForce RTX 2070 Super Max-Q:
60.5 fps
100%
GeForce RTX 2070 Mobile:
63.9 [X] MSI GP65 Leopard 9SF Intel Core i7-9750H 2.6GHz
GeForce RTX 2070 Mobile
min:
54 fps
fps
100%
GeForce RTX 2060 (Desktop):
36.7 [X] MSI GeForce RTX 2060 Intel Core i9-9900K 3.6GHz
GeForce RTX 2060 (Desktop)
min:
29 fps
fps
91%
GeForce RTX 2070 Super Max-Q:
33.4 fps
102%
GeForce RTX 2070 Mobile:
37.5 [X] MSI GP65 Leopard 9SF Intel Core i7-9750H 2.6GHz
GeForce RTX 2070 Mobile
min:
32 fps
fps
100%
GeForce RTX 2060 (Desktop):
203 [X] MSI GeForce RTX 2060 Intel Core i9-9900K 3.6GHz
GeForce RTX 2060 (Desktop)
min:
145 fps
fps
79%
GeForce RTX 2070 Super Max-Q:
160.9 fps
98%
GeForce RTX 2070 Mobile:
199 [X] MSI GP65 Leopard 9SF Intel Core i7-9750H 2.6GHz
GeForce RTX 2070 Mobile
min:
135 fps
fps
100%
GeForce RTX 2060 (Desktop):
135 [X] MSI GeForce RTX 2060 Intel Core i9-9900K 3.6GHz
GeForce RTX 2060 (Desktop)
min:
97 fps
fps
93%
GeForce RTX 2070 Super Max-Q:
116.2 134 ~ 125 fps
98%
GeForce RTX 2070 Mobile:
132 [X] MSI GP65 Leopard 9SF Intel Core i7-9750H 2.6GHz
GeForce RTX 2070 Mobile
min:
104 fps
fps
100%
GeForce RTX 2060 (Desktop):
130 [X] MSI GeForce RTX 2060 Intel Core i9-9900K 3.6GHz
GeForce RTX 2060 (Desktop)
min:
95 fps
fps
88%
GeForce RTX 2070 Super Max-Q:
97.8 117 126 ~ 114 fps
94%
GeForce RTX 2070 Mobile:
113 130 [X] MSI GP65 Leopard 9SF Intel Core i7-9750H 2.6GHz
GeForce RTX 2070 Mobile
min:
96 fps
~ 122 fps
100%
GeForce RTX 2060 (Desktop):
105 [X] MSI GeForce RTX 2060 Intel Core i9-9900K 3.6GHz
GeForce RTX 2060 (Desktop)
min:
81 fps
fps
91%
GeForce RTX 2070 Super Max-Q:
84.2 99.6 104 ~ 96 fps
94%
GeForce RTX 2070 Mobile:
92.9 105 [X] MSI GP65 Leopard 9SF Intel Core i7-9750H 2.6GHz
GeForce RTX 2070 Mobile
min:
78 fps
~ 99 fps
100%
GeForce RTX 2060 (Desktop):
76 [X] MSI GeForce RTX 2060 Intel Core i9-9900K 3.6GHz
GeForce RTX 2060 (Desktop)
min:
63 fps
fps
95%
GeForce RTX 2070 Super Max-Q:
72.3 fps
99%
GeForce RTX 2070 Mobile:
75.4 [X] MSI GP65 Leopard 9SF Intel Core i7-9750H 2.6GHz
GeForce RTX 2070 Mobile
min:
60 fps
fps
100%
GeForce RTX 2060 (Desktop):
43.1 [X] MSI GeForce RTX 2060 Intel Core i9-9900K 3.6GHz
GeForce RTX 2060 (Desktop)
min:
35 fps
fps
95%
GeForce RTX 2070 Super Max-Q:
41 fps
99%
GeForce RTX 2070 Mobile:
42.5 [X] MSI GP65 Leopard 9SF Intel Core i7-9750H 2.6GHz
GeForce RTX 2070 Mobile
min:
35 fps
fps
100%
GeForce RTX 2060 (Desktop):
216 [X] MSI GeForce RTX 2060 Intel Core i9-9900K 3.6GHz
GeForce RTX 2060 (Desktop)
min:
174 fps
fps
87%
GeForce RTX 2070 Mobile:
187 [X] MSI GP65 Leopard 9SF Intel Core i7-9750H 2.6GHz
GeForce RTX 2070 Mobile
min:
147 fps
fps
100%
GeForce RTX 2060 (Desktop):
145 [X] MSI GeForce RTX 2060 Intel Core i9-9900K 3.6GHz
GeForce RTX 2060 (Desktop)
min:
120 fps
fps
90%
GeForce RTX 2070 Super Max-Q:
131 fps
105%
GeForce RTX 2070 Mobile:
152 [X] MSI GP65 Leopard 9SF Intel Core i7-9750H 2.6GHz
GeForce RTX 2070 Mobile
min:
122 fps
fps
100%
GeForce RTX 2060 (Desktop):
111 [X] MSI GeForce RTX 2060 Intel Core i9-9900K 3.6GHz
GeForce RTX 2060 (Desktop)
min:
92 fps
fps
94%
GeForce RTX 2070 Super Max-Q:
103 104 ~ 104 fps
103%
GeForce RTX 2070 Mobile:
104 124 [X] MSI GP65 Leopard 9SF Intel Core i7-9750H 2.6GHz
GeForce RTX 2070 Mobile
min:
100 fps
~ 114 fps
100%
GeForce RTX 2060 (Desktop):
79.5 [X] MSI GeForce RTX 2060 Intel Core i9-9900K 3.6GHz
GeForce RTX 2060 (Desktop)
min:
58 fps
fps
88%
GeForce RTX 2070 Super Max-Q:
69.7 71.1 ~ 70 fps
99%
GeForce RTX 2070 Mobile:
75.4 83.5 [X] MSI GP65 Leopard 9SF Intel Core i7-9750H 2.6GHz
GeForce RTX 2070 Mobile
min:
66 fps
~ 79 fps
100%
GeForce RTX 2060 (Desktop):
64.5 [X] MSI GeForce RTX 2060 Intel Core i9-9900K 3.6GHz
GeForce RTX 2060 (Desktop)
min:
46 fps
fps
94%
GeForce RTX 2070 Super Max-Q:
60.6 fps
102%
GeForce RTX 2070 Mobile:
66 [X] MSI GP65 Leopard 9SF Intel Core i7-9750H 2.6GHz
GeForce RTX 2070 Mobile
min:
55 fps
fps
100%
GeForce RTX 2060 (Desktop):
41.4 [X] MSI GeForce RTX 2060 Intel Core i9-9900K 3.6GHz
GeForce RTX 2060 (Desktop)
min:
30 fps
fps
96%
GeForce RTX 2070 Super Max-Q:
39.7 fps
95%
GeForce RTX 2070 Mobile:
39.3 [X] MSI GP65 Leopard 9SF Intel Core i7-9750H 2.6GHz
GeForce RTX 2070 Mobile
min:
34 fps
fps
100%
GeForce RTX 2060 (Desktop):
155 [X] MSI GeForce RTX 2060 Intel Core i9-9900K 3.6GHz
GeForce RTX 2060 (Desktop)
min:
59 fps
fps
79%
GeForce RTX 2070 Mobile:
122 [X] MSI GP65 Leopard 9SF Intel Core i7-9750H 2.6GHz
GeForce RTX 2070 Mobile
min:
59 fps
fps
100%
GeForce RTX 2060 (Desktop):
106 [X] MSI GeForce RTX 2060 Intel Core i9-9900K 3.6GHz
GeForce RTX 2060 (Desktop)
min:
60 fps
fps
95%
GeForce RTX 2070 Super Max-Q:
101 fps
100%
GeForce RTX 2070 Mobile:
106 [X] MSI GP65 Leopard 9SF Intel Core i7-9750H 2.6GHz
GeForce RTX 2070 Mobile
min:
58 fps
fps
100%
GeForce RTX 2060 (Desktop):
96 [X] MSI GeForce RTX 2060 Intel Core i9-9900K 3.6GHz
GeForce RTX 2060 (Desktop)
min:
58 fps
fps
95%
GeForce RTX 2070 Super Max-Q:
89 92 ~ 91 fps
98%
GeForce RTX 2070 Mobile:
89 98 [X] MSI GP65 Leopard 9SF Intel Core i7-9750H 2.6GHz
GeForce RTX 2070 Mobile
min:
58 fps
~ 94 fps
100%
GeForce RTX 2060 (Desktop):
71 [X] MSI GeForce RTX 2060 Intel Core i9-9900K 3.6GHz
GeForce RTX 2060 (Desktop)
min:
54 fps
fps
96%
GeForce RTX 2070 Super Max-Q:
66 69 ~ 68 fps
97%
GeForce RTX 2070 Mobile:
67 71 [X] MSI GP65 Leopard 9SF Intel Core i7-9750H 2.6GHz
GeForce RTX 2070 Mobile
min:
54 fps
~ 69 fps
100%
GeForce RTX 2060 (Desktop):
51 [X] MSI GeForce RTX 2060 Intel Core i9-9900K 3.6GHz
GeForce RTX 2060 (Desktop)
min:
40 fps
fps
98%
GeForce RTX 2070 Super Max-Q:
49 50 ~ 50 fps
102%
GeForce RTX 2070 Mobile:
52 [X] MSI GP65 Leopard 9SF Intel Core i7-9750H 2.6GHz
GeForce RTX 2070 Mobile
min:
41 fps
fps
100%
GeForce RTX 2060 (Desktop):
28 [X] MSI GeForce RTX 2060 Intel Core i9-9900K 3.6GHz
GeForce RTX 2060 (Desktop)
min:
23 fps
fps
104%
GeForce RTX 2070 Super Max-Q:
28 29 ~ 29 fps
104%
GeForce RTX 2070 Mobile:
29 [X] MSI GP65 Leopard 9SF Intel Core i7-9750H 2.6GHz
GeForce RTX 2070 Mobile
min:
23 fps
fps
100%
GeForce RTX 2060 (Desktop):
290 [X] MSI GeForce RTX 2060 Intel Core i9-9900K 3.6GHz
GeForce RTX 2060 (Desktop)
min:
227 fps
fps
91%
GeForce RTX 2070 Mobile:
265 [X] MSI GP65 Leopard 9SF Intel Core i7-9750H 2.6GHz
GeForce RTX 2070 Mobile
min:
217 fps
fps
100%
GeForce RTX 2060 (Desktop):
289 [X] MSI GeForce RTX 2060 Intel Core i9-9900K 3.6GHz
GeForce RTX 2060 (Desktop)
min:
222 fps
fps
94%
GeForce RTX 2070 Super Max-Q:
271 fps
90%
GeForce RTX 2070 Mobile:
260 [X] MSI GP65 Leopard 9SF Intel Core i7-9750H 2.6GHz
GeForce RTX 2070 Mobile
min:
213 fps
fps
100%
GeForce RTX 2060 (Desktop):
269 [X] MSI GeForce RTX 2060 Intel Core i9-9900K 3.6GHz
GeForce RTX 2060 (Desktop)
min:
208 fps
fps
85%
GeForce RTX 2070 Super Max-Q:
196 259 ~ 228 fps
80%
GeForce RTX 2070 Mobile:
190 240 [X] MSI GP65 Leopard 9SF Intel Core i7-9750H 2.6GHz
GeForce RTX 2070 Mobile
min:
196 fps
~ 215 fps
100%
GeForce RTX 2060 (Desktop):
267 [X] MSI GeForce RTX 2060 Intel Core i9-9900K 3.6GHz
GeForce RTX 2060 (Desktop)
min:
207 fps
fps
84%
GeForce RTX 2070 Super Max-Q:
190 257 ~ 224 fps
80%
GeForce RTX 2070 Mobile:
189 238 [X] MSI GP65 Leopard 9SF Intel Core i7-9750H 2.6GHz
GeForce RTX 2070 Mobile
min:
192 fps
~ 214 fps
100%
GeForce RTX 2060 (Desktop):
254 [X] MSI GeForce RTX 2060 Intel Core i9-9900K 3.6GHz
GeForce RTX 2060 (Desktop)
min:
196 fps
fps
100%
GeForce RTX 2070 Super Max-Q:
253 fps
91%
GeForce RTX 2070 Mobile:
231 [X] MSI GP65 Leopard 9SF Intel Core i7-9750H 2.6GHz
GeForce RTX 2070 Mobile
min:
189 fps
fps
100%
GeForce RTX 2060 (Desktop):
179 [X] MSI GeForce RTX 2060 Intel Core i9-9900K 3.6GHz
GeForce RTX 2060 (Desktop)
min:
143 fps
fps
104%
GeForce RTX 2070 Super Max-Q:
186 fps
100%
GeForce RTX 2070 Mobile:
179 [X] MSI GP65 Leopard 9SF Intel Core i7-9750H 2.6GHz
GeForce RTX 2070 Mobile
min:
147 fps
fps
100%
GeForce RTX 2060 (Desktop):
139 [X] MSI GeForce RTX 2060 Intel Core i9-9900K 3.6GHz
GeForce RTX 2060 (Desktop)
fps
79%
GeForce RTX 2070 Mobile:
94 125 [X] MSI GP65 Leopard 9SF Intel Core i7-9750H 2.6GHz
GeForce RTX 2070 Mobile
~ 110 fps
100%
GeForce RTX 2060 (Desktop):
116 [X] MSI GeForce RTX 2060 Intel Core i9-9900K 3.6GHz
GeForce RTX 2060 (Desktop)
fps
97%
GeForce RTX 2070 Super Max-Q:
112 fps
84%
GeForce RTX 2070 Mobile:
84 110 [X] MSI GP65 Leopard 9SF Intel Core i7-9750H 2.6GHz
GeForce RTX 2070 Mobile
~ 97 fps
100%
GeForce RTX 2060 (Desktop):
82.8 [X] MSI GeForce RTX 2060 Intel Core i9-9900K 3.6GHz
GeForce RTX 2060 (Desktop)
fps
94%
GeForce RTX 2070 Mobile:
71 81.4 83 [X] MSI GP65 Leopard 9SF Intel Core i7-9750H 2.6GHz
GeForce RTX 2070 Mobile
~ 78 fps
100%
GeForce RTX 2060 (Desktop):
64 [X] MSI GeForce RTX 2060 Intel Core i9-9900K 3.6GHz
GeForce RTX 2060 (Desktop)
fps
98%
GeForce RTX 2070 Mobile:
61 63.3 64.5 [X] MSI GP65 Leopard 9SF Intel Core i7-9750H 2.6GHz
GeForce RTX 2070 Mobile
~ 63 fps
100%
GeForce RTX 2060 (Desktop):
44.1 [X] MSI GeForce RTX 2060 Intel Core i9-9900K 3.6GHz
GeForce RTX 2060 (Desktop)
fps
100%
GeForce RTX 2070 Super Max-Q:
41.7 45.6 ~ 44 fps
102%
GeForce RTX 2070 Mobile:
45.1 [X] MSI GP65 Leopard 9SF Intel Core i7-9750H 2.6GHz
GeForce RTX 2070 Mobile
fps
100%
GeForce RTX 2060 (Desktop):
19.5 [X] MSI GeForce RTX 2060 Intel Core i9-9900K 3.6GHz
GeForce RTX 2060 (Desktop)
fps
118%
GeForce RTX 2070 Super Max-Q:
22.2 24.5 ~ 23 fps
124%
GeForce RTX 2070 Mobile:
24.2 [X] MSI GP65 Leopard 9SF Intel Core i7-9750H 2.6GHz
GeForce RTX 2070 Mobile
fps
100%
GeForce RTX 2060 (Desktop):
237 [X] MSI GeForce RTX 2060 Intel Core i9-9900K 3.6GHz
GeForce RTX 2060 (Desktop)
min:
217 fps
fps
78%
GeForce RTX 2070 Mobile:
152 180 222 [X] MSI GP65 Leopard 9SF Intel Core i7-9750H 2.6GHz
GeForce RTX 2070 Mobile
min:
198 fps
~ 185 fps
100%
GeForce RTX 2060 (Desktop):
96.2 [X] MSI GeForce RTX 2060 Intel Core i9-9900K 3.6GHz
GeForce RTX 2060 (Desktop)
min:
84 fps
fps
96%
GeForce RTX 2070 Super Max-Q:
92.6 fps
97%
GeForce RTX 2070 Mobile:
90 93 97.3 [X] MSI GP65 Leopard 9SF Intel Core i7-9750H 2.6GHz
GeForce RTX 2070 Mobile
min:
86 fps
~ 93 fps
100%
GeForce RTX 2060 (Desktop):
72.7 [X] MSI GeForce RTX 2060 Intel Core i9-9900K 3.6GHz
GeForce RTX 2060 (Desktop)
min:
64 fps
fps
88%
GeForce RTX 2070 Super Max-Q:
60.2 68.4 ~ 64 fps
95%
GeForce RTX 2070 Mobile:
68 68 72.3 [X] MSI GP65 Leopard 9SF Intel Core i7-9750H 2.6GHz
GeForce RTX 2070 Mobile
min:
63 fps
~ 69 fps
100%
GeForce RTX 2060 (Desktop):
47 [X] MSI GeForce RTX 2060 Intel Core i9-9900K 3.6GHz
GeForce RTX 2060 (Desktop)
min:
40 fps
fps
89%
GeForce RTX 2070 Super Max-Q:
40.6 43.9 ~ 42 fps
100%
GeForce RTX 2070 Mobile:
46.9 [X] MSI GP65 Leopard 9SF Intel Core i7-9750H 2.6GHz
GeForce RTX 2070 Mobile
min:
41 fps
fps
100%
GeForce RTX 2060 (Desktop):
22.7 [X] MSI GeForce RTX 2060 Intel Core i9-9900K 3.6GHz
GeForce RTX 2060 (Desktop)
min:
19 fps
fps
97%
GeForce RTX 2070 Super Max-Q:
21.1 23.8 ~ 22 fps
101%
GeForce RTX 2070 Mobile:
23 [X] MSI GP65 Leopard 9SF Intel Core i7-9750H 2.6GHz
GeForce RTX 2070 Mobile
min:
20 fps
fps
100%
GeForce RTX 2060 (Desktop):
222 [X] MSI GeForce RTX 2060 Intel Core i9-9900K 3.6GHz
GeForce RTX 2060 (Desktop)
min:
174 fps
fps
96%
GeForce RTX 2070 Mobile:
198 229 [X] MSI GP65 Leopard 9SF Intel Core i7-9750H 2.6GHz
GeForce RTX 2070 Mobile
min:
178 fps
~ 214 fps
100%
GeForce RTX 2060 (Desktop):
204 [X] MSI GeForce RTX 2060 Intel Core i9-9900K 3.6GHz
GeForce RTX 2060 (Desktop)
min:
164 fps
fps
94%
GeForce RTX 2070 Super Max-Q:
191 fps
89%
GeForce RTX 2070 Mobile:
168 195 [X] MSI GP65 Leopard 9SF Intel Core i7-9750H 2.6GHz
GeForce RTX 2070 Mobile
min:
159 fps
~ 182 fps
100%
GeForce RTX 2060 (Desktop):
154 [X] MSI GeForce RTX 2060 Intel Core i9-9900K 3.6GHz
GeForce RTX 2060 (Desktop)
min:
130 fps
fps
101%
GeForce RTX 2070 Super Max-Q:
152 [X] Aorus 17G XB Intel Core i7-10875H 2.3GHz
GeForce RTX 2070 Super Max-Q
min:
131 fps
159 ~ 156 fps
98%
GeForce RTX 2070 Mobile:
139 162 [X] MSI GP65 Leopard 9SF Intel Core i7-9750H 2.6GHz
GeForce RTX 2070 Mobile
min:
135 fps
~ 151 fps
100%
GeForce RTX 2060 (Desktop):
127 [X] MSI GeForce RTX 2060 Intel Core i9-9900K 3.6GHz
GeForce RTX 2060 (Desktop)
min:
121 fps
fps
112%
GeForce RTX 2070 Super Max-Q:
141 [X] Aorus 17G XB Intel Core i7-10875H 2.3GHz
GeForce RTX 2070 Super Max-Q
min:
123 fps
143 ~ 142 fps
86%
GeForce RTX 2070 Mobile:
95 123 [X] MSI GP65 Leopard 9SF Intel Core i7-9750H 2.6GHz
GeForce RTX 2070 Mobile
min:
112 fps
~ 109 fps
100%
GeForce RTX 2060 (Desktop):
99 [X] MSI GeForce RTX 2060 Intel Core i9-9900K 3.6GHz
GeForce RTX 2060 (Desktop)
min:
91 fps
fps
108%
GeForce RTX 2070 Super Max-Q:
107 fps
91%
GeForce RTX 2070 Mobile:
90 [X] MSI GP65 Leopard 9SF Intel Core i7-9750H 2.6GHz
GeForce RTX 2070 Mobile
min:
72 fps
fps
100%
GeForce RTX 2060 (Desktop):
55 [X] MSI GeForce RTX 2060 Intel Core i9-9900K 3.6GHz
GeForce RTX 2060 (Desktop)
min:
51 fps
fps
111%
GeForce RTX 2070 Super Max-Q:
61 fps
105%
GeForce RTX 2070 Mobile:
58 [X] MSI GP65 Leopard 9SF Intel Core i7-9750H 2.6GHz
GeForce RTX 2070 Mobile
min:
53 fps
fps
GeForce RTX 2070 Super Max-Q:
255.2 [X] Aorus 15G XB Intel Core i7-10875H 2.3GHz
GeForce RTX 2070 Super Max-Q
min:
186 fps, max:
332 fps
260.9 ~ 258 fps
GeForce RTX 2070 Mobile:
232.7 [X] MSI GL75 10SFR Intel Core i7-10750H 2.6GHz
GeForce RTX 2070 Mobile
min:
178 fps, max:
312 fps
fps
GeForce RTX 2070 Super Max-Q:
122.8 [X] Aorus 15G XB Intel Core i7-10875H 2.3GHz
GeForce RTX 2070 Super Max-Q
min:
99 fps, max:
149 fps
141.2 ~ 132 fps
GeForce RTX 2070 Mobile:
129.9 [X] MSI GL75 10SFR Intel Core i7-10750H 2.6GHz
GeForce RTX 2070 Mobile
min:
105 fps, max:
166 fps
fps
GeForce RTX 2070 Super Max-Q:
77.6 [X] Aorus 15G XB Intel Core i7-10875H 2.3GHz
GeForce RTX 2070 Super Max-Q
min:
59 fps, max:
95 fps
97.5 ~ 88 fps
GeForce RTX 2070 Mobile:
88.5 [X] MSI GL75 10SFR Intel Core i7-10750H 2.6GHz
GeForce RTX 2070 Mobile
min:
70 fps, max:
107 fps
fps
GeForce RTX 2070 Super Max-Q:
54.8 [X] Aorus 15G XB Intel Core i7-10875H 2.3GHz
GeForce RTX 2070 Super Max-Q
min:
43 fps, max:
67 fps
68.7 ~ 62 fps
GeForce RTX 2070 Mobile:
63.1 [X] MSI GL75 10SFR Intel Core i7-10750H 2.6GHz
GeForce RTX 2070 Mobile
min:
51 fps, max:
76 fps
fps
100%
GeForce RTX 2060 (Desktop):
211 [X] AMD Ryzen 7 2700X 3.7GHz
GeForce RTX 2060 (Desktop)
P1:
81.4 fps
fps
85%
GeForce RTX 2070 Mobile:
180 fps
100%
GeForce RTX 2060 (Desktop):
110 [X] AMD Ryzen 7 2700X 3.7GHz
GeForce RTX 2060 (Desktop)
P1:
60.4 fps
fps
108%
GeForce RTX 2070 Super Max-Q:
119 fps
111%
GeForce RTX 2070 Mobile:
122 fps
100%
GeForce RTX 2060 (Desktop):
98 [X] AMD Ryzen 7 2700X 3.7GHz
GeForce RTX 2060 (Desktop)
P1:
49.3 fps
fps
101%
GeForce RTX 2070 Super Max-Q:
97.5 99.5 ~ 99 fps
105%
GeForce RTX 2070 Mobile:
103 103 ~ 103 fps
100%
GeForce RTX 2060 (Desktop):
94 [X] AMD Ryzen 7 2700X 3.7GHz
GeForce RTX 2060 (Desktop)
P1:
47.1 fps
fps
102%
GeForce RTX 2070 Super Max-Q:
94.9 97.1 ~ 96 fps
107%
GeForce RTX 2070 Mobile:
100 101 ~ 101 fps
100%
GeForce RTX 2060 (Desktop):
64 [X] AMD Ryzen 7 2700X 3.7GHz
GeForce RTX 2060 (Desktop)
P1:
51.8 fps
fps
98%
GeForce RTX 2070 Super Max-Q:
62.8 fps
100%
GeForce RTX 2060 (Desktop):
29.8 [X] AMD Ryzen 7 2700X 3.7GHz
GeForce RTX 2060 (Desktop)
P1:
23.8 fps
fps
101%
GeForce RTX 2070 Super Max-Q:
30.1 fps
100%
GeForce RTX 2060 (Desktop):
87 [X] AMD Ryzen 7 2700X 3.7GHz
GeForce RTX 2060 (Desktop)
min:
80 fps, max:
99 fps
fps
100%
GeForce RTX 2060 (Desktop):
87 [X] AMD Ryzen 7 2700X 3.7GHz
GeForce RTX 2060 (Desktop)
min:
80 fps, max:
96 fps
fps
129%
GeForce RTX 2070 Super Max-Q:
112 fps
100%
GeForce RTX 2060 (Desktop):
72 [X] AMD Ryzen 7 2700X 3.7GHz
GeForce RTX 2060 (Desktop)
min:
66 fps, max:
81 fps
fps
118%
GeForce RTX 2070 Super Max-Q:
84.2 85.5 ~ 85 fps
101%
GeForce RTX 2070 Mobile:
68.5 76.8 ~ 73 fps
100%
GeForce RTX 2060 (Desktop):
40.3 [X] AMD Ryzen 7 2700X 3.7GHz
GeForce RTX 2060 (Desktop)
min:
36 fps, max:
46 fps
fps
117%
GeForce RTX 2070 Super Max-Q:
46.8 47.4 ~ 47 fps
99%
GeForce RTX 2070 Mobile:
39.5 41.1 ~ 40 fps
100%
GeForce RTX 2060 (Desktop):
34 [X] AMD Ryzen 7 2700X 3.7GHz
GeForce RTX 2060 (Desktop)
min:
27 fps, max:
38 fps
fps
109%
GeForce RTX 2070 Super Max-Q:
36.6 37 ~ 37 fps
100%
GeForce RTX 2060 (Desktop):
19.8 [X] AMD Ryzen 7 2700X 3.7GHz
GeForce RTX 2060 (Desktop)
min:
16 fps, max:
23 fps
fps
106%
GeForce RTX 2070 Super Max-Q:
21.1 21.5 ~ 21 fps
100%
GeForce RTX 2060 (Desktop):
178 [X] AMD Ryzen 7 2700X 3.7GHz
GeForce RTX 2060 (Desktop)
fps
68%
GeForce RTX 2070 Mobile:
121 fps
100%
GeForce RTX 2060 (Desktop):
135 [X] AMD Ryzen 7 2700X 3.7GHz
GeForce RTX 2060 (Desktop)
fps
91%
GeForce RTX 2070 Super Max-Q:
123 fps
83%
GeForce RTX 2070 Mobile:
111 113 ~ 112 fps
100%
GeForce RTX 2060 (Desktop):
108 [X] AMD Ryzen 7 2700X 3.7GHz
GeForce RTX 2060 (Desktop)
fps
101%
GeForce RTX 2070 Super Max-Q:
105 113 ~ 109 fps
89%
GeForce RTX 2070 Mobile:
94 95 98 ~ 96 fps
100%
GeForce RTX 2060 (Desktop):
85 [X] AMD Ryzen 7 2700X 3.7GHz
GeForce RTX 2060 (Desktop)
fps
93%
GeForce RTX 2070 Super Max-Q:
77 81 ~ 79 fps
91%
GeForce RTX 2070 Mobile:
73 78 79 ~ 77 fps
100%
GeForce RTX 2060 (Desktop):
60 [X] AMD Ryzen 7 2700X 3.7GHz
GeForce RTX 2060 (Desktop)
fps
95%
GeForce RTX 2070 Super Max-Q:
54 60 ~ 57 fps
100%
GeForce RTX 2070 Mobile:
60 fps
100%
GeForce RTX 2060 (Desktop):
33 [X] AMD Ryzen 7 2700X 3.7GHz
GeForce RTX 2060 (Desktop)
fps
88%
GeForce RTX 2070 Super Max-Q:
29 29 ~ 29 fps
100%
GeForce RTX 2070 Mobile:
33 fps
100%
GeForce RTX 2060 (Desktop):
229.3 [X] AMD Ryzen 7 2700X 3.7GHz
GeForce RTX 2060 (Desktop)
min:
218 fps, max:
240 fps
fps
100%
GeForce RTX 2060 (Desktop):
152.4 [X] AMD Ryzen 7 2700X 3.7GHz
GeForce RTX 2060 (Desktop)
min:
134 fps, max:
163 fps
fps
120%
GeForce RTX 2070 Super Max-Q:
183 fps
94%
GeForce RTX 2070 Mobile:
143 fps
100%
GeForce RTX 2060 (Desktop):
138.2 [X] AMD Ryzen 7 2700X 3.7GHz
GeForce RTX 2060 (Desktop)
min:
125 fps, max:
155 fps
fps
111%
GeForce RTX 2070 Super Max-Q:
151 [X] Aorus 17G XB Intel Core i7-10875H 2.3GHz
GeForce RTX 2070 Super Max-Q
min:
132 fps
155 ~ 153 fps
86%
GeForce RTX 2070 Mobile:
117 121 ~ 119 fps
100%
GeForce RTX 2060 (Desktop):
84.4 [X] AMD Ryzen 7 2700X 3.7GHz
GeForce RTX 2060 (Desktop)
min:
77 fps, max:
93 fps
fps
102%
GeForce RTX 2070 Super Max-Q:
85.8 86.9 [X] Aorus 17G XB Intel Core i7-10875H 2.3GHz
GeForce RTX 2070 Super Max-Q
min:
72 fps
~ 86 fps
89%
GeForce RTX 2070 Mobile:
75 75.2 ~ 75 fps
100%
GeForce RTX 2060 (Desktop):
64.9 [X] AMD Ryzen 7 2700X 3.7GHz
GeForce RTX 2060 (Desktop)
min:
60 fps, max:
72 fps
fps
102%
GeForce RTX 2070 Super Max-Q:
66 fps
96%
GeForce RTX 2070 Mobile:
62.1 fps
100%
GeForce RTX 2060 (Desktop):
39.9 [X] AMD Ryzen 7 2700X 3.7GHz
GeForce RTX 2060 (Desktop)
min:
37 fps, max:
44 fps
fps
100%
GeForce RTX 2060 (Desktop):
114 [X] AMD Ryzen 7 2700X 3.7GHz
GeForce RTX 2060 (Desktop)
min:
88 fps, max:
146 fps
fps
100%
GeForce RTX 2060 (Desktop):
103 [X] AMD Ryzen 7 2700X 3.7GHz
GeForce RTX 2060 (Desktop)
min:
80 fps, max:
136 fps
fps
86%
GeForce RTX 2070 Mobile:
88.8 fps
100%
GeForce RTX 2060 (Desktop):
95 [X] AMD Ryzen 7 2700X 3.7GHz
GeForce RTX 2060 (Desktop)
min:
66 fps, max:
119 fps
fps
89%
GeForce RTX 2070 Mobile:
84 85.4 ~ 85 fps
100%
GeForce RTX 2060 (Desktop):
88 [X] AMD Ryzen 7 2700X 3.7GHz
GeForce RTX 2060 (Desktop)
min:
56 fps, max:
109 fps
fps
90%
GeForce RTX 2070 Mobile:
79 79.8 ~ 79 fps
100%
GeForce RTX 2060 (Desktop):
66 [X] AMD Ryzen 7 2700X 3.7GHz
GeForce RTX 2060 (Desktop)
min:
57 fps, max:
79 fps
fps
94%
GeForce RTX 2070 Mobile:
62 fps
100%
GeForce RTX 2060 (Desktop):
34.6 [X] AMD Ryzen 7 2700X 3.7GHz
GeForce RTX 2060 (Desktop)
min:
29 fps, max:
40 fps
fps
103%
GeForce RTX 2070 Mobile:
35.5 fps
100%
GeForce RTX 2060 (Desktop):
116 [X] AMD Ryzen 7 2700X 3.7GHz
GeForce RTX 2060 (Desktop)
min:
82 fps, max:
168 fps
fps
100%
GeForce RTX 2060 (Desktop):
101 [X] AMD Ryzen 7 2700X 3.7GHz
GeForce RTX 2060 (Desktop)
min:
82 fps, max:
137 fps
fps
97%
GeForce RTX 2070 Super Max-Q:
98 fps
93%
GeForce RTX 2070 Mobile:
94 fps
100%
GeForce RTX 2060 (Desktop):
97 [X] AMD Ryzen 7 2700X 3.7GHz
GeForce RTX 2060 (Desktop)
min:
80 fps, max:
131 fps
fps
104%
GeForce RTX 2070 Super Max-Q:
92 110 ~ 101 fps
95%
GeForce RTX 2070 Mobile:
91 92 ~ 92 fps
100%
GeForce RTX 2060 (Desktop):
88 [X] AMD Ryzen 7 2700X 3.7GHz
GeForce RTX 2060 (Desktop)
min:
66 fps, max:
125 fps
fps
103%
GeForce RTX 2070 Super Max-Q:
83 98 ~ 91 fps
94%
GeForce RTX 2070 Mobile:
82 83 ~ 83 fps
100%
GeForce RTX 2060 (Desktop):
76 [X] AMD Ryzen 7 2700X 3.7GHz
GeForce RTX 2060 (Desktop)
min:
61 fps, max:
95 fps
fps
99%
GeForce RTX 2070 Super Max-Q:
70 80 ~ 75 fps
97%
GeForce RTX 2070 Mobile:
74 fps
100%
GeForce RTX 2060 (Desktop):
42 [X] AMD Ryzen 7 2700X 3.7GHz
GeForce RTX 2060 (Desktop)
min:
35 fps, max:
52 fps
fps
105%
GeForce RTX 2070 Super Max-Q:
43 45 ~ 44 fps
100%
GeForce RTX 2070 Mobile:
42 fps
100%
GeForce RTX 2060 (Desktop):
127.8 [X] AMD Ryzen 7 2700X 3.7GHz
GeForce RTX 2060 (Desktop)
min:
72 fps, max:
189 fps
fps
74%
GeForce RTX 2070 Mobile:
91.1 98 ~ 95 fps
100%
GeForce RTX 2060 (Desktop):
85.4 [X] AMD Ryzen 7 2700X 3.7GHz
GeForce RTX 2060 (Desktop)
min:
41 fps, max:
145 fps
fps
108%
GeForce RTX 2070 Super Max-Q:
92 fps
101%
GeForce RTX 2070 Mobile:
82.6 87 87.9 ~ 86 fps
100%
GeForce RTX 2060 (Desktop):
63.9 [X] AMD Ryzen 7 2700X 3.7GHz
GeForce RTX 2060 (Desktop)
min:
33 fps, max:
104 fps
fps
116%
GeForce RTX 2070 Super Max-Q:
72 75.4 ~ 74 fps
103%
GeForce RTX 2070 Mobile:
66 66.3 66.4 ~ 66 fps
100%
GeForce RTX 2060 (Desktop):
52.7 [X] AMD Ryzen 7 2700X 3.7GHz
GeForce RTX 2060 (Desktop)
min:
29 fps, max:
82 fps
fps
112%
GeForce RTX 2070 Super Max-Q:
57.7 60.4 ~ 59 fps
102%
GeForce RTX 2070 Mobile:
53.3 53.4 [X] Asus ROG Strix SCAR III G531GW-AZ062T Intel Core i7-9750H 2.6GHz
GeForce RTX 2070 Mobile
54.1 54.3 [X] Asus ROG Zephyrus S GX502GW Intel Core i7-9750H 2.6GHz
GeForce RTX 2070 Mobile
54.6 ~ 54 fps
100%
GeForce RTX 2060 (Desktop):
41.5 [X] AMD Ryzen 7 2700X 3.7GHz
GeForce RTX 2060 (Desktop)
min:
25 fps, max:
61 fps
fps
116%
GeForce RTX 2070 Super Max-Q:
46.7 49.1 ~ 48 fps
101%
GeForce RTX 2070 Mobile:
42 fps
100%
GeForce RTX 2060 (Desktop):
26.3 [X] AMD Ryzen 7 2700X 3.7GHz
GeForce RTX 2060 (Desktop)
min:
17 fps, max:
38 fps
fps
106%
GeForce RTX 2070 Super Max-Q:
26.5 29.1 ~ 28 fps
99%
GeForce RTX 2070 Mobile:
26.1 fps
100%
GeForce RTX 2060 (Desktop):
144 [X] AMD Ryzen 7 2700X 3.7GHz
GeForce RTX 2060 (Desktop)
min:
143 fps, max:
145 fps
fps
100%
GeForce RTX 2060 (Desktop):
144 [X] AMD Ryzen 7 2700X 3.7GHz
GeForce RTX 2060 (Desktop)
min:
143 fps, max:
145 fps
fps
100%
GeForce RTX 2070 Super Max-Q:
144 fps
99%
GeForce RTX 2070 Mobile:
143 fps
100%
GeForce RTX 2060 (Desktop):
141 [X] AMD Ryzen 7 2700X 3.7GHz
GeForce RTX 2060 (Desktop)
min:
135 fps, max:
145 fps
fps
101%
GeForce RTX 2070 Super Max-Q:
140 144 ~ 142 fps
93%
GeForce RTX 2070 Mobile:
128 134 ~ 131 fps
100%
GeForce RTX 2060 (Desktop):
139 [X] AMD Ryzen 7 2700X 3.7GHz
GeForce RTX 2060 (Desktop)
min:
126 fps, max:
145 fps
fps
101%
GeForce RTX 2070 Super Max-Q:
139 143 ~ 141 fps
93%
GeForce RTX 2070 Mobile:
126 132 ~ 129 fps
100%
GeForce RTX 2060 (Desktop):
98 [X] AMD Ryzen 7 2700X 3.7GHz
GeForce RTX 2060 (Desktop)
min:
91 fps, max:
110 fps
fps
111%
GeForce RTX 2070 Super Max-Q:
109 fps
90%
GeForce RTX 2070 Mobile:
88.2 fps
100%
GeForce RTX 2060 (Desktop):
52 [X] AMD Ryzen 7 2700X 3.7GHz
GeForce RTX 2060 (Desktop)
min:
48 fps, max:
60 fps
fps
118%
GeForce RTX 2070 Super Max-Q:
61.1 fps
87%
GeForce RTX 2070 Mobile:
45.4 fps
100%
GeForce RTX 2060 (Desktop):
174 [X] AMD Ryzen 7 2700X 3.7GHz
GeForce RTX 2060 (Desktop)
min:
162 fps, max:
184 fps
fps
97%
GeForce RTX 2070 Mobile:
169.5 fps
100%
GeForce RTX 2060 (Desktop):
128 [X] AMD Ryzen 7 2700X 3.7GHz
GeForce RTX 2060 (Desktop)
min:
118 fps, max:
138 fps
fps
107%
GeForce RTX 2070 Super Max-Q:
137 fps
99%
GeForce RTX 2070 Mobile:
124 [X] Schenker XMG Ultra 15 Intel Core i7-9700K 3.6GHz
GeForce RTX 2070 Mobile
min:
114 fps
129.3 ~ 127 fps
100%
GeForce RTX 2060 (Desktop):
96 [X] AMD Ryzen 7 2700X 3.7GHz
GeForce RTX 2060 (Desktop)
min:
90 fps, max:
102 fps
fps
105%
GeForce RTX 2070 Super Max-Q:
101 fps
101%
GeForce RTX 2070 Mobile:
96.1 97.1 [X] Schenker XMG Ultra 15 Intel Core i7-9700K 3.6GHz
GeForce RTX 2070 Mobile
min:
91 fps
~ 97 fps
100%
GeForce RTX 2060 (Desktop):
93 [X] AMD Ryzen 7 2700X 3.7GHz
GeForce RTX 2060 (Desktop)
min:
86 fps, max:
103 fps
fps
100%
GeForce RTX 2070 Super Max-Q:
93.4 fps
97%
GeForce RTX 2070 Mobile:
88.6 [X] Schenker XMG Ultra 15 Intel Core i7-9700K 3.6GHz
GeForce RTX 2070 Mobile
min:
82 fps
91.3 ~ 90 fps
GeForce RTX 2070 Super Max-Q:
63.6 fps
GeForce RTX 2070 Mobile:
63.6 [X] Schenker XMG Ultra 15 Intel Core i7-9700K 3.6GHz
GeForce RTX 2070 Mobile
min:
59 fps
fps
100%
GeForce RTX 2060 (Desktop):
37.4 [X] AMD Ryzen 7 2700X 3.7GHz
GeForce RTX 2060 (Desktop)
min:
30 fps, max:
41 fps
fps
92%
GeForce RTX 2070 Super Max-Q:
34.5 fps
97%
GeForce RTX 2070 Mobile:
36.3 [X] Schenker XMG Ultra 15 Intel Core i7-9700K 3.6GHz
GeForce RTX 2070 Mobile
min:
33 fps
fps
100%
GeForce RTX 2060 (Desktop):
226 [X] AMD Ryzen 7 2700X 3.7GHz
GeForce RTX 2060 (Desktop)
min:
97 fps, max:
300 fps
fps
75%
GeForce RTX 2070 Mobile:
169.2 fps
100%
GeForce RTX 2060 (Desktop):
142 [X] AMD Ryzen 7 2700X 3.7GHz
GeForce RTX 2060 (Desktop)
min:
77 fps, max:
174 fps
fps
95%
GeForce RTX 2070 Super Max-Q:
135 fps
86%
GeForce RTX 2070 Mobile:
102.4 142 [X] Schenker XMG Ultra 15 Intel Core i7-9700K 3.6GHz
GeForce RTX 2070 Mobile
min:
112 fps
~ 122 fps
100%
GeForce RTX 2060 (Desktop):
127 [X] AMD Ryzen 7 2700X 3.7GHz
GeForce RTX 2060 (Desktop)
min:
73 fps, max:
146 fps
fps
93%
GeForce RTX 2070 Super Max-Q:
118 fps
86%
GeForce RTX 2070 Mobile:
98.5 119 [X] Schenker XMG Ultra 15 Intel Core i7-9700K 3.6GHz
GeForce RTX 2070 Mobile
min:
100 fps
~ 109 fps
100%
GeForce RTX 2060 (Desktop):
110 [X] AMD Ryzen 7 2700X 3.7GHz
GeForce RTX 2060 (Desktop)
min:
71 fps, max:
125 fps
fps
97%
GeForce RTX 2070 Super Max-Q:
107 fps
92%
GeForce RTX 2070 Mobile:
94.7 108 [X] Schenker XMG Ultra 15 Intel Core i7-9700K 3.6GHz
GeForce RTX 2070 Mobile
min:
91 fps
~ 101 fps
GeForce RTX 2070 Super Max-Q:
71.6 fps
GeForce RTX 2070 Mobile:
76.7 [X] Schenker XMG Ultra 15 Intel Core i7-9700K 3.6GHz
GeForce RTX 2070 Mobile
min:
67 fps
fps
100%
GeForce RTX 2060 (Desktop):
34.9 [X] AMD Ryzen 7 2700X 3.7GHz
GeForce RTX 2060 (Desktop)
min:
31 fps, max:
40 fps
fps
104%
GeForce RTX 2070 Super Max-Q:
36.4 fps
108%
GeForce RTX 2070 Mobile:
37.8 [X] Schenker XMG Ultra 15 Intel Core i7-9700K 3.6GHz
GeForce RTX 2070 Mobile
min:
33 fps
fps
100%
GeForce RTX 2060 (Desktop):
169 [X] AMD Ryzen 7 2700X 3.7GHz
GeForce RTX 2060 (Desktop)
fps
66%
GeForce RTX 2070 Mobile:
111.6 fps
100%
GeForce RTX 2060 (Desktop):
145 [X] AMD Ryzen 7 2700X 3.7GHz
GeForce RTX 2060 (Desktop)
min:
113 fps, max:
178 fps
fps
99%
GeForce RTX 2070 Super Max-Q:
144 fps
83%
GeForce RTX 2070 Mobile:
86 153 [X] Schenker XMG Ultra 15 Intel Core i7-9700K 3.6GHz
GeForce RTX 2070 Mobile
min:
118 fps
~ 120 fps
100%
GeForce RTX 2060 (Desktop):
129 [X] AMD Ryzen 7 2700X 3.7GHz
GeForce RTX 2060 (Desktop)
min:
100 fps, max:
177 fps
fps
103%
GeForce RTX 2070 Super Max-Q:
121 135 136 [X] Aorus 17G XB Intel Core i7-10875H 2.3GHz
GeForce RTX 2070 Super Max-Q
min:
110 fps
139 ~ 133 fps
90%
GeForce RTX 2070 Mobile:
77.7 134 [X] Schenker XMG Ultra 15 Intel Core i7-9700K 3.6GHz
GeForce RTX 2070 Mobile
min:
108 fps
136 ~ 116 fps
100%
GeForce RTX 2060 (Desktop):
119.1 [X] AMD Ryzen 7 2700X 3.7GHz
GeForce RTX 2060 (Desktop)
min:
94 fps, max:
167 fps
fps
104%
GeForce RTX 2070 Super Max-Q:
113 125 126 [X] Aorus 17G XB Intel Core i7-10875H 2.3GHz
GeForce RTX 2070 Super Max-Q
min:
94 fps
130 ~ 124 fps
89%
GeForce RTX 2070 Mobile:
73 121 [X] Schenker XMG Ultra 15 Intel Core i7-9700K 3.6GHz
GeForce RTX 2070 Mobile
min:
88 fps
124 ~ 106 fps
GeForce RTX 2070 Super Max-Q:
99.4 100 ~ 100 fps
GeForce RTX 2070 Mobile:
91.7 [X] Schenker XMG Ultra 15 Intel Core i7-9700K 3.6GHz
GeForce RTX 2070 Mobile
min:
74 fps
fps
100%
GeForce RTX 2060 (Desktop):
53.1 [X] AMD Ryzen 7 2700X 3.7GHz
GeForce RTX 2060 (Desktop)
min:
43 fps, max:
80 fps
fps
109%
GeForce RTX 2070 Super Max-Q:
56.8 58.2 ~ 58 fps
98%
GeForce RTX 2070 Mobile:
52.1 [X] Schenker XMG Ultra 15 Intel Core i7-9700K 3.6GHz
GeForce RTX 2070 Mobile
min:
42 fps
fps
100%
GeForce RTX 2060 (Desktop):
191.1 [X] AMD Ryzen 7 2700X 3.7GHz
GeForce RTX 2060 (Desktop)
min:
160 fps, max:
256 fps
fps
100%
GeForce RTX 2060 (Desktop):
147.9 [X] AMD Ryzen 7 2700X 3.7GHz
GeForce RTX 2060 (Desktop)
min:
131 fps, max:
201 fps
fps
131%
GeForce RTX 2070 Mobile:
194 [X] Schenker XMG Ultra 15 Intel Core i7-9700K 3.6GHz
GeForce RTX 2070 Mobile
min:
165 fps
fps
100%
GeForce RTX 2060 (Desktop):
132.7 [X] AMD Ryzen 7 2700X 3.7GHz
GeForce RTX 2060 (Desktop)
min:
117 fps, max:
181 fps
fps
122%
GeForce RTX 2070 Mobile:
162 [X] Schenker XMG Ultra 15 Intel Core i7-9700K 3.6GHz
GeForce RTX 2070 Mobile
min:
142 fps
fps
100%
GeForce RTX 2060 (Desktop):
122.4 [X] AMD Ryzen 7 2700X 3.7GHz
GeForce RTX 2060 (Desktop)
min:
108 fps, max:
163 fps
fps
115%
GeForce RTX 2070 Mobile:
141 [X] Schenker XMG Ultra 15 Intel Core i7-9700K 3.6GHz
GeForce RTX 2070 Mobile
min:
124 fps
fps
GeForce RTX 2070 Mobile:
104 [X] Schenker XMG Ultra 15 Intel Core i7-9700K 3.6GHz
GeForce RTX 2070 Mobile
min:
86 fps
fps
100%
GeForce RTX 2060 (Desktop):
54.9 [X] AMD Ryzen 7 2700X 3.7GHz
GeForce RTX 2060 (Desktop)
min:
42 fps, max:
98 fps
fps
100%
GeForce RTX 2060 (Desktop):
60 [X] AMD Ryzen 7 2700X 3.7GHz
GeForce RTX 2060 (Desktop)
fps
100%
GeForce RTX 2060 (Desktop):
60 [X] AMD Ryzen 7 2700X 3.7GHz
GeForce RTX 2060 (Desktop)
fps
100%
GeForce RTX 2060 (Desktop):
60 [X] AMD Ryzen 7 2700X 3.7GHz
GeForce RTX 2060 (Desktop)
fps
100%
GeForce RTX 2060 (Desktop):
60 [X] AMD Ryzen 7 2700X 3.7GHz
GeForce RTX 2060 (Desktop)
fps
100%
GeForce RTX 2060 (Desktop):
60 [X] AMD Ryzen 7 2700X 3.7GHz
GeForce RTX 2060 (Desktop)
fps
100%
GeForce RTX 2060 (Desktop):
50.6 [X] AMD Ryzen 7 2700X 3.7GHz
GeForce RTX 2060 (Desktop)
fps
100%
GeForce RTX 2060 (Desktop):
93.4 [X] AMD Ryzen 7 2700X 3.7GHz
GeForce RTX 2060 (Desktop)
min:
73 fps, max:
125 fps
fps
100%
GeForce RTX 2060 (Desktop):
89.7 [X] AMD Ryzen 7 2700X 3.7GHz
GeForce RTX 2060 (Desktop)
min:
66 fps, max:
122 fps
fps
99%
GeForce RTX 2070 Super Max-Q:
89.2 fps
105%
GeForce RTX 2070 Mobile:
94.5 [X] Schenker XMG Ultra 15 Intel Core i7-9700K 3.6GHz
GeForce RTX 2070 Mobile
min:
66 fps
fps
100%
GeForce RTX 2060 (Desktop):
84.3 [X] AMD Ryzen 7 2700X 3.7GHz
GeForce RTX 2060 (Desktop)
min:
61 fps, max:
116 fps
fps
99%
GeForce RTX 2070 Super Max-Q:
83.2 fps
102%
GeForce RTX 2070 Mobile:
86.1 [X] Schenker XMG Ultra 15 Intel Core i7-9700K 3.6GHz
GeForce RTX 2070 Mobile
min:
65 fps
fps
100%
GeForce RTX 2060 (Desktop):
79.9 [X] AMD Ryzen 7 2700X 3.7GHz
GeForce RTX 2060 (Desktop)
min:
61 fps, max:
117 fps
fps
100%
GeForce RTX 2070 Super Max-Q:
79.7 fps
104%
GeForce RTX 2070 Mobile:
83.3 [X] Schenker XMG Ultra 15 Intel Core i7-9700K 3.6GHz
GeForce RTX 2070 Mobile
min:
64 fps
fps
GeForce RTX 2070 Super Max-Q:
76.1 fps
GeForce RTX 2070 Mobile:
72.4 [X] Schenker XMG Ultra 15 Intel Core i7-9700K 3.6GHz
GeForce RTX 2070 Mobile
min:
56 fps
fps
100%
GeForce RTX 2060 (Desktop):
40.7 [X] AMD Ryzen 7 2700X 3.7GHz
GeForce RTX 2060 (Desktop)
min:
35 fps, max:
50 fps
fps
102%
GeForce RTX 2070 Super Max-Q:
41.5 fps
93%
GeForce RTX 2070 Mobile:
37.9 [X] Schenker XMG Ultra 15 Intel Core i7-9700K 3.6GHz
GeForce RTX 2070 Mobile
min:
31 fps
fps
100%
GeForce RTX 2060 (Desktop):
223 [X] AMD Ryzen 7 2700X 3.7GHz
GeForce RTX 2060 (Desktop)
min:
195 fps, max:
254 fps
fps
100%
GeForce RTX 2060 (Desktop):
157 [X] AMD Ryzen 7 2700X 3.7GHz
GeForce RTX 2060 (Desktop)
min:
110 fps, max:
191 fps
fps
90%
GeForce RTX 2070 Mobile:
142 [X] Schenker XMG Ultra 15 Intel Core i7-9700K 3.6GHz
GeForce RTX 2070 Mobile
min:
101 fps
fps
100%
GeForce RTX 2060 (Desktop):
147 [X] AMD Ryzen 7 2700X 3.7GHz
GeForce RTX 2060 (Desktop)
min:
109 fps, max:
185 fps
fps
92%
GeForce RTX 2070 Mobile:
135 [X] Schenker XMG Ultra 15 Intel Core i7-9700K 3.6GHz
GeForce RTX 2070 Mobile
min:
98 fps
fps
100%
GeForce RTX 2060 (Desktop):
133 [X] AMD Ryzen 7 2700X 3.7GHz
GeForce RTX 2060 (Desktop)
min:
60 fps, max:
170 fps
fps
89%
GeForce RTX 2070 Mobile:
119 [X] Schenker XMG Ultra 15 Intel Core i7-9700K 3.6GHz
GeForce RTX 2070 Mobile
min:
90 fps
fps
GeForce RTX 2070 Mobile:
77.9 [X] Schenker XMG Ultra 15 Intel Core i7-9700K 3.6GHz
GeForce RTX 2070 Mobile
min:
58 fps
fps
100%
GeForce RTX 2060 (Desktop):
39.7 [X] AMD Ryzen 7 2700X 3.7GHz
GeForce RTX 2060 (Desktop)
min:
25 fps, max:
55 fps
fps
99%
GeForce RTX 2070 Mobile:
39.2 [X] Schenker XMG Ultra 15 Intel Core i7-9700K 3.6GHz
GeForce RTX 2070 Mobile
min:
29 fps
fps
100%
GeForce RTX 2060 (Desktop):
108 [X] AMD Ryzen 7 2700X 3.7GHz
GeForce RTX 2060 (Desktop)
fps
100%
GeForce RTX 2060 (Desktop):
92 [X] AMD Ryzen 7 2700X 3.7GHz
GeForce RTX 2060 (Desktop)
fps
108%
GeForce RTX 2070 Super Max-Q:
99 fps
109%
GeForce RTX 2070 Mobile:
100 [X] Schenker XMG Ultra 15 Intel Core i7-9700K 3.6GHz
GeForce RTX 2070 Mobile
min:
38 fps
fps
100%
GeForce RTX 2060 (Desktop):
78 [X] AMD Ryzen 7 2700X 3.7GHz
GeForce RTX 2060 (Desktop)
fps
104%
GeForce RTX 2070 Super Max-Q:
81 fps
108%
GeForce RTX 2070 Mobile:
84 [X] Schenker XMG Ultra 15 Intel Core i7-9700K 3.6GHz
GeForce RTX 2070 Mobile
min:
27 fps
fps
100%
GeForce RTX 2060 (Desktop):
56 [X] AMD Ryzen 7 2700X 3.7GHz
GeForce RTX 2060 (Desktop)
fps
111%
GeForce RTX 2070 Super Max-Q:
62 fps
104%
GeForce RTX 2070 Mobile:
58 [X] Schenker XMG Ultra 15 Intel Core i7-9700K 3.6GHz
GeForce RTX 2070 Mobile
min:
24 fps
fps
GeForce RTX 2070 Super Max-Q:
47 fps
GeForce RTX 2070 Mobile:
48 [X] Schenker XMG Ultra 15 Intel Core i7-9700K 3.6GHz
GeForce RTX 2070 Mobile
min:
18 fps
fps
100%
GeForce RTX 2060 (Desktop):
28 [X] AMD Ryzen 7 2700X 3.7GHz
GeForce RTX 2060 (Desktop)
fps
114%
GeForce RTX 2070 Super Max-Q:
32 fps
111%
GeForce RTX 2070 Mobile:
31 [X] Schenker XMG Ultra 15 Intel Core i7-9700K 3.6GHz
GeForce RTX 2070 Mobile
min:
12 fps
fps
100%
GeForce RTX 2060 (Desktop):
178 [X] AMD Ryzen 7 2700X 3.7GHz
GeForce RTX 2060 (Desktop)
fps
77%
GeForce RTX 2070 Mobile:
137 fps
100%
GeForce RTX 2060 (Desktop):
140 [X] AMD Ryzen 7 2700X 3.7GHz
GeForce RTX 2060 (Desktop)
fps
81%
GeForce RTX 2070 Mobile:
113 fps
100%
GeForce RTX 2060 (Desktop):
131 [X] AMD Ryzen 7 2700X 3.7GHz
GeForce RTX 2060 (Desktop)
fps
85%
GeForce RTX 2070 Mobile:
112 fps
100%
GeForce RTX 2060 (Desktop):
105 [X] AMD Ryzen 7 2700X 3.7GHz
GeForce RTX 2060 (Desktop)
fps
90%
GeForce RTX 2070 Mobile:
94 fps
100%
GeForce RTX 2060 (Desktop):
59 [X] AMD Ryzen 7 2700X 3.7GHz
GeForce RTX 2060 (Desktop)
fps
100%
GeForce RTX 2060 (Desktop):
234.5 [X] AMD Ryzen 7 2700X 3.7GHz
GeForce RTX 2060 (Desktop)
min:
222 fps, max:
242 fps
fps
100%
GeForce RTX 2060 (Desktop):
205.4 [X] AMD Ryzen 7 2700X 3.7GHz
GeForce RTX 2060 (Desktop)
min:
191 fps, max:
218 fps
fps
186%
GeForce RTX 2070 Mobile:
382 [X] Schenker XMG Ultra 15 Intel Core i7-9700K 3.6GHz
GeForce RTX 2070 Mobile
min:
333 fps
fps
100%
GeForce RTX 2060 (Desktop):
194 [X] AMD Ryzen 7 2700X 3.7GHz
GeForce RTX 2060 (Desktop)
min:
186 fps, max:
206 fps
fps
148%
GeForce RTX 2070 Mobile:
287 [X] Schenker XMG Ultra 15 Intel Core i7-9700K 3.6GHz
GeForce RTX 2070 Mobile
min:
262 fps
fps
100%
GeForce RTX 2060 (Desktop):
186.2 [X] AMD Ryzen 7 2700X 3.7GHz
GeForce RTX 2060 (Desktop)
min:
176 fps, max:
203 fps
fps
150%
GeForce RTX 2070 Mobile:
279 [X] Schenker XMG Ultra 15 Intel Core i7-9700K 3.6GHz
GeForce RTX 2070 Mobile
min:
247 fps
fps
GeForce RTX 2070 Mobile:
277 [X] Schenker XMG Ultra 15 Intel Core i7-9700K 3.6GHz
GeForce RTX 2070 Mobile
min:
244 fps
fps
100%
GeForce RTX 2060 (Desktop):
151.2 [X] AMD Ryzen 7 2700X 3.7GHz
GeForce RTX 2060 (Desktop)
min:
146 fps, max:
155 fps
fps
106%
GeForce RTX 2070 Mobile:
160 [X] Schenker XMG Ultra 15 Intel Core i7-9700K 3.6GHz
GeForce RTX 2070 Mobile
min:
127 fps
fps
100%
GeForce RTX 2060 (Desktop):
133 [X] AMD Ryzen 7 2700X 3.7GHz
GeForce RTX 2060 (Desktop)
fps
100%
GeForce RTX 2070 Super Max-Q:
133 fps
100%
GeForce RTX 2060 (Desktop):
107 [X] AMD Ryzen 7 2700X 3.7GHz
GeForce RTX 2060 (Desktop)
fps
107%
GeForce RTX 2070 Super Max-Q:
112 118 ~ 115 fps
93%
GeForce RTX 2070 Mobile:
86 91 [X] Schenker XMG Ultra 15 Intel Core i7-9700K 3.6GHz
GeForce RTX 2070 Mobile
min:
51 fps
92 95 97 104 107 107 [X] MSI GP65 10SFK-047US Intel Core i7-10750H 2.6GHz
GeForce RTX 2070 Mobile
111 114 ~ 100 fps
100%
GeForce RTX 2060 (Desktop):
101 [X] AMD Ryzen 7 2700X 3.7GHz
GeForce RTX 2060 (Desktop)
fps
95%
GeForce RTX 2070 Mobile:
80.3 84 [X] Schenker XMG Ultra 15 Intel Core i7-9700K 3.6GHz
GeForce RTX 2070 Mobile
min:
50 fps
90 92 93 100 101 102 [X] MSI GP65 10SFK-047US Intel Core i7-10750H 2.6GHz
GeForce RTX 2070 Mobile
103 107 107 ~ 96 fps
100%
GeForce RTX 2060 (Desktop):
90 [X] AMD Ryzen 7 2700X 3.7GHz
GeForce RTX 2060 (Desktop)
fps
108%
GeForce RTX 2070 Super Max-Q:
91 96 99 99 [X] Aorus 17G XB Intel Core i7-10875H 2.3GHz
GeForce RTX 2070 Super Max-Q
min:
77 fps
100 ~ 97 fps
99%
GeForce RTX 2070 Mobile:
74.2 78 [X] Schenker XMG Ultra 15 Intel Core i7-9700K 3.6GHz
GeForce RTX 2070 Mobile
min:
47 fps
80 85 91 93 [X] MSI GP65 10SFK-047US Intel Core i7-10750H 2.6GHz
GeForce RTX 2070 Mobile
93 93 95 97 97 ~ 89 fps
GeForce RTX 2070 Super Max-Q:
68 68 ~ 68 fps
GeForce RTX 2070 Mobile:
58 [X] Schenker XMG Ultra 15 Intel Core i7-9700K 3.6GHz
GeForce RTX 2070 Mobile
min:
35 fps
fps
100%
GeForce RTX 2060 (Desktop):
32 [X] AMD Ryzen 7 2700X 3.7GHz
GeForce RTX 2060 (Desktop)
fps
113%
GeForce RTX 2070 Super Max-Q:
35 36 ~ 36 fps
103%
GeForce RTX 2070 Mobile:
32 [X] Schenker XMG Ultra 15 Intel Core i7-9700K 3.6GHz
GeForce RTX 2070 Mobile
min:
16 fps
34 ~ 33 fps
GeForce RTX 2070 Mobile:
313 fps
GeForce RTX 2070 Mobile:
183 fps
GeForce RTX 2070 Mobile:
149 fps
GeForce RTX 2070 Mobile:
125 fps
100%
GeForce RTX 2060 (Desktop):
241 [X] AMD Ryzen 7 2700X 3.7GHz
GeForce RTX 2060 (Desktop)
min:
182 fps, max:
263 fps
fps
100%
GeForce RTX 2060 (Desktop):
191 [X] AMD Ryzen 7 2700X 3.7GHz
GeForce RTX 2060 (Desktop)
min:
91 fps, max:
213 fps
fps
97%
GeForce RTX 2070 Mobile:
186 [X] Schenker XMG Ultra 15 Intel Core i7-9700K 3.6GHz
GeForce RTX 2070 Mobile
min:
162 fps
fps
100%
GeForce RTX 2060 (Desktop):
154 [X] AMD Ryzen 7 2700X 3.7GHz
GeForce RTX 2060 (Desktop)
min:
129 fps, max:
169 fps
fps
99%
GeForce RTX 2070 Mobile:
152 [X] Schenker XMG Ultra 15 Intel Core i7-9700K 3.6GHz
GeForce RTX 2070 Mobile
min:
135 fps
fps
100%
GeForce RTX 2060 (Desktop):
112 [X] AMD Ryzen 7 2700X 3.7GHz
GeForce RTX 2060 (Desktop)
min:
103 fps, max:
124 fps
fps
92%
GeForce RTX 2070 Mobile:
103 [X] Schenker XMG Ultra 15 Intel Core i7-9700K 3.6GHz
GeForce RTX 2070 Mobile
min:
78 fps
fps
GeForce RTX 2070 Mobile:
84 [X] Schenker XMG Ultra 15 Intel Core i7-9700K 3.6GHz
GeForce RTX 2070 Mobile
min:
74 fps
fps
100%
GeForce RTX 2060 (Desktop):
55 [X] AMD Ryzen 7 2700X 3.7GHz
GeForce RTX 2060 (Desktop)
min:
49 fps, max:
61 fps
fps
93%
GeForce RTX 2070 Mobile:
51 [X] Schenker XMG Ultra 15 Intel Core i7-9700K 3.6GHz
GeForce RTX 2070 Mobile
min:
43 fps
fps
100%
GeForce RTX 2060 (Desktop):
144 [X] AMD Ryzen 7 2700X 3.7GHz
GeForce RTX 2060 (Desktop)
min:
110 fps, max:
159 fps
fps
100%
GeForce RTX 2060 (Desktop):
114 [X] AMD Ryzen 7 2700X 3.7GHz
GeForce RTX 2060 (Desktop)
min:
84 fps, max:
136 fps
fps
99%
GeForce RTX 2070 Super Max-Q:
113 fps
103%
GeForce RTX 2070 Mobile:
117 [X] Schenker XMG Ultra 15 Intel Core i7-9700K 3.6GHz
GeForce RTX 2070 Mobile
min:
98 fps
fps
100%
GeForce RTX 2060 (Desktop):
109 [X] AMD Ryzen 7 2700X 3.7GHz
GeForce RTX 2060 (Desktop)
min:
86 fps, max:
130 fps
fps
94%
GeForce RTX 2070 Super Max-Q:
102 fps
94%
GeForce RTX 2070 Mobile:
103 [X] Schenker XMG Ultra 15 Intel Core i7-9700K 3.6GHz
GeForce RTX 2070 Mobile
min:
82 fps
fps
100%
GeForce RTX 2060 (Desktop):
86 [X] AMD Ryzen 7 2700X 3.7GHz
GeForce RTX 2060 (Desktop)
min:
67 fps, max:
105 fps
fps
98%
GeForce RTX 2070 Super Max-Q:
84.2 fps
94%
GeForce RTX 2070 Mobile:
81 [X] Schenker XMG Ultra 15 Intel Core i7-9700K 3.6GHz
GeForce RTX 2070 Mobile
min:
66 fps
fps
GeForce RTX 2070 Super Max-Q:
55.7 fps
GeForce RTX 2070 Mobile:
51.9 [X] Schenker XMG Ultra 15 Intel Core i7-9700K 3.6GHz
GeForce RTX 2070 Mobile
min:
43 fps
fps
100%
GeForce RTX 2060 (Desktop):
27.5 [X] AMD Ryzen 7 2700X 3.7GHz
GeForce RTX 2060 (Desktop)
min:
24 fps, max:
32 fps
fps
100%
GeForce RTX 2070 Super Max-Q:
27.5 fps
91%
GeForce RTX 2070 Mobile:
25.1 [X] Schenker XMG Ultra 15 Intel Core i7-9700K 3.6GHz
GeForce RTX 2070 Mobile
min:
21 fps
fps
100%
GeForce RTX 2060 (Desktop):
60 [X] AMD Ryzen 7 2700X 3.7GHz
GeForce RTX 2060 (Desktop)
fps
100%
GeForce RTX 2060 (Desktop):
60 [X] AMD Ryzen 7 2700X 3.7GHz
GeForce RTX 2060 (Desktop)
fps
100%
GeForce RTX 2070 Mobile:
60 [X] Schenker XMG Ultra 15 Intel Core i7-9700K 3.6GHz
GeForce RTX 2070 Mobile
min:
59 fps
fps
100%
GeForce RTX 2060 (Desktop):
60 [X] AMD Ryzen 7 2700X 3.7GHz
GeForce RTX 2060 (Desktop)
fps
100%
GeForce RTX 2070 Mobile:
60 [X] Schenker XMG Ultra 15 Intel Core i7-9700K 3.6GHz
GeForce RTX 2070 Mobile
min:
59 fps
fps
100%
GeForce RTX 2060 (Desktop):
60 [X] AMD Ryzen 7 2700X 3.7GHz
GeForce RTX 2060 (Desktop)
fps
100%
GeForce RTX 2070 Mobile:
60 [X] Schenker XMG Ultra 15 Intel Core i7-9700K 3.6GHz
GeForce RTX 2070 Mobile
min:
59 fps
fps
GeForce RTX 2070 Mobile:
60 [X] Schenker XMG Ultra 15 Intel Core i7-9700K 3.6GHz
GeForce RTX 2070 Mobile
min:
59 fps
fps
100%
GeForce RTX 2060 (Desktop):
35.3 [X] AMD Ryzen 7 2700X 3.7GHz
GeForce RTX 2060 (Desktop)
fps
110%
GeForce RTX 2070 Mobile:
38.8 [X] Schenker XMG Ultra 15 Intel Core i7-9700K 3.6GHz
GeForce RTX 2070 Mobile
min:
35 fps
fps
100%
GeForce RTX 2060 (Desktop):
117 [X] AMD Ryzen 7 2700X 3.7GHz
GeForce RTX 2060 (Desktop)
min:
75 fps, max:
158 fps
fps
127%
GeForce RTX 2070 Super Max-Q:
149 fps
126%
GeForce RTX 2070 Mobile:
147 fps
100%
GeForce RTX 2060 (Desktop):
103 [X] AMD Ryzen 7 2700X 3.7GHz
GeForce RTX 2060 (Desktop)
min:
74 fps, max:
135 fps
fps
115%
GeForce RTX 2070 Super Max-Q:
118 fps
118%
GeForce RTX 2070 Mobile:
119 [X] Schenker XMG Ultra 15 Intel Core i7-9700K 3.6GHz
GeForce RTX 2070 Mobile
min:
105 fps
125 ~ 122 fps
100%
GeForce RTX 2060 (Desktop):
99 [X] AMD Ryzen 7 2700X 3.7GHz
GeForce RTX 2060 (Desktop)
min:
80 fps, max:
129 fps
fps
112%
GeForce RTX 2070 Super Max-Q:
111 fps
114%
GeForce RTX 2070 Mobile:
110 [X] Schenker XMG Ultra 15 Intel Core i7-9700K 3.6GHz
GeForce RTX 2070 Mobile
min:
98 fps
115 ~ 113 fps
100%
GeForce RTX 2060 (Desktop):
94 [X] AMD Ryzen 7 2700X 3.7GHz
GeForce RTX 2060 (Desktop)
min:
72 fps, max:
124 fps
fps
111%
GeForce RTX 2070 Super Max-Q:
104 fps
113%
GeForce RTX 2070 Mobile:
103 [X] Schenker XMG Ultra 15 Intel Core i7-9700K 3.6GHz
GeForce RTX 2070 Mobile
min:
90 fps
109 ~ 106 fps
GeForce RTX 2070 Mobile:
76 [X] Schenker XMG Ultra 15 Intel Core i7-9700K 3.6GHz
GeForce RTX 2070 Mobile
min:
68 fps
fps
100%
GeForce RTX 2060 (Desktop):
41 [X] AMD Ryzen 7 2700X 3.7GHz
GeForce RTX 2060 (Desktop)
min:
37 fps, max:
49 fps
fps
98%
GeForce RTX 2070 Mobile:
40 [X] Schenker XMG Ultra 15 Intel Core i7-9700K 3.6GHz
GeForce RTX 2070 Mobile
min:
35 fps
fps
GeForce RTX 2070 Super Max-Q:
67.8 75.4 ~ 72 fps
100%
GeForce RTX 2060 (Desktop):
128 [X] AMD Ryzen 7 2700X 3.7GHz
GeForce RTX 2060 (Desktop)
min:
61 fps, max:
162 fps
fps
100%
GeForce RTX 2060 (Desktop):
114 [X] AMD Ryzen 7 2700X 3.7GHz
GeForce RTX 2060 (Desktop)
min:
61 fps, max:
139 fps
fps
111%
GeForce RTX 2070 Super Max-Q:
127 fps
110%
GeForce RTX 2070 Mobile:
125 [X] Schenker XMG Ultra 15 Intel Core i7-9700K 3.6GHz
GeForce RTX 2070 Mobile
min:
92 fps
fps
100%
GeForce RTX 2060 (Desktop):
91 [X] AMD Ryzen 7 2700X 3.7GHz
GeForce RTX 2060 (Desktop)
min:
62 fps, max:
112 fps
fps
119%
GeForce RTX 2070 Super Max-Q:
108 fps
107%
GeForce RTX 2070 Mobile:
97.3 [X] Schenker XMG Ultra 15 Intel Core i7-9700K 3.6GHz
GeForce RTX 2070 Mobile
min:
76 fps
fps
100%
GeForce RTX 2060 (Desktop):
70 [X] AMD Ryzen 7 2700X 3.7GHz
GeForce RTX 2060 (Desktop)
min:
50 fps, max:
83 fps
fps
108%
GeForce RTX 2070 Super Max-Q:
75.9 fps
105%
GeForce RTX 2070 Mobile:
73.2 [X] Schenker XMG Ultra 15 Intel Core i7-9700K 3.6GHz
GeForce RTX 2070 Mobile
min:
59 fps
fps
GeForce RTX 2070 Super Max-Q:
54.4 fps
GeForce RTX 2070 Mobile:
52.4 [X] Schenker XMG Ultra 15 Intel Core i7-9700K 3.6GHz
GeForce RTX 2070 Mobile
min:
42 fps
fps
100%
GeForce RTX 2060 (Desktop):
25 [X] AMD Ryzen 7 2700X 3.7GHz
GeForce RTX 2060 (Desktop)
min:
21 fps, max:
29 fps
fps
112%
GeForce RTX 2070 Super Max-Q:
27.9 fps
105%
GeForce RTX 2070 Mobile:
26.2 [X] Schenker XMG Ultra 15 Intel Core i7-9700K 3.6GHz
GeForce RTX 2070 Mobile
min:
23 fps
fps
100%
GeForce RTX 2060 (Desktop):
151.9 [X] AMD Ryzen 7 2700X 3.7GHz
GeForce RTX 2060 (Desktop)
min:
95 fps, max:
175 fps
fps
107%
GeForce RTX 2070 Super Max-Q:
162 fps
102%
GeForce RTX 2070 Mobile:
151 158 ~ 155 fps
100%
GeForce RTX 2060 (Desktop):
99.6 [X] AMD Ryzen 7 2700X 3.7GHz
GeForce RTX 2060 (Desktop)
min:
73 fps, max:
132 fps
fps
107%
GeForce RTX 2070 Super Max-Q:
104 110 ~ 107 fps
103%
GeForce RTX 2070 Mobile:
100 103 [X] Schenker XMG Ultra 15 Intel Core i7-9700K 3.6GHz
GeForce RTX 2070 Mobile
min:
67 fps
106 ~ 103 fps
100%
GeForce RTX 2060 (Desktop):
72.6 [X] AMD Ryzen 7 2700X 3.7GHz
GeForce RTX 2060 (Desktop)
min:
31 fps, max:
114 fps
fps
113%
GeForce RTX 2070 Super Max-Q:
80 83.7 ~ 82 fps
109%
GeForce RTX 2070 Mobile:
77 78.1 [X] Schenker XMG Ultra 15 Intel Core i7-9700K 3.6GHz
GeForce RTX 2070 Mobile
min:
46 fps
80.6 ~ 79 fps
100%
GeForce RTX 2060 (Desktop):
30.8 [X] AMD Ryzen 7 2700X 3.7GHz
GeForce RTX 2060 (Desktop)
min:
13 fps, max:
45 fps
fps
107%
GeForce RTX 2070 Super Max-Q:
33 fps
105%
GeForce RTX 2070 Mobile:
32.2 [X] Schenker XMG Ultra 15 Intel Core i7-9700K 3.6GHz
GeForce RTX 2070 Mobile
min:
23 fps
fps
100%
GeForce RTX 2060 (Desktop):
214.4 [X] AMD Ryzen 7 2700X 3.7GHz
GeForce RTX 2060 (Desktop)
min:
159 fps, max:
274 fps
fps
110%
GeForce RTX 2070 Mobile:
236 fps
100%
GeForce RTX 2060 (Desktop):
179.2 [X] AMD Ryzen 7 2700X 3.7GHz
GeForce RTX 2060 (Desktop)
min:
128 fps, max:
238 fps
fps
74%
GeForce RTX 2070 Super Max-Q:
133 fps
105%
GeForce RTX 2070 Mobile:
185 [X] Schenker XMG Ultra 15 Intel Core i7-9700K 3.6GHz
GeForce RTX 2070 Mobile
min:
143 fps
190 ~ 188 fps
100%
GeForce RTX 2060 (Desktop):
155 [X] AMD Ryzen 7 2700X 3.7GHz
GeForce RTX 2060 (Desktop)
min:
124 fps, max:
198 fps
fps
85%
GeForce RTX 2070 Super Max-Q:
132 fps
96%
GeForce RTX 2070 Mobile:
140 158 [X] Schenker XMG Ultra 15 Intel Core i7-9700K 3.6GHz
GeForce RTX 2070 Mobile
min:
130 fps
~ 149 fps
100%
GeForce RTX 2060 (Desktop):
141 [X] AMD Ryzen 7 2700X 3.7GHz
GeForce RTX 2060 (Desktop)
min:
118 fps, max:
156 fps
fps
77%
GeForce RTX 2070 Super Max-Q:
108 fps
100%
GeForce RTX 2070 Mobile:
132 149 [X] Schenker XMG Ultra 15 Intel Core i7-9700K 3.6GHz
GeForce RTX 2070 Mobile
min:
128 fps
~ 141 fps
GeForce RTX 2070 Super Max-Q:
86.2 fps
GeForce RTX 2070 Mobile:
93.5 [X] Schenker XMG Ultra 15 Intel Core i7-9700K 3.6GHz
GeForce RTX 2070 Mobile
min:
80 fps
fps
100%
GeForce RTX 2060 (Desktop):
38 [X] AMD Ryzen 7 2700X 3.7GHz
GeForce RTX 2060 (Desktop)
min:
32 fps, max:
42 fps
fps
113%
GeForce RTX 2070 Super Max-Q:
43 fps
120%
GeForce RTX 2070 Mobile:
45.5 [X] Schenker XMG Ultra 15 Intel Core i7-9700K 3.6GHz
GeForce RTX 2070 Mobile
min:
42 fps
fps
GeForce RTX 2070 Mobile:
163 [X] Schenker XMG Ultra 15 Intel Core i7-9700K 3.6GHz
GeForce RTX 2070 Mobile
min:
151 fps
fps
GeForce RTX 2070 Mobile:
140 [X] Schenker XMG Ultra 15 Intel Core i7-9700K 3.6GHz
GeForce RTX 2070 Mobile
min:
126 fps
fps
GeForce RTX 2070 Mobile:
106 [X] Schenker XMG Ultra 15 Intel Core i7-9700K 3.6GHz
GeForce RTX 2070 Mobile
min:
94 fps
fps
GeForce RTX 2070 Mobile:
75.3 [X] Schenker XMG Ultra 15 Intel Core i7-9700K 3.6GHz
GeForce RTX 2070 Mobile
min:
69 fps
fps
GeForce RTX 2070 Mobile:
39.8 [X] Schenker XMG Ultra 15 Intel Core i7-9700K 3.6GHz
GeForce RTX 2070 Mobile
min:
36 fps
fps
GeForce RTX 2070 Mobile:
157 [X] Schenker XMG Ultra 15 Intel Core i7-9700K 3.6GHz
GeForce RTX 2070 Mobile
min:
114 fps
fps
GeForce RTX 2070 Mobile:
141 [X] Schenker XMG Ultra 15 Intel Core i7-9700K 3.6GHz
GeForce RTX 2070 Mobile
min:
101 fps
fps
GeForce RTX 2070 Mobile:
135 [X] Schenker XMG Ultra 15 Intel Core i7-9700K 3.6GHz
GeForce RTX 2070 Mobile
min:
94 fps
fps
GeForce RTX 2070 Mobile:
90.1 [X] Schenker XMG Ultra 15 Intel Core i7-9700K 3.6GHz
GeForce RTX 2070 Mobile
min:
64 fps
fps
GeForce RTX 2070 Mobile:
48 [X] Schenker XMG Ultra 15 Intel Core i7-9700K 3.6GHz
GeForce RTX 2070 Mobile
min:
34 fps
fps
100%
GeForce RTX 2060 (Desktop):
243 [X] AMD Ryzen 7 2700X 3.7GHz
GeForce RTX 2060 (Desktop)
min:
149 fps, max:
361 fps
fps
100%
GeForce RTX 2060 (Desktop):
231 [X] AMD Ryzen 7 2700X 3.7GHz
GeForce RTX 2060 (Desktop)
min:
152 fps, max:
335 fps
fps
100%
GeForce RTX 2060 (Desktop):
155 [X] AMD Ryzen 7 2700X 3.7GHz
GeForce RTX 2060 (Desktop)
min:
116 fps, max:
205 fps
fps
100%
GeForce RTX 2060 (Desktop):
128 [X] AMD Ryzen 7 2700X 3.7GHz
GeForce RTX 2060 (Desktop)
min:
62 fps, max:
161 fps
fps
100%
GeForce RTX 2060 (Desktop):
68 [X] AMD Ryzen 7 2700X 3.7GHz
GeForce RTX 2060 (Desktop)
min:
39 fps, max:
83 fps
fps
100%
GeForce RTX 2060 (Desktop):
113 [X] AMD Ryzen 7 2700X 3.7GHz
GeForce RTX 2060 (Desktop)
fps
74%
GeForce RTX 2070 Mobile:
84 fps
100%
GeForce RTX 2060 (Desktop):
97 [X] AMD Ryzen 7 2700X 3.7GHz
GeForce RTX 2060 (Desktop)
fps
74%
GeForce RTX 2070 Mobile:
72 fps
100%
GeForce RTX 2060 (Desktop):
92 [X] AMD Ryzen 7 2700X 3.7GHz
GeForce RTX 2060 (Desktop)
fps
77%
GeForce RTX 2070 Mobile:
71 fps
100%
GeForce RTX 2060 (Desktop):
78 [X] AMD Ryzen 7 2700X 3.7GHz
GeForce RTX 2060 (Desktop)
fps
82%
GeForce RTX 2070 Mobile:
64 fps
100%
GeForce RTX 2060 (Desktop):
39 [X] AMD Ryzen 7 2700X 3.7GHz
GeForce RTX 2060 (Desktop)
fps
100%
GeForce RTX 2060 (Desktop):
137 [X] AMD Ryzen 7 2700X 3.7GHz
GeForce RTX 2060 (Desktop)
P1:
86.1 fps
fps
150%
GeForce RTX 2070 Mobile:
206.1 fps
100%
GeForce RTX 2060 (Desktop):
135 [X] AMD Ryzen 7 2700X 3.7GHz
GeForce RTX 2060 (Desktop)
P1:
85.8 fps
fps
134%
GeForce RTX 2070 Mobile:
181.2 fps
100%
GeForce RTX 2060 (Desktop):
136 [X] AMD Ryzen 7 2700X 3.7GHz
GeForce RTX 2060 (Desktop)
P1:
84.9 fps
fps
125%
GeForce RTX 2070 Mobile:
169.5 fps
100%
GeForce RTX 2060 (Desktop):
103 [X] AMD Ryzen 7 2700X 3.7GHz
GeForce RTX 2060 (Desktop)
P1:
42.1 fps
fps
140%
GeForce RTX 2070 Mobile:
144.5 fps
100%
GeForce RTX 2060 (Desktop):
49.7 [X] AMD Ryzen 7 2700X 3.7GHz
GeForce RTX 2060 (Desktop)
P1:
38.2 fps
fps
GeForce RTX 2070 Mobile:
121 [X] Schenker XMG Ultra 15 Intel Core i7-9700K 3.6GHz
GeForce RTX 2070 Mobile
min:
117 fps
fps
GeForce RTX 2070 Mobile:
119 [X] Schenker XMG Ultra 15 Intel Core i7-9700K 3.6GHz
GeForce RTX 2070 Mobile
min:
111 fps
fps
GeForce RTX 2070 Mobile:
94.1 [X] Schenker XMG Ultra 15 Intel Core i7-9700K 3.6GHz
GeForce RTX 2070 Mobile
min:
86 fps
fps
GeForce RTX 2070 Mobile:
62.7 [X] Schenker XMG Ultra 15 Intel Core i7-9700K 3.6GHz
GeForce RTX 2070 Mobile
min:
58 fps
fps
GeForce RTX 2070 Mobile:
33.1 [X] Schenker XMG Ultra 15 Intel Core i7-9700K 3.6GHz
GeForce RTX 2070 Mobile
min:
31 fps
fps
GeForce RTX 2070 Mobile:
161 [X] Schenker XMG Ultra 15 Intel Core i7-9700K 3.6GHz
GeForce RTX 2070 Mobile
min:
37 fps
fps
GeForce RTX 2070 Mobile:
127 [X] Schenker XMG Ultra 15 Intel Core i7-9700K 3.6GHz
GeForce RTX 2070 Mobile
min:
35 fps
fps
GeForce RTX 2070 Mobile:
96 [X] Schenker XMG Ultra 15 Intel Core i7-9700K 3.6GHz
GeForce RTX 2070 Mobile
min:
31 fps
fps
GeForce RTX 2070 Mobile:
39 [X] Schenker XMG Ultra 15 Intel Core i7-9700K 3.6GHz
GeForce RTX 2070 Mobile
min:
24 fps
fps
100%
GeForce RTX 2060 (Desktop):
189.5 [X] AMD Ryzen 7 2700X 3.7GHz
GeForce RTX 2060 (Desktop)
min:
161 fps, max:
207 fps
fps
100%
GeForce RTX 2060 (Desktop):
166.7 [X] AMD Ryzen 7 2700X 3.7GHz
GeForce RTX 2060 (Desktop)
min:
147 fps, max:
188 fps
fps
118%
GeForce RTX 2070 Mobile:
196 [X] Schenker XMG Ultra 15 Intel Core i7-9700K 3.6GHz
GeForce RTX 2070 Mobile
min:
153 fps
fps
100%
GeForce RTX 2060 (Desktop):
158.7 [X] AMD Ryzen 7 2700X 3.7GHz
GeForce RTX 2060 (Desktop)
min:
126 fps, max:
184 fps
fps
109%
GeForce RTX 2070 Mobile:
173 [X] Schenker XMG Ultra 15 Intel Core i7-9700K 3.6GHz
GeForce RTX 2070 Mobile
min:
135 fps
fps
100%
GeForce RTX 2060 (Desktop):
121.6 [X] AMD Ryzen 7 2700X 3.7GHz
GeForce RTX 2060 (Desktop)
min:
110 fps, max:
134 fps
fps
107%
GeForce RTX 2070 Mobile:
130 [X] Schenker XMG Ultra 15 Intel Core i7-9700K 3.6GHz
GeForce RTX 2070 Mobile
min:
106 fps
fps
100%
GeForce RTX 2060 (Desktop):
44.3 [X] AMD Ryzen 7 2700X 3.7GHz
GeForce RTX 2060 (Desktop)
min:
37 fps, max:
52 fps
fps
105%
GeForce RTX 2070 Mobile:
46.3 [X] Schenker XMG Ultra 15 Intel Core i7-9700K 3.6GHz
GeForce RTX 2070 Mobile
min:
36 fps
fps
100%
GeForce RTX 2060 (Desktop):
312 [X] AMD Ryzen 7 2700X 3.7GHz
GeForce RTX 2060 (Desktop)
min:
297 fps, max:
328 fps
fps
GeForce RTX 2070 Mobile:
242 [X] Schenker XMG Ultra 15 Intel Core i7-9700K 3.6GHz
GeForce RTX 2070 Mobile
min:
192 fps
fps
100%
GeForce RTX 2060 (Desktop):
196 [X] AMD Ryzen 7 2700X 3.7GHz
GeForce RTX 2060 (Desktop)
min:
177 fps, max:
210 fps
fps
89%
GeForce RTX 2070 Mobile:
175 [X] Schenker XMG Ultra 15 Intel Core i7-9700K 3.6GHz
GeForce RTX 2070 Mobile
min:
109 fps
fps
100%
GeForce RTX 2060 (Desktop):
117 [X] AMD Ryzen 7 2700X 3.7GHz
GeForce RTX 2060 (Desktop)
min:
104 fps, max:
139 fps
fps
89%
GeForce RTX 2070 Mobile:
104 [X] Schenker XMG Ultra 15 Intel Core i7-9700K 3.6GHz
GeForce RTX 2070 Mobile
min:
79 fps
fps
100%
GeForce RTX 2060 (Desktop):
68 [X] AMD Ryzen 7 2700X 3.7GHz
GeForce RTX 2060 (Desktop)
min:
61 fps, max:
80 fps
fps
100%
GeForce RTX 2060 (Desktop):
246 [X] AMD Ryzen 7 2700X 3.7GHz
GeForce RTX 2060 (Desktop)
min:
225 fps, max:
252 fps
fps
100%
GeForce RTX 2060 (Desktop):
248 [X] AMD Ryzen 7 2700X 3.7GHz
GeForce RTX 2060 (Desktop)
min:
235 fps, max:
251 fps
fps
100%
GeForce RTX 2070 Mobile:
249 [X] Schenker XMG Ultra 15 Intel Core i7-9700K 3.6GHz
GeForce RTX 2070 Mobile
min:
237 fps
fps
100%
GeForce RTX 2060 (Desktop):
221 [X] AMD Ryzen 7 2700X 3.7GHz
GeForce RTX 2060 (Desktop)
min:
183 fps, max:
251 fps
fps
112%
GeForce RTX 2070 Mobile:
247 [X] Schenker XMG Ultra 15 Intel Core i7-9700K 3.6GHz
GeForce RTX 2070 Mobile
min:
221 fps
fps
100%
GeForce RTX 2060 (Desktop):
115 [X] AMD Ryzen 7 2700X 3.7GHz
GeForce RTX 2060 (Desktop)
min:
96 fps, max:
160 fps
fps
103%
GeForce RTX 2070 Mobile:
118 [X] Schenker XMG Ultra 15 Intel Core i7-9700K 3.6GHz
GeForce RTX 2070 Mobile
min:
102 fps
fps
GeForce RTX 2070 Mobile:
143 [X] Schenker XMG Ultra 15 Intel Core i7-9700K 3.6GHz
GeForce RTX 2070 Mobile
min:
133 fps
fps
GeForce RTX 2070 Mobile:
140 [X] Schenker XMG Ultra 15 Intel Core i7-9700K 3.6GHz
GeForce RTX 2070 Mobile
min:
128 fps
fps
GeForce RTX 2070 Mobile:
139 [X] Schenker XMG Ultra 15 Intel Core i7-9700K 3.6GHz
GeForce RTX 2070 Mobile
min:
119 fps
fps
GeForce RTX 2070 Mobile:
62.8 [X] Schenker XMG Ultra 15 Intel Core i7-9700K 3.6GHz
GeForce RTX 2070 Mobile
min:
55 fps
fps
100%
GeForce RTX 2060 (Desktop):
149 [X] AMD Ryzen 7 2700X 3.7GHz
GeForce RTX 2060 (Desktop)
min:
127 fps, max:
167 fps
fps
100%
GeForce RTX 2060 (Desktop):
103 [X] AMD Ryzen 7 2700X 3.7GHz
GeForce RTX 2060 (Desktop)
min:
90 fps, max:
115 fps
fps
103%
GeForce RTX 2070 Mobile:
106 [X] Schenker XMG Ultra 15 Intel Core i7-9700K 3.6GHz
GeForce RTX 2070 Mobile
min:
92 fps
fps
100%
GeForce RTX 2060 (Desktop):
97 [X] AMD Ryzen 7 2700X 3.7GHz
GeForce RTX 2060 (Desktop)
min:
85 fps, max:
108 fps
fps
102%
GeForce RTX 2070 Mobile:
98.9 [X] Schenker XMG Ultra 15 Intel Core i7-9700K 3.6GHz
GeForce RTX 2070 Mobile
min:
87 fps
fps
100%
GeForce RTX 2060 (Desktop):
56 [X] AMD Ryzen 7 2700X 3.7GHz
GeForce RTX 2060 (Desktop)
min:
49 fps, max:
63 fps
fps
101%
GeForce RTX 2070 Mobile:
56.8 [X] Schenker XMG Ultra 15 Intel Core i7-9700K 3.6GHz
GeForce RTX 2070 Mobile
min:
48 fps
fps
100%
GeForce RTX 2060 (Desktop):
38 [X] AMD Ryzen 7 2700X 3.7GHz
GeForce RTX 2060 (Desktop)
min:
29 fps, max:
44 fps
fps
103%
GeForce RTX 2070 Mobile:
39.1 [X] Schenker XMG Ultra 15 Intel Core i7-9700K 3.6GHz
GeForce RTX 2070 Mobile
min:
31 fps
fps
100%
GeForce RTX 2060 (Desktop):
265 [X] AMD Ryzen 7 2700X 3.7GHz
GeForce RTX 2060 (Desktop)
min:
55 fps, max:
380 fps
fps
100%
GeForce RTX 2060 (Desktop):
163 [X] AMD Ryzen 7 2700X 3.7GHz
GeForce RTX 2060 (Desktop)
min:
79 fps, max:
207 fps
fps
101%
GeForce RTX 2070 Mobile:
164 [X] Schenker XMG Ultra 15 Intel Core i7-9700K 3.6GHz
GeForce RTX 2070 Mobile
min:
93 fps
fps
100%
GeForce RTX 2060 (Desktop):
157 [X] AMD Ryzen 7 2700X 3.7GHz
GeForce RTX 2060 (Desktop)
min:
86 fps, max:
201 fps
fps
99%
GeForce RTX 2070 Mobile:
156 [X] Schenker XMG Ultra 15 Intel Core i7-9700K 3.6GHz
GeForce RTX 2070 Mobile
min:
87 fps
fps
100%
GeForce RTX 2060 (Desktop):
122 [X] AMD Ryzen 7 2700X 3.7GHz
GeForce RTX 2060 (Desktop)
min:
72 fps, max:
171 fps
fps
97%
GeForce RTX 2070 Mobile:
118 [X] Schenker XMG Ultra 15 Intel Core i7-9700K 3.6GHz
GeForce RTX 2070 Mobile
min:
72 fps
fps
100%
GeForce RTX 2060 (Desktop):
53 [X] AMD Ryzen 7 2700X 3.7GHz
GeForce RTX 2060 (Desktop)
min:
39 fps, max:
63 fps
fps
95%
GeForce RTX 2070 Mobile:
50.6 [X] Schenker XMG Ultra 15 Intel Core i7-9700K 3.6GHz
GeForce RTX 2070 Mobile
min:
38 fps
fps
GeForce RTX 2070 Mobile:
349 [X] Schenker XMG Ultra 15 Intel Core i7-9700K 3.6GHz
GeForce RTX 2070 Mobile
min:
292 fps
fps
GeForce RTX 2070 Mobile:
194 [X] Schenker XMG Ultra 15 Intel Core i7-9700K 3.6GHz
GeForce RTX 2070 Mobile
min:
164 fps
fps
GeForce RTX 2070 Mobile:
162 [X] Schenker XMG Ultra 15 Intel Core i7-9700K 3.6GHz
GeForce RTX 2070 Mobile
min:
139 fps
fps
GeForce RTX 2070 Mobile:
55.8 [X] Schenker XMG Ultra 15 Intel Core i7-9700K 3.6GHz
GeForce RTX 2070 Mobile
min:
46 fps
fps
100%
GeForce RTX 2060 (Desktop):
139.2 [X] AMD Ryzen 7 2700X 3.7GHz
GeForce RTX 2060 (Desktop)
min:
107 fps, max:
171 fps
fps
100%
GeForce RTX 2060 (Desktop):
126 [X] AMD Ryzen 7 2700X 3.7GHz
GeForce RTX 2060 (Desktop)
min:
97 fps, max:
158 fps
fps
100%
GeForce RTX 2060 (Desktop):
94.6 [X] AMD Ryzen 7 2700X 3.7GHz
GeForce RTX 2060 (Desktop)
min:
80 fps, max:
106 fps
fps
100%
GeForce RTX 2060 (Desktop):
66 [X] AMD Ryzen 7 2700X 3.7GHz
GeForce RTX 2060 (Desktop)
min:
51 fps, max:
75 fps
fps
100%
GeForce RTX 2060 (Desktop):
38.5 [X] AMD Ryzen 7 2700X 3.7GHz
GeForce RTX 2060 (Desktop)
min:
35 fps, max:
43 fps
fps
GeForce RTX 2070 Mobile:
117 [X] Schenker XMG Ultra 15 Intel Core i7-9700K 3.6GHz
GeForce RTX 2070 Mobile
min:
96 fps
fps
GeForce RTX 2070 Mobile:
105 [X] Schenker XMG Ultra 15 Intel Core i7-9700K 3.6GHz
GeForce RTX 2070 Mobile
min:
88 fps
fps
GeForce RTX 2070 Mobile:
53.3 [X] Schenker XMG Ultra 15 Intel Core i7-9700K 3.6GHz
GeForce RTX 2070 Mobile
min:
43 fps
fps
100%
GeForce RTX 2060 (Desktop):
179 [X] AMD Ryzen 7 2700X 3.7GHz
GeForce RTX 2060 (Desktop)
min:
151 fps, max:
195 fps
fps
92%
GeForce RTX 2070 Mobile:
165.4 fps
100%
GeForce RTX 2060 (Desktop):
162 [X] AMD Ryzen 7 2700X 3.7GHz
GeForce RTX 2060 (Desktop)
min:
147 fps, max:
177 fps
fps
87%
GeForce RTX 2070 Mobile:
141.5 fps
100%
GeForce RTX 2060 (Desktop):
143 [X] AMD Ryzen 7 2700X 3.7GHz
GeForce RTX 2060 (Desktop)
min:
126 fps, max:
154 fps
fps
84%
GeForce RTX 2070 Mobile:
120.6 fps
100%
GeForce RTX 2060 (Desktop):
133 [X] AMD Ryzen 7 2700X 3.7GHz
GeForce RTX 2060 (Desktop)
min:
120 fps, max:
147 fps
fps
85%
GeForce RTX 2070 Mobile:
113.3 fps
100%
GeForce RTX 2060 (Desktop):
59.8 [X] AMD Ryzen 7 2700X 3.7GHz
GeForce RTX 2060 (Desktop)
min:
56 fps, max:
63 fps
fps
GeForce RTX 2070 Mobile:
224.1 fps
GeForce RTX 2070 Mobile:
163.6 fps
GeForce RTX 2070 Mobile:
129.8 fps
GeForce RTX 2070 Mobile:
121.1 fps
100%
GeForce RTX 2060 (Desktop):
149.9 [X] AMD Ryzen 7 2700X 3.7GHz
GeForce RTX 2060 (Desktop)
min:
44 fps, max:
214 fps
fps
100%
GeForce RTX 2060 (Desktop):
140 [X] AMD Ryzen 7 2700X 3.7GHz
GeForce RTX 2060 (Desktop)
min:
91 fps, max:
204 fps
fps
100%
GeForce RTX 2060 (Desktop):
103.5 [X] AMD Ryzen 7 2700X 3.7GHz
GeForce RTX 2060 (Desktop)
min:
82 fps, max:
135 fps
fps
100%
GeForce RTX 2070 Mobile:
103 [X] Schenker XMG Ultra 15 Intel Core i7-9700K 3.6GHz
GeForce RTX 2070 Mobile
min:
78 fps
fps
100%
GeForce RTX 2060 (Desktop):
75.7 [X] AMD Ryzen 7 2700X 3.7GHz
GeForce RTX 2060 (Desktop)
min:
56 fps, max:
100 fps
fps
79%
GeForce RTX 2070 Mobile:
59.8 [X] Schenker XMG Ultra 15 Intel Core i7-9700K 3.6GHz
GeForce RTX 2070 Mobile
min:
45 fps
fps
100%
GeForce RTX 2060 (Desktop):
37.3 [X] AMD Ryzen 7 2700X 3.7GHz
GeForce RTX 2060 (Desktop)
min:
32 fps, max:
46 fps
fps
99%
GeForce RTX 2070 Mobile:
36.9 [X] Schenker XMG Ultra 15 Intel Core i7-9700K 3.6GHz
GeForce RTX 2070 Mobile
min:
31 fps
fps
GeForce RTX 2070 Mobile:
131 [X] Schenker XMG Ultra 15 Intel Core i7-9700K 3.6GHz
GeForce RTX 2070 Mobile
min:
119 fps
fps
GeForce RTX 2070 Mobile:
120 [X] Schenker XMG Ultra 15 Intel Core i7-9700K 3.6GHz
GeForce RTX 2070 Mobile
min:
112 fps
fps
GeForce RTX 2070 Mobile:
45.5 [X] Schenker XMG Ultra 15 Intel Core i7-9700K 3.6GHz
GeForce RTX 2070 Mobile
min:
42 fps
fps
100%
GeForce RTX 2060 (Desktop):
279.9 [X] AMD Ryzen 7 2700X 3.7GHz
GeForce RTX 2060 (Desktop)
min:
274 fps, max:
284 fps
fps
100%
GeForce RTX 2060 (Desktop):
275.2 [X] AMD Ryzen 7 2700X 3.7GHz
GeForce RTX 2060 (Desktop)
min:
263 fps, max:
283 fps
fps
100%
GeForce RTX 2060 (Desktop):
266.8 [X] AMD Ryzen 7 2700X 3.7GHz
GeForce RTX 2060 (Desktop)
min:
216 fps, max:
282 fps
fps
109%
GeForce RTX 2070 Mobile:
291 [X] Schenker XMG Ultra 15 Intel Core i7-9700K 3.6GHz
GeForce RTX 2070 Mobile
min:
247 fps
fps
100%
GeForce RTX 2060 (Desktop):
110.2 [X] AMD Ryzen 7 2700X 3.7GHz
GeForce RTX 2060 (Desktop)
min:
92 fps, max:
126 fps
fps
167%
GeForce RTX 2070 Mobile:
184 [X] Schenker XMG Ultra 15 Intel Core i7-9700K 3.6GHz
GeForce RTX 2070 Mobile
min:
154 fps
fps
100%
GeForce RTX 2060 (Desktop):
102.2 [X] AMD Ryzen 7 2700X 3.7GHz
GeForce RTX 2060 (Desktop)
min:
86 fps, max:
119 fps
fps
99%
GeForce RTX 2070 Mobile:
101 [X] Schenker XMG Ultra 15 Intel Core i7-9700K 3.6GHz
GeForce RTX 2070 Mobile
min:
85 fps
fps
100%
GeForce RTX 2060 (Desktop):
164.4 [X] AMD Ryzen 7 2700X 3.7GHz
GeForce RTX 2060 (Desktop)
min:
84 fps, max:
201 fps
fps
100%
GeForce RTX 2060 (Desktop):
149.2 [X] AMD Ryzen 7 2700X 3.7GHz
GeForce RTX 2060 (Desktop)
min:
114 fps, max:
191 fps
fps
100%
GeForce RTX 2060 (Desktop):
141.3 [X] AMD Ryzen 7 2700X 3.7GHz
GeForce RTX 2060 (Desktop)
min:
97 fps, max:
198 fps
fps
130%
GeForce RTX 2070 Mobile:
184 [X] Schenker XMG Ultra 15 Intel Core i7-9700K 3.6GHz
GeForce RTX 2070 Mobile
min:
163 fps
fps
100%
GeForce RTX 2060 (Desktop):
139.5 [X] AMD Ryzen 7 2700X 3.7GHz
GeForce RTX 2060 (Desktop)
min:
94 fps, max:
195 fps
fps
114%
GeForce RTX 2070 Mobile:
159 [X] Schenker XMG Ultra 15 Intel Core i7-9700K 3.6GHz
GeForce RTX 2070 Mobile
min:
132 fps
fps
100%
GeForce RTX 2060 (Desktop):
78.7 [X] AMD Ryzen 7 2700X 3.7GHz
GeForce RTX 2060 (Desktop)
min:
66 fps, max:
98 fps
fps
86%
GeForce RTX 2070 Mobile:
67.4 [X] Schenker XMG Ultra 15 Intel Core i7-9700K 3.6GHz
GeForce RTX 2070 Mobile
min:
59 fps
fps
GeForce RTX 2070 Mobile:
112.4 fps
GeForce RTX 2070 Mobile:
102 fps
GeForce RTX 2070 Mobile:
98.6 fps
100%
GeForce RTX 2060 (Desktop):
278 [X] AMD Ryzen 7 2700X 3.7GHz
GeForce RTX 2060 (Desktop)
fps
100%
GeForce RTX 2060 (Desktop):
218 [X] AMD Ryzen 7 2700X 3.7GHz
GeForce RTX 2060 (Desktop)
fps
100%
GeForce RTX 2060 (Desktop):
120 [X] AMD Ryzen 7 2700X 3.7GHz
GeForce RTX 2060 (Desktop)
fps
98%
GeForce RTX 2070 Mobile:
118 [X] Schenker XMG Ultra 15 Intel Core i7-9700K 3.6GHz
GeForce RTX 2070 Mobile
min:
68 fps
fps
100%
GeForce RTX 2060 (Desktop):
95 [X] AMD Ryzen 7 2700X 3.7GHz
GeForce RTX 2060 (Desktop)
fps
98%
GeForce RTX 2070 Mobile:
93.1 [X] Schenker XMG Ultra 15 Intel Core i7-9700K 3.6GHz
GeForce RTX 2070 Mobile
min:
61 fps
fps
100%
GeForce RTX 2060 (Desktop):
49 [X] AMD Ryzen 7 2700X 3.7GHz
GeForce RTX 2060 (Desktop)
fps
94%
GeForce RTX 2070 Mobile:
46.3 [X] Schenker XMG Ultra 15 Intel Core i7-9700K 3.6GHz
GeForce RTX 2070 Mobile
min:
20 fps
fps
100%
GeForce RTX 2060 (Desktop):
119 [X] AMD Ryzen 7 2700X 3.7GHz
GeForce RTX 2060 (Desktop)
min:
93 fps, max:
136 fps
fps
100%
GeForce RTX 2060 (Desktop):
107 [X] AMD Ryzen 7 2700X 3.7GHz
GeForce RTX 2060 (Desktop)
min:
81 fps, max:
126 fps
fps
100%
GeForce RTX 2060 (Desktop):
97 [X] AMD Ryzen 7 2700X 3.7GHz
GeForce RTX 2060 (Desktop)
min:
74 fps, max:
112 fps
fps
100%
GeForce RTX 2060 (Desktop):
91 [X] AMD Ryzen 7 2700X 3.7GHz
GeForce RTX 2060 (Desktop)
min:
66 fps, max:
109 fps
fps
100%
GeForce RTX 2060 (Desktop):
50 [X] AMD Ryzen 7 2700X 3.7GHz
GeForce RTX 2060 (Desktop)
min:
46 fps, max:
55 fps
fps
100%
GeForce RTX 2060 (Desktop):
268 [X] AMD Ryzen 7 2700X 3.7GHz
GeForce RTX 2060 (Desktop)
min:
254 fps, max:
281 fps
fps
100%
GeForce RTX 2060 (Desktop):
189 [X] AMD Ryzen 7 2700X 3.7GHz
GeForce RTX 2060 (Desktop)
min:
151 fps, max:
201 fps
fps
100%
GeForce RTX 2060 (Desktop):
136 [X] AMD Ryzen 7 2700X 3.7GHz
GeForce RTX 2060 (Desktop)
min:
127 fps, max:
149 fps
fps
100%
GeForce RTX 2060 (Desktop):
113 [X] AMD Ryzen 7 2700X 3.7GHz
GeForce RTX 2060 (Desktop)
min:
102 fps, max:
124 fps
fps
100%
GeForce RTX 2060 (Desktop):
47.3 [X] AMD Ryzen 7 2700X 3.7GHz
GeForce RTX 2060 (Desktop)
min:
43 fps, max:
55 fps
fps
100%
GeForce RTX 2060 (Desktop):
244 [X] AMD Ryzen 7 2700X 3.7GHz
GeForce RTX 2060 (Desktop)
min:
80 fps, max:
509 fps
fps
100%
GeForce RTX 2060 (Desktop):
297 [X] AMD Ryzen 7 2700X 3.7GHz
GeForce RTX 2060 (Desktop)
min:
62 fps, max:
456 fps
fps
100%
GeForce RTX 2060 (Desktop):
238 [X] AMD Ryzen 7 2700X 3.7GHz
GeForce RTX 2060 (Desktop)
min:
73 fps, max:
319 fps
fps
98%
GeForce RTX 2070 Mobile:
234 [X] Schenker XMG Ultra 15 Intel Core i7-9700K 3.6GHz
GeForce RTX 2070 Mobile
min:
56 fps
fps
100%
GeForce RTX 2060 (Desktop):
223 [X] AMD Ryzen 7 2700X 3.7GHz
GeForce RTX 2060 (Desktop)
min:
40 fps, max:
277 fps
fps
97%
GeForce RTX 2070 Mobile:
216 [X] Schenker XMG Ultra 15 Intel Core i7-9700K 3.6GHz
GeForce RTX 2070 Mobile
min:
42 fps
fps
100%
GeForce RTX 2060 (Desktop):
97 [X] AMD Ryzen 7 2700X 3.7GHz
GeForce RTX 2060 (Desktop)
min:
78 fps, max:
112 fps
fps
96%
GeForce RTX 2070 Mobile:
93.3 [X] Schenker XMG Ultra 15 Intel Core i7-9700K 3.6GHz
GeForce RTX 2070 Mobile
min:
34 fps
fps
GeForce RTX 2070 Mobile:
129.7 137.3 137.4 142 147.2 [X] MSI GL75 10SFR Intel Core i7-10750H 2.6GHz
GeForce RTX 2070 Mobile
min:
127.5 fps, max:
-1 fps
149 152 [X] MSI GP65 10SFK-047US Intel Core i7-10750H 2.6GHz
GeForce RTX 2070 Mobile
min:
131.6 fps, max:
-1 fps
152 153 ~ 144 fps
GeForce RTX 2070 Mobile:
104.1 115 121.8 [X] MSI GL75 10SFR Intel Core i7-10750H 2.6GHz
GeForce RTX 2070 Mobile
min:
107.5 fps, max:
-1 fps
122.1 124 125 128 [X] MSI GP65 10SFK-047US Intel Core i7-10750H 2.6GHz
GeForce RTX 2070 Mobile
min:
111.7 fps, max:
-1 fps
130 131 ~ 122 fps
GeForce RTX 2070 Mobile:
98.4 109.2 115 [X] MSI GL75 10SFR Intel Core i7-10750H 2.6GHz
GeForce RTX 2070 Mobile
min:
101 fps, max:
-1 fps
117 117.1 120 [X] MSI GP65 10SFK-047US Intel Core i7-10750H 2.6GHz
GeForce RTX 2070 Mobile
min:
104.9 fps, max:
-1 fps
120 122 124 ~ 116 fps
GeForce RTX 2070 Super Max-Q:
103 fps
GeForce RTX 2070 Mobile:
214 fps
GeForce RTX 2070 Mobile:
202 fps
GeForce RTX 2070 Mobile:
159 fps
GeForce RTX 2070 Mobile:
108 fps
100%
GeForce RTX 2060 (Desktop):
286.7 [X] AMD Ryzen 7 2700X 3.7GHz
GeForce RTX 2060 (Desktop)
min:
265 fps, max:
336 fps
fps
100%
GeForce RTX 2060 (Desktop):
204.5 [X] AMD Ryzen 7 2700X 3.7GHz
GeForce RTX 2060 (Desktop)
min:
163 fps, max:
231 fps
fps
100%
GeForce RTX 2060 (Desktop):
135.7 [X] AMD Ryzen 7 2700X 3.7GHz
GeForce RTX 2060 (Desktop)
min:
113 fps, max:
150 fps
fps
100%
GeForce RTX 2060 (Desktop):
72.7 [X] AMD Ryzen 7 2700X 3.7GHz
GeForce RTX 2060 (Desktop)
min:
61 fps, max:
82 fps
fps
103%
GeForce RTX 2070 Super Max-Q:
62.7 70.5 71.9 [X] MSI GS66 Stealth 10SFS BIOS-Update Intel Core i9-10980HK 2.4GHz
GeForce RTX 2070 Super Max-Q
min:
60 fps
73.6 [X] Aorus 17G XB Intel Core i7-10875H 2.3GHz
GeForce RTX 2070 Super Max-Q
min:
62 fps
74 75.3 75.5 [X] Aorus 15G XB Intel Core i7-10875H 2.3GHz
GeForce RTX 2070 Super Max-Q
min:
63 fps
76.2 [X] Gigabyte Aero 15 OLED XB Dynamic Boost Off Intel Core i7-10875H 2.3GHz
GeForce RTX 2070 Super Max-Q
min:
64 fps
79.1 92.5 ~ 75 fps
102%
GeForce RTX 2070 Mobile:
64 67 70.2 70.9 71.8 71.8 72 72.8 [X] Schenker XMG Ultra 15 Intel Core i7-9700K 3.6GHz
GeForce RTX 2070 Mobile
min:
61 fps
73 73 73.8 74.4 74.5 74.8 [X] Asus ROG Strix SCAR III G531GW-AZ062T Intel Core i7-9750H 2.6GHz
GeForce RTX 2070 Mobile
75.9 [X] Asus ROG Zephyrus S GX502GW Intel Core i7-9750H 2.6GHz
GeForce RTX 2070 Mobile
78.2 78.4 79.9 80.6 81 82.1 [X] MSI GP65 10SFK-047US Intel Core i7-10750H 2.6GHz
GeForce RTX 2070 Mobile
min:
77 fps, max:
86 fps
~ 74 fps
100%
GeForce RTX 2060 (Desktop):
51.3 [X] AMD Ryzen 7 2700X 3.7GHz
GeForce RTX 2060 (Desktop)
min:
44 fps, max:
58 fps
fps
99%
GeForce RTX 2070 Super Max-Q:
49.7 50.5 [X] Gigabyte Aero 15 OLED XB Dynamic Boost Off Intel Core i7-10875H 2.3GHz
GeForce RTX 2070 Super Max-Q
min:
43 fps
52.9 ~ 51 fps
101%
GeForce RTX 2070 Mobile:
49.5 50 [X] Schenker XMG Ultra 15 Intel Core i7-9700K 3.6GHz
GeForce RTX 2070 Mobile
min:
44 fps
57.4 ~ 52 fps
GeForce RTX 2070 Mobile:
254.5 fps
GeForce RTX 2070 Mobile:
160.6 fps
GeForce RTX 2070 Mobile:
199.7 fps
GeForce RTX 2070 Mobile:
113.6 fps
100%
GeForce RTX 2060 (Desktop):
174.4 [X] AMD Ryzen 7 2700X 3.7GHz
GeForce RTX 2060 (Desktop)
fps
104%
GeForce RTX 2070 Super Max-Q:
182 182 182 182 [X] Aorus 17G XB Intel Core i7-10875H 2.3GHz
GeForce RTX 2070 Super Max-Q
min:
3.97 fps, P1:
143 fps, max:
340 fps
~ 182 fps
100%
GeForce RTX 2060 (Desktop):
166.4 [X] AMD Ryzen 7 2700X 3.7GHz
GeForce RTX 2060 (Desktop)
fps
106%
GeForce RTX 2070 Super Max-Q:
174 175 176 177 [X] Aorus 17G XB Intel Core i7-10875H 2.3GHz
GeForce RTX 2070 Super Max-Q
min:
4.1 fps, P1:
125 fps, max:
374 fps
~ 176 fps
100%
GeForce RTX 2060 (Desktop):
148.4 [X] AMD Ryzen 7 2700X 3.7GHz
GeForce RTX 2060 (Desktop)
fps
106%
GeForce RTX 2070 Super Max-Q:
153 159 [X] Aorus 17G XB Intel Core i7-10875H 2.3GHz
GeForce RTX 2070 Super Max-Q
min:
4.33 fps, P1:
111 fps, max:
391 fps
160 161 ~ 158 fps
100%
GeForce RTX 2060 (Desktop):
100.5 [X] AMD Ryzen 7 2700X 3.7GHz
GeForce RTX 2060 (Desktop)
fps
89%
GeForce RTX 2070 Super Max-Q:
83.4 89.9 91.1 [X] Aorus 17G XB Intel Core i7-10875H 2.3GHz
GeForce RTX 2070 Super Max-Q
min:
9.54 fps, P1:
58.8 fps, max:
197 fps
91.3 ~ 89 fps
80%
GeForce RTX 2070 Mobile:
71.4 82 87 ~ 80 fps
100%
GeForce RTX 2060 (Desktop):
66.7 [X] AMD Ryzen 7 2700X 3.7GHz
GeForce RTX 2060 (Desktop)
fps
110%
GeForce RTX 2070 Super Max-Q:
73.1 fps
100%
GeForce RTX 2060 (Desktop):
199.4 [X] AMD Ryzen 7 2700X 3.7GHz
GeForce RTX 2060 (Desktop)
min:
185 fps, max:
202 fps
fps
100%
GeForce RTX 2060 (Desktop):
199.6 [X] AMD Ryzen 7 2700X 3.7GHz
GeForce RTX 2060 (Desktop)
min:
184.201 fps
fps
100%
GeForce RTX 2060 (Desktop):
199.8 [X] AMD Ryzen 7 2700X 3.7GHz
GeForce RTX 2060 (Desktop)
min:
188 fps, max:
201 fps
fps
100%
GeForce RTX 2060 (Desktop):
163.9 [X] AMD Ryzen 7 2700X 3.7GHz
GeForce RTX 2060 (Desktop)
min:
149 fps, max:
194 fps
fps
100%
GeForce RTX 2060 (Desktop):
55.4 [X] AMD Ryzen 7 2700X 3.7GHz
GeForce RTX 2060 (Desktop)
min:
48 fps, max:
67 fps
fps
GeForce RTX 2070 Super Max-Q:
420.2 fps
GeForce RTX 2070 Super Max-Q:
359.5 fps
GeForce RTX 2070 Super Max-Q:
329.8 fps
GeForce RTX 2070 Super Max-Q:
166.5 fps
Average Gaming NVIDIA GeForce RTX 2060 (Desktop) → 100% Average Gaming 30-70 fps → 100%
Average Gaming NVIDIA GeForce RTX 2070 Super Max-Q → 101% Average Gaming 30-70 fps → 103%
Average Gaming NVIDIA GeForce RTX 2070 Mobile → 98% Average Gaming 30-70 fps → 101%
 Deutsch
 English
 Español
 Français
 Italiano
 Nederlands
 Polski
 Português
 Русский
 Türkçe
 Svenska
 Chinese
 Magyar