Intel HD Graphics (Bay Trail) vs Intel HD Graphics 2000 vs Intel HD Graphics 5000
Intel HD Graphics (Bay Trail) ► remove from comparison
Die Intel HD Graphics (Bay Trail) ist eine in den Tablet- (z.B. Z3770 ), Nettop- (z.B. J2850 ) und Notebook-SoCs (z.B. N3510 ) der Bay-Trail-Serie integrierte Grafikeinheit. Sie ist in verschiedenen Atom-, Celeron- und Pentium-Modellen zu finden und basiert auf der DirectX-11-tauglichen GPU der Ivy-Bridge-Generation . Taktrate und Einheitenzahl fallen allerdings deutlich niedriger aus, sodass sich die Performance nur im Low-End-Segment ansiedelt.
Im Vergleich zu Ivy Bridge, dessen Gen-7-GPU entweder 6 oder 16 Executions Units bietet, kommt die HD Graphics (Bay Trail) nur mit lediglich 4 EUs daher. Abhängig von Temperatur und Leistungsaufnahme kann die niedrige Basisfrequenz dynamisch bis auf den maximalen Turbo-Takt angehoben werden, der ja nach Modell bei bis zu 896 MHz liegt. Ebenfalls modellabhängig ist das Speicherinterface, welches im Single- oder Dual-Channel-Betrieb sowie mit verschiedene Speicherstandards (DDR3(L), DDR3L-RS, LPDDR3) arbeiten kann. Insbesondere Varianten mit einem nur 32 Bit breiten Interface (Atom Z3735G ) verlieren teils erheblich an Performance.
Die schnellsten Notebook-Modelle erreichen knapp die Performance der HD Graphics (Sandy Bridge) sowie der Radeon HD 6310 . Das reicht, um einige ältere und sehr anspruchslose Windows-Spiele wie World of Warcraft oder Half-Life 2 in niedrigen Einstellungen flüssig darzustellen. Für aktuelle Windows-Titel ist die GPU dagegen praktisch nicht geeignet.
Verglichen mit konkurrierenden ARM-SoCs ordnet sich die Grafikeinheit dagegen im unteren High-End-Segment ein und übertrifft knapp die Adreno 320 , die in verschiedenen Qualcomm-SoCs wie dem Snapdragon 600 zu finden ist. Damit entspricht Grafik-Performance in etwa Nvidias Tegra 4 . Auch sehr aufwändige Android-Spiele werden damit in hohen Auflösungen flüssig bewältigt (Stand 2013).
Der integrierte Videodecoder unterstützt alle gängigen Codecs wie MPEG2, H.264, VC1, MVC oder VP8 und ist für Auflösungen bis 4K (maximal 100 Mbit/s) geeignet. Das Bildsignal kann per HDMI 1.4 (max. 1.920 x 1.080) oder DisplayPort 1.2 (max. 2.560 x 1.600) an bis zu zwei Displays ausgegeben werden. Eine weitere Neuerung ist die Unterstützung von Wireless Display sowie Quick Sync , Intels schnellem und sparsamen H-264-Hardwareencoder. Einige dieser Features sind jedoch nicht bei allen Modellen verfügbar.
Je nach Modell liegt die Leistungsaufnahme des gesamten SoCs zwischen rund 2 und 10 Watt. Die besonders sparsamen Versionen sind damit auch für passiv gekühlte Tablets geeignet, andere werden in größeren (Sub-) Notebooks mit aktiver Kühlung eingesetzt.
Intel HD Graphics 2000 ► remove from comparison
Die Intel HD Graphics 2000 (oder Intel Graphics Media Accelerator HD 2000 oder GMA HD 2000) ist eine in den Sandy Bridge Prozessoren integrierte Grafikkarte. Sie komm in den meisten Desktop CPU zum Einsatz und heisst in den günstigen mobilen Prozessoren (Celeron und Pentium) nur Intel HD Graphics . Die HD Graphics 2000 bietet keinen eigenen dedizierten Speicher, teilt sich jedoch den sehr schnellen Level 3 Cache mit den Prozessorkernen. Der restliche Speicher wird vom Hauptspeicher abgezwackt (wie bei der Vorgänger-Grafikkarte Intel HD Graphics ). Dank Turbo Boost kann sich die Grafikkarte wie die Prozessorkerne in gewissen Lastsituationen übertakten (bei ausreichend Kühlung). Die Intel GMA HD2000 bietet nur die Hälfte der 12 Execution Units (EUs) der GMA HD 3000 und ist dadurch deutlich langsamer.
Je nach Prozessor weist die HD Graphics 2000 eine unterschiedliche Basis- und Turbo-Taktrate auf. Im Desktop Einsteigs Core i3-2100 z.B. 850 bzw 1100 MHz. Im schnellen i7-2600 850 bzw. 1350MHz. Die mobilen Ableger werden wahrscheinlich deutlich geringer getaktet sein.
Unsere Performance Tests haben wir mit einem i5-2400 Desktop Prozessor durchgeführt. Dieser taktet die Grafikkarte mit 850MHz bzw 1100MHz (Turbo Boost). In den Spieletests plazierte sich die HD Graphics 2000 etwa auf dem Niveau einer Geforce G 105M und damit leicht oberhalb der alten Intel HD Graphics Grafikkarte. Damit sind anspruchslose Spiele wie Sims 3 oder World of Warcraft in niedrigen Details flüssig spielbar (mit einer ausreichend starken CPU).
Wie bei den Ivy Bridge basierten Grafikkarten, wird anscheinend auch bei Sandy Bridge 2x Antialiasing per Software aus dem 4x Antialiasing errechnet. Daher ergibt sich kein Geschwindigkeitsunterschied zwischen 2x und 4x AA. Im Unigine Valley Benchmark erreichten wir als Bestätigung bei 2x AA und 4x AA das selbe Ergebnis (HD Graphics 3000 ULV im i7-2637M).
Neben der GPU ist auch noch eine dedizierte Einheit zum Dekodieren und auch Encodieren von HD Videos in den Sandy Bridge Prozessoren enthalten. Um ein dreiminütiges 1080p-Video für das iPhone in das Format 640x360 zu wandeln, braucht Sandy Bridge laut Intel etwa 14s (IDF 2010). Eine weitere Besonderheit ist der unterstützte "embedded DisplayPort" eDP um interne Displays anzusteuern.
Aufgrund der Integration in den mit 32nm gefertigten Prozessor und die halbierte Shaderzahl, ist der Stromverbrauch relativ gering und eignet sich auch für flache und kleine Notebooks.
Intel HD Graphics 5000 ► remove from comparison
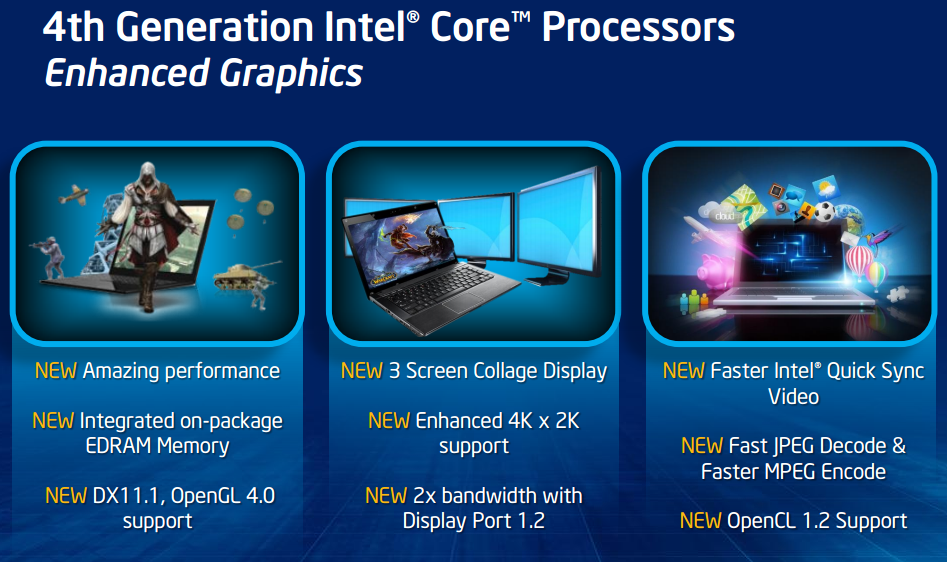
Die Intel HD Graphics 5000 (GT3) ist eine Prozessorgrafikkarte in den CPUs der Haswell- Generation. Zunächst wird die GPU in einigen ULV-Modellen mit 15 Watt TDP eingesetzt (z.B. Core i5-4250U ). Sie stellt die maximale Ausbaustufe der integrierten Grafikeinheit dar (40 Execution Units), muss im Gegensatz zur Iris Pro (GT3e) aber auf den zusätzlichen eDRAM-Cache verzichten. Abhängig von der Taktrate (diese fällt bei den 15-Watt-Modellen relativ niedrig aus) sowie der Hauptspeicheranbindung kann sich die Performance von Modell zu Modell leicht unterscheiden.
Der Grafikkern wurde im Vergleich zum Intel HD Graphics 4000 der Ivy-Bridge-Generation in verschiedenen Punkten weiterentwickelt. So unterstützt die GPU nun mit DirectX 11.1, OpenCL 1.2 und OpenGL 4.0 alle wichtigen aktuellen Standards. Auch ein verbesserter Decoder für 4K-Videos sowie ein überarbeiteter Quick-Sync-Encoder sind mit an Bord.
Die Performance der HD Graphics 5000 liegt im 3DMark 11 um etwa 50 Prozent oberhalb der HD 4000 der Vorgängergeneration. In Spielen fällt die Mehrleistung dagegen deutlich geringer aus: Bei gleichzeitiger Belastung der CPU kann die Grafikeinheit ihren starken Turbo-Boost nur sehr eingeschränkt ausschöpfen, da die niedrige TDP der ULV-Modelle (15 Watt) zu limitieren beginnt. Obwohl die HD 5000 mit 40 Execution Units (EUs) doppelt so viele Ausführungseinheiten wie die HD Graphics 4600 besitzt (HD 4000 : 16 EUs), ist die Grafikleistung darum dennoch etwas schwächer. Unterm Strich liegt die HD 5000 damit knapp hinter AMDs Radeon HD 7660G und auf dem Niveau einer dedizierte Radeon HD 7650M . Aktuelle 3D-Spiele (Stand 2013) können in niedrigen, seltener auch mittleren Einstellungen flüssig dargestellt werden.
Der Stromverbrauch ist dank des 22-Nanometer-Prozesses mit Tri-Gate-Transistoren relativ gering und wird dynamisch vom TDP-Budget des gesamten Chips abgezweigt. Die HD 5000 wird zunächst in einigen Dual-Core-Modellen der 15-Watt-Klasse (ULV) eingesetzt, beispielsweise dem Core i7-4650U .
Weitere Details zur Grafikkartenarchitektur der Haswell Generation finden Sie in unserem Artikel zur Vorstellung der Haswell-Generation .
Intel HD Graphics (Bay Trail) Intel HD Graphics 2000 Intel HD Graphics 5000 HD Graphics Serie Codename Bay Trail Sandy Bridge Haswell GT3 Architektur Gen. 7 Ivy Bridge Gen. 6 Sandy Bridge Gen. 7.5 Haswell Pipelines 4 - unified 6 - unified 40 - unified Kerntakt 311 - 896 (Boost) MHz 850/1100 - 1350 (Boost) MHz 200 - 1100 (Boost) MHz Speicherbandbreite 32/64/128 Bit 64/128 Bit 64/128 Bit Shared Memory ja ja ja API DirectX 11, Shader 5.0, OpenGL 4.0, ES 3.0 DirectX 10.1, Shader 4.1 DirectX 11.1, Shader 5.0, OpenGL 4.0 Herstellungsprozess 22 nm 32 nm 22 nm Erscheinungsdatum 11.09.2013 01.02.2011 05.06.2013 Features QuickSync
CPU in HD Graphics (Bay Trail) GPU Base Speed GPU Boost / Turbo Intel Pentium N3540 4 x 2160 MHz, 7.5 W 313 MHz 896 MHz Intel Pentium J2900 4 x 2410 MHz, 10 W 688 MHz 896 MHz Intel Pentium N3530 4 x 2160 MHz, 7.5 W 313 MHz 896 MHz » show 43 more Intel Pentium J2850 4 x 2400 MHz, 10 W 688 MHz 792 MHz Intel Pentium N3520 4 x 2167 MHz, 7.5 W 313 MHz 854 MHz Intel Celeron J1900 4 x 2000 MHz, 10 W 688 MHz 854 MHz Intel Atom Z3795 4 x 1590 MHz, <4 W 311 MHz 778 MHz Intel Atom Z3785 4 x 1490 MHz, <4 W 313 MHz 833 MHz Intel Atom Z3775 4 x 1460 MHz, <4 W 311 MHz 778 MHz Intel Atom Z3775D 4 x 1490 MHz, <4 W 311 MHz 792 MHz Intel Atom Z3770 4 x 1460 MHz, <4 W 311 MHz 667 MHz Intel Atom Z3770D 4 x 1500 MHz, 4 W 313 MHz 688 MHz Intel Celeron N2940 4 x 1830 MHz, 7.5 W 313 MHz 854 MHz Intel Celeron N2930 4 x 1830 MHz, 7.5 W 313 MHz 854 MHz Intel Celeron J1850 4 x 2000 MHz, 10 W 688 MHz 792 MHz Intel Pentium N3510 4 x 2000 MHz, 7.5 W 313 MHz 750 MHz Intel Celeron N2920 4 x 1860 MHz, 7.5 W 313 MHz 854 MHz Intel Atom E3845 4 x 1910 MHz, 10 W 542 MHz 792 MHz Intel Atom Z3736F 4 x 1330 MHz, 4 W 313 MHz 646 MHz Intel Atom Z3736G 4 x 1330 MHz, <4 W 313 MHz 646 MHz Intel Atom Z3745 4 x 1330 MHz, <4 W 311 MHz 778 MHz Intel Atom Z3745D 4 x 1330 MHz, <4 W 311 MHz 792 MHz Intel Atom Z3740 4 x 1330 MHz, <4 W 311 MHz 667 MHz Intel Atom Z3740D 4 x 1330 MHz, <4 W 313 MHz 688 MHz Intel Atom Z3735D 4 x 1330 MHz, <4 W 311 MHz 646 MHz Intel Atom Z3735E 4 x 1330 MHz, <4 W 311 MHz 646 MHz Intel Atom Z3735F 4 x 1330 MHz, <4 W 311 MHz 646 MHz Intel Atom Z3735G 4 x 1330 MHz, <4 W 311 MHz 646 MHz Intel Celeron J1800 2 x 2410 MHz, 10 W 688 MHz 792 MHz Intel Celeron N2840 2 x 2160 MHz, 7.5 W 313 MHz 792 MHz Intel Celeron J1750 2 x 2410 MHz, 10 W 688 MHz 750 MHz Intel Celeron N2910 4 x 1600 MHz, 7.5 W 313 MHz 756 MHz Intel Celeron N2830 2 x 2160 MHz, 7.5 W 313 MHz 750 MHz Intel Celeron N2820 2 x 2170 MHz, 7.5 W 313 MHz 756 MHz Intel Celeron N2815 2 x 1860 MHz, 7.5 W 313 MHz 756 MHz Intel Celeron N2810 2 x 2000 MHz, 7.5 W 313 MHz 756 MHz Intel Atom Z3680 2 x 1330 MHz, 4 W 311 MHz 667 MHz Intel Atom Z3680D 2 x 1330 MHz, 4 W 313 MHz 688 MHz Intel Celeron N2808 2 x 1580 MHz, 4.3 W 313 MHz 792 MHz Intel Celeron N2807 2 x 1580 MHz, 4.3 W 313 MHz 750 MHz Intel Celeron N2806 2 x 1580 MHz, 4.5 W 313 MHz 756 MHz Intel Atom E3827 2 x 1750 MHz, 8 W 542 MHz 792 MHz Intel Atom E3826 2 x 1460 MHz, 7 W 533 MHz 667 MHz Intel Celeron N2805 2 x 1460 MHz, 4.3 W 313 MHz 667 MHz Intel Atom E3825 2 x 1330 MHz, 6 W ? MHz 533 MHz Intel Atom E3815 1 x 1460 MHz, 5 W ? MHz 400 MHz min. - max. 311 - ? MHz 400 - 896 MHz
CPU in HD Graphics 2000 GPU Base Speed GPU Boost / Turbo Intel Core i5-2400 4 x 3100 MHz, 95 W 850 MHz 1100 MHz
CPU in HD Graphics 5000 GPU Base Speed GPU Boost / Turbo Intel Core i7-4650U 2 x 1700 MHz, 15 W 200 MHz 1100 MHz Intel Core i7-4550U 2 x 1500 MHz, 15 W 200 MHz 1100 MHz Intel Core i5-4360U 2 x 1500 MHz, 15 W 200 MHz 1100 MHz » show 3 more Intel Core i5-4350U 2 x 1400 MHz, 15 W 200 MHz 1100 MHz Intel Core i5-4260U 2 x 1400 MHz, 15 W 200 MHz 1000 MHz Intel Core i5-4250U 2 x 1300 MHz, 15 W 200 MHz 1000 MHz min. - max. 200 - ? MHz 400 - 1100 MHz
Benchmarks Performance Rating - 3DMark 11 + Fire Strike + Time Spy - HD Graphics (Bay Trail)
0.1 pt (0%)
Intel HD Graphics (Bay Trail)
...
max:
Performance Rating - 3DMark 11 + Fire Strike + Time Spy - HD Graphics 5000
0.3 pt (1%)
...
...
max:
3DMark - 3DMark Ice Storm Unlimited Graphics
min: 11835 avg: 14513 median: 14748.5 (2%) max: 17613 Points
65904 Points (7%)
3DMark - 3DMark Ice Storm Extreme Graphics
min: 4751 avg: 7342 median: 7498 (1%) max: 9234 Points
37346 Points (5%)
3DMark - 3DMark Cloud Gate Score
min: 354 avg: 1182 median: 1188 (1%) max: 1703 Points
min: 4331 avg: 4586 median: 4496.5 (5%) max: 5059 Points
3DMark - 3DMark Cloud Gate Graphics
min: 362 avg: 1230 median: 1228.5 (0%) max: 1670 Points
min: 5381 avg: 5981 median: 5693.5 (1%) max: 6762 Points
3DMark - 3DMark Fire Strike Standard Score
min: 83 avg: 185 median: 147 (0%) max: 495 Points
min: 583 avg: 669 median: 651 (1%) max: 808 Points
3DMark - 3DMark Fire Strike Standard Graphics
min: 90 avg: 149.1 median: 149 (0%) max: 200 Points
min: 620 avg: 725 median: 715.5 (1%) max: 875 Points
3DMark - 3DMark Ice Storm Graphics
min: 5056 avg: 15391 median: 16047 (2%) max: 21351 Points
min: 35584 avg: 41867 median: 40454 (5%) max: 52302 Points
3DMark 11 - 3DM11 Performance Score
min: 143 avg: 222.6 median: 216 (0%) max: 280 Points
min: 962 avg: 1088 median: 1125.5 (2%) max: 1163 Points
3DMark 11 - 3DM11 Performance GPU
min: 122 avg: 192.1 median: 186.5 (0%) max: 237 Points
min: 859 avg: 993 median: 1033.5 (1%) max: 1072 Points
3DMark Vantage + Intel HD Graphics (Bay Trail) 3DMark Vantage - 3DM Vant. Perf. total
min: 507 avg: 666 median: 637 (0%) max: 846 Points
3DM Vant. Perf. total + Intel HD Graphics 2000 min: 789 avg: 896 median: 895.5 (0%) max: 1002 Points
3DM Vant. Perf. total + Intel HD Graphics 5000
min: 3418 avg: 4231 median: 4276.5 (1%) max: 4734 Points
3DM Vant. Perf. GPU no PhysX + Intel HD Graphics (Bay Trail) 3DMark Vantage - 3DM Vant. Perf. GPU no PhysX
min: 395 avg: 512 median: 503 (0%) max: 667 Points
3DM Vant. Perf. GPU no PhysX + Intel HD Graphics 2000 min: 626 avg: 695 median: 694.5 (0%) max: 763 Points
3DM Vant. Perf. GPU no PhysX + Intel HD Graphics 5000
min: 2917 avg: 3639 median: 3665 (2%) max: 4108 Points
3DMark 2001SE - 3DMark 2001 - Standard
7727 Points (8%)
15201 Points (16%)
3DMark 03 - 3DMark 03 - Standard
min: 4226 avg: 4997 median: 5220 (3%) max: 5323 Points
min: 6077 avg: 7083 median: 7083 (4%) max: 8089 Points
min: 15752 avg: 18768 median: 18768 (10%) max: 21784 Points
3DMark 05 - 3DMark 05 - Standard
min: 2666 avg: 3195 median: 3331 (4%) max: 3445 Points
min: 4585 avg: 5194 median: 5193.5 (6%) max: 5802 Points
min: 9623 avg: 9763 median: 9763 (11%) max: 9903 Points
3DMark 06 3DMark 06 - Score Unknown Settings + Intel HD Graphics (Bay Trail)
2108 Points (3%)
3DMark 06 - Standard 1280x1024 + Intel HD Graphics (Bay Trail)
min: 814 avg: 1785 median: 1866 (2%) max: 2151 Points
3DMark 06 - Standard 1280x1024 + Intel HD Graphics 2000
min: 1217 avg: 2222 median: 2288 (3%) max: 3162 Points
3DMark 06 - Standard 1280x1024 + Intel HD Graphics 5000
min: 4751 avg: 5775 median: 5940 (8%) max: 6160 Points
3DMark 06 - Standard 1280x800 + Intel HD Graphics (Bay Trail)
2087 Points (3%)
3DMark 06 - Standard 1280x800 + Intel HD Graphics 5000
6675 Points (9%)
Unigine Heaven 3.0 - Unigine Heaven 3.0 DX 11
3.6 fps (1%)
12.1 fps (4%)
Unigine Heaven 3.0 - Unigine Heaven 3.0 OpenGL
12.1 fps (5%)
Unigine Heaven 2.1 - Heaven 2.1 high
min: 2.4 avg: 2.8 median: 2.8 (1%) max: 3.4 fps
5.3 fps (1%)
min: 12.3 avg: 13 median: 13.1 (2%) max: 13.5 fps
SPECviewperf 11 + Intel HD Graphics 5000 SPECviewperf 11 - specvp11 snx-01
min: 1.26 avg: 1.5 median: 1.5 (1%) max: 1.64 fps
specvp11 tcvis-02 + Intel HD Graphics 5000 SPECviewperf 11 - specvp11 tcvis-02
min: 1.77 avg: 2.1 median: 2.1 (1%) max: 2.51 fps
specvp11 sw-02 + Intel HD Graphics 5000 SPECviewperf 11 - specvp11 sw-02
min: 7.95 avg: 9.9 median: 9.9 (8%) max: 11.8 fps
specvp11 proe-05 + Intel HD Graphics 5000 SPECviewperf 11 - specvp11 proe-05
min: 1.42 avg: 1.6 median: 1.6 (2%) max: 1.78 fps
specvp11 maya-03 + Intel HD Graphics 5000 SPECviewperf 11 - specvp11 maya-03
min: 12.95 avg: 14.2 median: 14.2 (11%) max: 15.43 fps
specvp11 lightwave-01 + Intel HD Graphics 5000 SPECviewperf 11 - specvp11 lightwave-01
min: 13.34 avg: 14.5 median: 14.5 (16%) max: 15.62 fps
specvp11 ensight-04 + Intel HD Graphics 5000 SPECviewperf 11 - specvp11 ensight-04
min: 2.06 avg: 2.1 median: 2.1 (1%) max: 2.11 fps
specvp11 catia-03 + Intel HD Graphics 5000 SPECviewperf 11 - specvp11 catia-03
4.5 fps (2%)
Windows 7 Experience Index - Win7 Gaming graphics
5.6 Points (71%)
min: 6.5 avg: 6.6 median: 6.6 (84%) max: 6.7 Points
Windows 7 Experience Index - Win7 Graphics
min: 4.5 avg: 4.9 median: 4.9 (61%) max: 5.2 Points
min: 5.8 avg: 5.9 median: 5.9 (74%) max: 5.9 Points
Cinebench R10 Cinebench R10 Shading (32bit) + Intel HD Graphics (Bay Trail) Cinebench R10 - Cinebench R10 Shading (32bit)
min: 898 avg: 2014 median: 1991.5 (1%) max: 2889 Points
Cinebench R10 Shading (32bit) + Intel HD Graphics 2000
min: 1169 avg: 2298 median: 2298 (2%) max: 3427 Points
Cinebench R10 Shading (32bit) + Intel HD Graphics 5000
min: 5143 avg: 6901 median: 6946.5 (5%) max: 7959 Points
Cinebench R11.5 Cinebench R11.5 OpenGL 64 Bit + Intel HD Graphics (Bay Trail) Cinebench R11.5 - Cinebench R11.5 OpenGL 64 Bit
min: 0.37 avg: 6.2 median: 6.4 (2%) max: 7.69 fps
Cinebench R11.5 OpenGL 64 Bit + Intel HD Graphics 2000
min: 2.69 avg: 5.1 median: 5.9 (2%) max: 6.68 fps
Cinebench R11.5 OpenGL 64 Bit + Intel HD Graphics 5000
min: 15.01 avg: 19.6 median: 19.6 (7%) max: 24.76 fps
Cinebench R15 + Intel HD Graphics (Bay Trail) Cinebench R15 - Cinebench R15 OpenGL 64 Bit
min: 2.88 avg: 5 median: 5.5 (0%) max: 6.55 fps
Cinebench R15 OpenGL 64 Bit + Intel HD Graphics 5000
min: 24.15 avg: 27.4 median: 27.4 (2%) max: 30.64 fps
Cinebench R15 OpenGL Ref. Match 64 Bit + Intel HD Graphics (Bay Trail) Cinebench R15 - Cinebench R15 OpenGL Ref. Match 64 Bit
min: 63 avg: 96.1 median: 97.8 (98%) max: 97.8 %
Cinebench R15 OpenGL Ref. Match 64 Bit + Intel HD Graphics 5000
min: 63.3 avg: 81.1 median: 80.7 (81%) max: 99.6 %
GFXBench 3.1 - GFXBench Manhattan ES 3.1 Offscreen
5.2 fps (0%)
GFXBench 3.0 - GFXBench 3.0 Manhattan Offscreen
min: 6 avg: 9.7 median: 8.8 (1%) max: 16 fps
22.5 fps (1%)
GFXBench (DX / GLBenchmark) 2.7 + Intel HD Graphics (Bay Trail) GFXBench (DX / GLBenchmark) 2.7 - GFXBench T-Rex HD Offscreen C24Z16
min: 6 avg: 15.7 median: 16 (0%) max: 20.2 fps
GFXBench T-Rex HD Offscreen C24Z16 + Intel HD Graphics 5000
min: 62 avg: 72.5 median: 72.5 (1%) max: 83 fps
Basemark ES 2.0 - Basemark ES 2.0
min: 45.08 avg: 49.1 median: 49.1 (81%) max: 53.1 fps
Basemark X 1.0 - Basemark X 1.0 Off-Screen
10.1 fps (48%)
Basemark X 1.1 - Basemark X 1.1 High Quality
min: 3008 avg: 6663 median: 8456 (19%) max: 8524 Points
Basemark X 1.1 - Basemark X 1.1 Medium Quality
min: 4802 avg: 12880 median: 14509 (32%) max: 17701 Points
NenaMark2 - NenaMark2 Score
min: 59 avg: 59.4 median: 59.4 (88%) max: 59.7 fps
LuxMark v2.0 64Bit - LuxMark v2.0 Room GPU
min: 25 avg: 28.5 median: 27 (0%) max: 35 Samples/s
min: 139 avg: 187 median: 201 (1%) max: 221 Samples/s
LuxMark v2.0 64Bit - LuxMark v2.0 Sala GPU
min: 26 avg: 29 median: 29 (0%) max: 34 Samples/s
min: 286 avg: 305.3 median: 306 (1%) max: 324 Samples/s
ComputeMark v2.1 - ComputeMark v2.1 Result
min: 160 avg: 172.8 median: 174 (0%) max: 192 Points
min: 775 avg: 817 median: 816.5 (1%) max: 858 Points
PassMark PerformanceTest Mobile V1 - PerformanceTest Mobile V1 2D Graphics Tests
min: 3822 avg: 4036 median: 3866 (4%) max: 4588 Points
PassMark PerformanceTest Mobile V1 - PerformanceTest Mobile V1 3D Graphics Tests
min: 1058 avg: 1251 median: 1228 (2%) max: 1488 Points
Smartbench 2012 - Smartbench 2012 Gaming Index
min: 2679 avg: 3414 median: 3385 (74%) max: 4274 Points
Average Benchmarks Intel HD Graphics (Bay Trail) → 100% n=8 Average Benchmarks Intel HD Graphics 2000 → 137% n=8 Average Benchmarks Intel HD Graphics 5000 → 438% n=8
- Bereich der Benchmarkergebnisse für diese Grafikkarte
- Durchschnittliche Benchmarkergebnisse für diese Grafikkarte
* Smaller numbers mean a higher performance
1 This benchmark is not used for the average calculation
Spiele-Benchmarks Die folgenden Benchmarks basieren auf unseren Spieletests mit Testnotebooks. Die Performance dieser Grafikkarte bei den gelisteten Spielen ist abhängig von der verwendeten CPU, Speicherausstattung, Treiber und auch Betriebssystem. Dadurch müssen die untenstehenden Werte nicht repräsentativ sein. Detaillierte Informationen über das verwendete System sehen Sie nach einem Klick auf den fps-Wert.
100%
HD Graphics (Bay Trail):
26.7 [X] Intel NUC Kit DN2820FYKH Intel Celeron N2820 2.2GHz
HD Graphics (Bay Trail)
min:
23 fps
fps
100%
HD Graphics (Bay Trail):
23.4 [X] Intel NUC Kit DN2820FYKH Intel Celeron N2820 2.2GHz
HD Graphics (Bay Trail)
min:
21 fps
fps
100%
HD Graphics (Bay Trail):
6 [X] Intel NUC Kit DN2820FYKH Intel Celeron N2820 2.2GHz
HD Graphics (Bay Trail)
fps
100%
HD Graphics (Bay Trail):
12.6 [X] Intel NUC Kit DN2820FYKH Intel Celeron N2820 2.2GHz
HD Graphics (Bay Trail)
min:
7 fps, max:
15 fps
fps
HD Graphics (Bay Trail):
0 (!) [X] Intel NUC Kit DN2820FYKH Intel Celeron N2820 2.2GHz
HD Graphics (Bay Trail)
fps
100%
HD Graphics (Bay Trail):
12.1 [X] Intel NUC Kit DN2820FYKH Intel Celeron N2820 2.2GHz
HD Graphics (Bay Trail)
min:
5 fps, max:
18 fps
fps
100%
HD Graphics (Bay Trail):
10.8 [X] Intel NUC Kit DN2820FYKH Intel Celeron N2820 2.2GHz
HD Graphics (Bay Trail)
min:
10 fps, max:
12 fps
fps
100%
HD Graphics (Bay Trail):
24.7 [X] Intel NUC Kit DN2820FYKH Intel Celeron N2820 2.2GHz
HD Graphics (Bay Trail)
min:
22.2 fps
fps
100%
HD Graphics (Bay Trail):
9.7 [X] Intel NUC Kit DN2820FYKH Intel Celeron N2820 2.2GHz
HD Graphics (Bay Trail)
min:
8.8 fps
fps
100%
HD Graphics (Bay Trail):
5.5 [X] Intel NUC Kit DN2820FYKH Intel Celeron N2820 2.2GHz
HD Graphics (Bay Trail)
min:
-1.4 fps
fps
100%
HD Graphics (Bay Trail):
5.4 [X] Intel NUC Kit DN2820FYKH Intel Celeron N2820 2.2GHz
HD Graphics (Bay Trail)
min:
-3 fps
fps
100%
HD Graphics (Bay Trail):
22 [X] Intel NUC Kit DN2820FYKH Intel Celeron N2820 2.2GHz
HD Graphics (Bay Trail)
min:
16 fps, max:
33 fps
24.2 ~ 23 fps
100%
HD Graphics (Bay Trail):
0 (!) [X] Intel NUC Kit DN2820FYKH Intel Celeron N2820 2.2GHz
HD Graphics (Bay Trail)
12.5 ~ 6 fps
HD Graphics 5000:
19.2 fps
100%
HD Graphics (Bay Trail):
7.3 fps
285%
HD Graphics 5000:
20.8 fps
100%
HD Graphics (Bay Trail):
5.1 fps
296%
HD Graphics 5000:
15.1 fps
100%
HD Graphics (Bay Trail):
3.2 fps
397%
HD Graphics 5000:
12.7 fps
100%
HD Graphics (Bay Trail):
1.7 fps
565%
HD Graphics 5000:
9.6 fps
100%
HD Graphics (Bay Trail):
8.1 fps
195%
HD Graphics 5000:
15.8 fps
100%
HD Graphics (Bay Trail):
4.7 fps
226%
HD Graphics 5000:
10.6 fps
100%
HD Graphics (Bay Trail):
7 fps
249%
HD Graphics 5000:
17.4 fps
100%
HD Graphics (Bay Trail):
4.6 fps
261%
HD Graphics 5000:
12 fps
100%
HD Graphics (Bay Trail):
5.6 fps
255%
HD Graphics 5000:
14.3 fps
100%
HD Graphics (Bay Trail):
3.8 fps
279%
HD Graphics 5000:
10.6 fps
100%
HD Graphics (Bay Trail):
4.3 fps
126%
HD Graphics 5000:
5.4 fps
100%
HD Graphics (Bay Trail):
2.4 fps
HD Graphics 5000:
25.4 fps
HD Graphics 5000:
16.2 fps
100%
HD Graphics (Bay Trail):
9.6 11.5 ~ 11 fps
141%
HD Graphics 5000:
15.5 fps
100%
HD Graphics (Bay Trail):
4.3 fps
284%
HD Graphics 5000:
12.2 fps
100%
HD Graphics (Bay Trail):
12 14 ~ 13 fps
392%
HD Graphics 5000:
51 fps
100%
HD Graphics (Bay Trail):
12 fps
292%
HD Graphics 5000:
35 fps
100%
HD Graphics (Bay Trail):
5.2 fps
273%
HD Graphics 5000:
14.2 fps
100%
HD Graphics (Bay Trail):
3.6 fps
294%
HD Graphics 5000:
10.6 fps
100%
HD Graphics (Bay Trail):
3.7 fps
397%
HD Graphics 5000:
14.7 fps
100%
HD Graphics (Bay Trail):
2.5 fps
368%
HD Graphics 5000:
9.2 fps
100%
HD Graphics (Bay Trail):
9.1 fps
318%
HD Graphics 5000:
28.9 fps
100%
HD Graphics (Bay Trail):
5.1 fps
410%
HD Graphics 5000:
20.9 fps
HD Graphics 5000:
11.4 fps
100%
HD Graphics (Bay Trail):
8.5 fps
236%
HD Graphics 5000:
20.1 fps
100%
HD Graphics (Bay Trail):
6.1 fps
213%
HD Graphics 5000:
13 fps
100%
HD Graphics (Bay Trail):
12.4 fps
292%
HD Graphics 5000:
36.2 fps
100%
HD Graphics (Bay Trail):
8.5 fps
331%
HD Graphics 5000:
28.1 fps
HD Graphics 5000:
17.4 fps
100%
HD Graphics (Bay Trail):
53.7 56 ~ 55 fps
306%
HD Graphics 5000:
168.3 fps
100%
HD Graphics (Bay Trail):
6.6 7 ~ 7 fps
469%
HD Graphics 5000:
32.8 fps
HD Graphics 5000:
14.2 fps
100%
HD Graphics (Bay Trail):
8.4 fps
342%
HD Graphics 5000:
28.7 fps
100%
HD Graphics (Bay Trail):
5.9 fps
298%
HD Graphics 5000:
17.6 fps
100%
HD Graphics (Bay Trail):
31.6 41.8 ~ 37 fps
232%
HD Graphics 5000:
85.7 fps
100%
HD Graphics (Bay Trail):
12.5 12.5 ~ 13 fps
232%
HD Graphics 5000:
30.2 fps
HD Graphics 5000:
14.9 fps
HD Graphics 5000:
12.5 fps
100%
HD Graphics (Bay Trail):
8.3 fps
217%
HD Graphics 5000:
17 18.1 ~ 18 fps
100%
HD Graphics (Bay Trail):
4.6 fps
239%
HD Graphics 5000:
10.9 11.6 ~ 11 fps
100%
HD Graphics (Bay Trail):
11.1 fps
245%
HD Graphics 5000:
27.2 fps
100%
HD Graphics (Bay Trail):
9.6 fps
230%
HD Graphics 5000:
22.1 fps
HD Graphics 5000:
10.7 fps
100%
HD Graphics (Bay Trail):
25.2 fps
100%
HD Graphics (Bay Trail):
9.2 fps
HD Graphics 5000:
33.2 fps
HD Graphics 5000:
20.2 fps
HD Graphics 5000:
13.2 fps
100%
HD Graphics (Bay Trail):
3.1 5.1 ~ 4 fps
325%
HD Graphics 5000:
11.9 14.8 ~ 13 fps
100%
HD Graphics (Bay Trail):
3.3 fps
273%
HD Graphics 5000:
8.4 9.7 ~ 9 fps
100%
HD Graphics (Bay Trail):
8.7 fps
100%
HD Graphics (Bay Trail):
5.8 fps
100%
HD Graphics (Bay Trail):
12.8 fps
100%
HD Graphics (Bay Trail):
6 fps
HD Graphics 5000:
20.5 fps
100%
HD Graphics (Bay Trail):
7.3 fps
392%
HD Graphics 5000:
28.6 fps
HD Graphics 5000:
19.9 fps
HD Graphics 5000:
13.3 fps
100%
HD Graphics (Bay Trail):
14 fps
100%
HD Graphics (Bay Trail):
8 fps
100%
HD Graphics (Bay Trail):
12 fps
425%
HD Graphics 5000:
51 fps
569%
HD Graphics 5000:
165.1 fps
100%
HD Graphics (Bay Trail):
10.5 19.5 33 ~ 21 fps
477%
HD Graphics 5000:
100.2 fps
100%
HD Graphics (Bay Trail):
7.8 12.8 22 ~ 14 fps
510%
HD Graphics 5000:
71.4 fps
HD Graphics 5000:
39.3 fps
100%
HD Graphics (Bay Trail):
7.7 fps
517%
HD Graphics 5000:
39.8 fps
HD Graphics 5000:
29.4 fps
HD Graphics 5000:
21.6 fps
100%
HD Graphics (Bay Trail):
6.3 fps
100%
HD Graphics (Bay Trail):
10.2 fps
100%
HD Graphics (Bay Trail):
6.1 fps
100%
HD Graphics (Bay Trail):
11 fps
100%
HD Graphics (Bay Trail):
7.8 fps
100%
HD Graphics (Bay Trail):
18.2 20.8 28.4 31.9 [X] Asus Transformer Book T200TA PL Intel Atom Z3775 1.5GHz
HD Graphics (Bay Trail)
~ 25 fps
260%
HD Graphics 5000:
59.6 69.8 ~ 65 fps
100%
HD Graphics (Bay Trail):
9.5 10.4 13.7 19.4 [X] Asus Transformer Book T200TA PL Intel Atom Z3775 1.5GHz
HD Graphics (Bay Trail)
~ 13 fps
262%
HD Graphics 5000:
31.5 36.8 ~ 34 fps
100%
HD Graphics (Bay Trail):
4.4 fps
302%
HD Graphics 5000:
13.3 fps
HD Graphics 5000:
10.4 fps
326%
HD Graphics 5000:
58.6 fps
100%
HD Graphics (Bay Trail):
12.5 12.6 ~ 13 fps
241%
HD Graphics 5000:
31.3 fps
HD Graphics 5000:
22.7 fps
HD Graphics 5000:
12.5 fps
100%
HD Graphics (Bay Trail):
5 fps
380%
HD Graphics 5000:
18.8 18.9 ~ 19 fps
100%
HD Graphics (Bay Trail):
3.5 5.3 5.6 5.7 6.3 6.8 6.9 [X] Toshiba Satellite Click 2 L30W-BST2N23 Intel Pentium N3530 2.2GHz
HD Graphics (Bay Trail)
7.1 ~ 6 fps
100%
HD Graphics (Bay Trail):
2.1 4.8 4.9 5.8 [X] Toshiba Satellite Click 2 L30W-BST2N23 Intel Pentium N3530 2.2GHz
HD Graphics (Bay Trail)
5.9 6.2 ~ 5 fps
100%
HD Graphics (Bay Trail):
1.2 fps
642%
HD Graphics 5000:
7.7 fps
100%
HD Graphics (Bay Trail):
39 56.2 69 [X] Baytrail Reference Tablet Intel Atom Z3770 1.5GHz
HD Graphics (Bay Trail)
~ 55 fps
100%
HD Graphics (Bay Trail):
12.3 12.8 14 [X] Baytrail Reference Tablet Intel Atom Z3770 1.5GHz
HD Graphics (Bay Trail)
min:
8 fps
~ 13 fps
100%
HD Graphics (Bay Trail):
0.3 fps
2667%
HD Graphics 5000:
7.9 8 9.5 ~ 8 fps
HD Graphics 5000:
20.9 fps
100%
HD Graphics (Bay Trail):
15.1 23.6 ~ 19 fps
100%
HD Graphics (Bay Trail):
5.2 9.7 ~ 7 fps
100%
HD Graphics (Bay Trail):
10.3 fps
277%
HD Graphics 5000:
28.6 fps
100%
HD Graphics (Bay Trail):
6.2 fps
309%
HD Graphics 5000:
19.2 fps
HD Graphics 5000:
16.6 fps
HD Graphics 5000:
11.2 fps
100%
HD Graphics (Bay Trail):
10.1 fps
221%
HD Graphics 5000:
22.3 fps
100%
HD Graphics (Bay Trail):
6 fps
262%
HD Graphics 5000:
15.7 fps
100%
HD Graphics (Bay Trail):
12.4 fps
327%
HD Graphics 5000:
40.5 fps
100%
HD Graphics (Bay Trail):
7.3 fps
384%
HD Graphics 5000:
28 fps
HD Graphics 5000:
14.1 fps
100%
HD Graphics (Bay Trail):
12.5 14.3 ~ 13 fps
100%
HD Graphics (Bay Trail):
9.8 11.2 ~ 11 fps
100%
HD Graphics (Bay Trail):
42 fps
198%
HD Graphics 5000:
83 fps
100%
HD Graphics (Bay Trail):
26.1 [X] Intel NUC Kit DN2820FYKH Intel Celeron N2820 2.2GHz
HD Graphics (Bay Trail)
min:
16 fps, max:
38 fps
46.6 ~ 36 fps
100%
HD Graphics (Bay Trail):
20 [X] Intel NUC Kit DN2820FYKH Intel Celeron N2820 2.2GHz
HD Graphics (Bay Trail)
min:
13 fps, max:
29 fps
23.9 ~ 22 fps
100%
HD Graphics (Bay Trail):
12.9 13.2 ~ 13 fps
100%
HD Graphics (Bay Trail):
7.5 8.1 ~ 8 fps
100%
HD Graphics (Bay Trail):
28 fps
100%
HD Graphics (Bay Trail):
9.2 10.7 14.8 [X] Dell Venue 11 Pro 5130 Intel Atom Z3770 1.5GHz
HD Graphics (Bay Trail)
15.6 16.5 18.4 19.3 [X] Intel NUC Kit DN2820FYKH Intel Celeron N2820 2.2GHz
HD Graphics (Bay Trail)
min:
14 fps, max:
23 fps
~ 15 fps
161%
HD Graphics 2000:
24.1 fps
380%
HD Graphics 5000:
54 58 59 ~ 57 fps
100%
HD Graphics (Bay Trail):
6 9.5 10.3 11.4 [X] Dell Venue 11 Pro 5130 Intel Atom Z3770 1.5GHz
HD Graphics (Bay Trail)
12 ~ 10 fps
400%
HD Graphics 5000:
38 42 ~ 40 fps
100%
HD Graphics (Bay Trail):
7.9 9.6 [X] Dell Venue 11 Pro 5130 Intel Atom Z3770 1.5GHz
HD Graphics (Bay Trail)
~ 9 fps
356%
HD Graphics 5000:
31 32 ~ 32 fps
100%
HD Graphics (Bay Trail):
5 5.9 [X] Dell Venue 11 Pro 5130 Intel Atom Z3770 1.5GHz
HD Graphics (Bay Trail)
~ 5 fps
360%
HD Graphics 5000:
13 19 21 ~ 18 fps
100%
HD Graphics (Bay Trail):
8.5 12.4 ~ 10 fps
119%
HD Graphics 2000:
11.9 fps
100%
HD Graphics (Bay Trail):
8.1 fps
100%
HD Graphics (Bay Trail):
5.8 fps
100%
HD Graphics (Bay Trail):
2.3 fps
118%
HD Graphics 2000:
18.9 21.5 ~ 20 fps
114%
HD Graphics 2000:
8 fps
100%
HD Graphics (Bay Trail):
3.6 [X] Acer Aspire E1-510P-2671 Intel Celeron N2920 1.9GHz
HD Graphics (Bay Trail)
4 4 4.1 5.5 ~ 4 fps
100%
HD Graphics (Bay Trail):
1.1 fps
818%
HD Graphics 5000:
9 fps
100%
HD Graphics (Bay Trail):
11 11.8 ~ 11 fps
127%
HD Graphics 2000:
14 fps
268%
HD Graphics 5000:
29.5 fps
100%
HD Graphics (Bay Trail):
10 fps
184%
HD Graphics 5000:
18.4 fps
HD Graphics 5000:
11.6 fps
100%
HD Graphics (Bay Trail):
8 fps
100%
HD Graphics (Bay Trail):
4.8 fps
HD Graphics 2000:
117 [X] Desktop Intel Core i5-2400 3.1GHz
HD Graphics 2000
fps
HD Graphics 2000:
56 [X] Desktop Intel Core i5-2400 3.1GHz
HD Graphics 2000
fps
HD Graphics 2000:
37 [X] Desktop Intel Core i5-2400 3.1GHz
HD Graphics 2000
fps
HD Graphics 2000:
21 [X] Desktop Intel Core i5-2400 3.1GHz
HD Graphics 2000
fps
HD Graphics 2000:
37 [X] Desktop Intel Core i5-2400 3.1GHz
HD Graphics 2000
fps
HD Graphics 2000:
19 [X] Desktop Intel Core i5-2400 3.1GHz
HD Graphics 2000
fps
100%
HD Graphics (Bay Trail):
19.7 fps
127%
HD Graphics 2000:
23.3 26 [X] Desktop Intel Core i5-2400 3.1GHz
HD Graphics 2000
~ 25 fps
100%
HD Graphics (Bay Trail):
24.1 36.9 ~ 31 fps
171%
HD Graphics 2000:
53 [X] Desktop Intel Core i5-2400 3.1GHz
HD Graphics 2000
min:
39 fps
fps
100%
HD Graphics (Bay Trail):
12.9 13.3 ~ 13 fps
165%
HD Graphics 2000:
21.4 [X] Desktop Intel Core i5-2400 3.1GHz
HD Graphics 2000
min:
18 fps
fps
HD Graphics 2000:
13.3 [X] Desktop Intel Core i5-2400 3.1GHz
HD Graphics 2000
min:
12.5 fps
fps
HD Graphics 2000:
9 [X] Desktop Intel Core i5-2400 3.1GHz
HD Graphics 2000
fps
HD Graphics 2000:
18 [X] Desktop Intel Core i5-2400 3.1GHz
HD Graphics 2000
fps
HD Graphics 2000:
43.2 [X] Desktop Intel Core i5-2400 3.1GHz
HD Graphics 2000
fps
HD Graphics 5000:
88.8 fps
HD Graphics 2000:
26 [X] no model Intel Core i5-2400 3.1GHz
HD Graphics 2000
fps
HD Graphics 2000:
17 [X] no model Intel Core i5-2400 3.1GHz
HD Graphics 2000
fps
HD Graphics 2000:
68 [X] no model Intel Core i5-2400 3.1GHz
HD Graphics 2000
71 [X] Desktop Intel Core i5-2400 3.1GHz
HD Graphics 2000
~ 70 fps
HD Graphics 2000:
34 [X] no model Intel Core i5-2400 3.1GHz
HD Graphics 2000
40 [X] Desktop Intel Core i5-2400 3.1GHz
HD Graphics 2000
~ 37 fps
HD Graphics 2000:
19 [X] no model Intel Core i5-2400 3.1GHz
HD Graphics 2000
22 [X] Desktop Intel Core i5-2400 3.1GHz
HD Graphics 2000
~ 21 fps
100%
HD Graphics (Bay Trail):
9.3 fps
100%
HD Graphics (Bay Trail):
5 10.5 [X] Asus Transformer Book T200TA PL Intel Atom Z3775 1.5GHz
HD Graphics (Bay Trail)
~ 8 fps
100%
HD Graphics 2000:
-1 [X] no model Intel Core i5-2400 3.1GHz
HD Graphics 2000
16.9 [X] no model Intel Core i5-2400 3.1GHz
HD Graphics 2000
~ 8 fps
100%
HD Graphics (Bay Trail):
5.6 [X] Asus Transformer Book T200TA PL Intel Atom Z3775 1.5GHz
HD Graphics (Bay Trail)
fps
100%
HD Graphics (Bay Trail):
3.7 [X] Asus Transformer Book T200TA PL Intel Atom Z3775 1.5GHz
HD Graphics (Bay Trail)
fps
100%
HD Graphics (Bay Trail):
32 48 49 53.3 ~ 46 fps
135%
HD Graphics 2000:
62 [X] no model Intel Core i5-2400 3.1GHz
HD Graphics 2000
fps
322%
HD Graphics 5000:
126 169 ~ 148 fps
100%
HD Graphics (Bay Trail):
6 9 9 ~ 8 fps
150%
HD Graphics 2000:
12 [X] no model Intel Core i5-2400 3.1GHz
HD Graphics 2000
fps
513%
HD Graphics 5000:
38 43 ~ 41 fps
100%
HD Graphics (Bay Trail):
3 fps
300%
HD Graphics 2000:
9 [X] no model Intel Core i5-2400 3.1GHz
HD Graphics 2000
fps
833%
HD Graphics 5000:
24 26 ~ 25 fps
HD Graphics 2000:
5 [X] no model Intel Core i5-2400 3.1GHz
HD Graphics 2000
fps
HD Graphics 5000:
10 16 ~ 13 fps
100%
HD Graphics (Bay Trail):
12 [X] Asus Transformer Book T200TA PL Intel Atom Z3775 1.5GHz
HD Graphics (Bay Trail)
fps
225%
HD Graphics 2000:
27 [X] no model Intel Core i5-2400 3.1GHz
HD Graphics 2000
fps
100%
HD Graphics (Bay Trail):
9 [X] Asus Transformer Book T200TA PL Intel Atom Z3775 1.5GHz
HD Graphics (Bay Trail)
fps
122%
HD Graphics 2000:
11 [X] no model Intel Core i5-2400 3.1GHz
HD Graphics 2000
fps
HD Graphics 2000:
26.4 [X] Desktop Intel Core i5-2400 3.1GHz
HD Graphics 2000
min:
7.14 fps, max:
56 fps
fps
HD Graphics 2000:
10.4 [X] Desktop Intel Core i5-2400 3.1GHz
HD Graphics 2000
min:
1.6 fps, max:
24 fps
fps
100%
HD Graphics (Bay Trail):
12.8 fps
172%
HD Graphics 2000:
21.2 23 [X] no model Intel Core i5-2400 3.1GHz
HD Graphics 2000
~ 22 fps
100%
HD Graphics (Bay Trail):
9 fps
144%
HD Graphics 2000:
12 [X] no model Intel Core i5-2400 3.1GHz
HD Graphics 2000
13.5 ~ 13 fps
HD Graphics 2000:
50 [X] no model Intel Core i5-2400 3.1GHz
HD Graphics 2000
fps
HD Graphics 2000:
14 [X] no model Intel Core i5-2400 3.1GHz
HD Graphics 2000
fps
142%
HD Graphics 2000:
26 48 [X] no model Intel Core i5-2400 3.1GHz
HD Graphics 2000
~ 37 fps
130%
HD Graphics 2000:
11 [X] no model Intel Core i5-2400 3.1GHz
HD Graphics 2000
15.5 ~ 13 fps
258%
HD Graphics 2000:
62 [X] no model Intel Core i5-2400 3.1GHz
HD Graphics 2000
fps
HD Graphics 2000:
12.7 [X] no model Intel Core i5-2400 3.1GHz
HD Graphics 2000
fps
HD Graphics 2000:
6.1 [X] no model Intel Core i5-2400 3.1GHz
HD Graphics 2000
fps
HD Graphics 2000:
30 [X] no model Intel Core i5-2400 3.1GHz
HD Graphics 2000
fps
HD Graphics 2000:
12 [X] no model Intel Core i5-2400 3.1GHz
HD Graphics 2000
fps
HD Graphics 2000:
27.1 [X] no model Intel Core i5-2400 3.1GHz
HD Graphics 2000
fps
HD Graphics 2000:
17.9 [X] no model Intel Core i5-2400 3.1GHz
HD Graphics 2000
fps
HD Graphics 2000:
12.7 [X] no model Intel Core i5-2400 3.1GHz
HD Graphics 2000
fps
HD Graphics 2000:
32 [X] no model Intel Core i5-2400 3.1GHz
HD Graphics 2000
fps
HD Graphics 2000:
5 [X] no model Intel Core i5-2400 3.1GHz
HD Graphics 2000
fps
HD Graphics 2000:
107 [X] no model Intel Core i5-2400 3.1GHz
HD Graphics 2000
fps
HD Graphics 2000:
24 [X] no model Intel Core i5-2400 3.1GHz
HD Graphics 2000
fps
HD Graphics 2000:
13 [X] no model Intel Core i5-2400 3.1GHz
HD Graphics 2000
fps
HD Graphics 2000:
73 [X] no model Intel Core i5-2400 3.1GHz
HD Graphics 2000
fps
HD Graphics 2000:
20 [X] no model Intel Core i5-2400 3.1GHz
HD Graphics 2000
fps
HD Graphics 2000:
-1 [X] no model Intel Core i5-2400 3.1GHz
HD Graphics 2000
fps
HD Graphics 2000:
31 [X] no model Intel Core i5-2400 3.1GHz
HD Graphics 2000
fps
HD Graphics 2000:
27.9 49 [X] no model Intel Core i5-2400 3.1GHz
HD Graphics 2000
~ 38 fps
HD Graphics 2000:
13 [X] no model Intel Core i5-2400 3.1GHz
HD Graphics 2000
13 ~ 13 fps
HD Graphics 2000:
5.2 [X] no model Intel Core i5-2400 3.1GHz
HD Graphics 2000
fps
HD Graphics 2000:
30 [X] no model Intel Core i5-2400 3.1GHz
HD Graphics 2000
fps
HD Graphics 2000:
4 [X] no model Intel Core i5-2400 3.1GHz
HD Graphics 2000
fps
216%
HD Graphics 2000:
166 [X] no model Intel Core i5-2400 3.1GHz
HD Graphics 2000
fps
207%
HD Graphics 2000:
39.3 [X] no model Intel Core i5-2400 3.1GHz
HD Graphics 2000
fps
100%
HD Graphics (Bay Trail):
6.4 7.7 ~ 7 fps
196%
HD Graphics 2000:
13.7 [X] no model Intel Core i5-2400 3.1GHz
HD Graphics 2000
fps
HD Graphics 2000:
74 [X] no model Intel Core i5-2400 3.1GHz
HD Graphics 2000
fps
HD Graphics 2000:
27 [X] no model Intel Core i5-2400 3.1GHz
HD Graphics 2000
fps
HD Graphics 2000:
11 [X] no model Intel Core i5-2400 3.1GHz
HD Graphics 2000
fps
HD Graphics 2000:
27 [X] no model Intel Core i5-2400 3.1GHz
HD Graphics 2000
fps
HD Graphics 2000:
16 [X] no model Intel Core i5-2400 3.1GHz
HD Graphics 2000
fps
100%
HD Graphics (Bay Trail):
18.9 19 ~ 19 fps
163%
HD Graphics 2000:
25 [X] no model Intel Core i5-2400 3.1GHz
HD Graphics 2000
37 [X] Desktop Intel Core i5-2400 3.1GHz
HD Graphics 2000
~ 31 fps
100%
HD Graphics (Bay Trail):
7.6 8.7 ~ 8 fps
175%
HD Graphics 2000:
13.8 [X] no model Intel Core i5-2400 3.1GHz
HD Graphics 2000
14.7 [X] Desktop Intel Core i5-2400 3.1GHz
HD Graphics 2000
~ 14 fps
HD Graphics 2000:
33.3 [X] Desktop Intel Core i5-2400 3.1GHz
HD Graphics 2000
fps
HD Graphics 2000:
13.7 [X] Desktop Intel Core i5-2400 3.1GHz
HD Graphics 2000
fps
HD Graphics 2000:
78 [X] no model Intel Core i5-2400 3.1GHz
HD Graphics 2000
fps
HD Graphics 2000:
21 [X] no model Intel Core i5-2400 3.1GHz
HD Graphics 2000
fps
HD Graphics 2000:
10 [X] no model Intel Core i5-2400 3.1GHz
HD Graphics 2000
fps
HD Graphics 2000:
4 [X] no model Intel Core i5-2400 3.1GHz
HD Graphics 2000
fps
HD Graphics 2000:
100.6 [X] no model Intel Core i5-2400 3.1GHz
HD Graphics 2000
fps
HD Graphics 2000:
44 [X] no model Intel Core i5-2400 3.1GHz
HD Graphics 2000
fps
100%
HD Graphics (Bay Trail):
33 33 35 38 [X] MSI S100 Intel Atom Z3740D 1.3GHz
HD Graphics (Bay Trail)
44 46.2 47 48 49 49 [X] Intel NUC Kit DN2820FYKH Intel Celeron N2820 2.2GHz
HD Graphics (Bay Trail)
min:
39 fps, max:
59 fps
50 [X] Baytrail Reference Tablet Intel Atom Z3770 1.5GHz
HD Graphics (Bay Trail)
min:
36 fps
52 ~ 44 fps
327%
HD Graphics 2000:
144 [X] no model Intel Core i5-2400 3.1GHz
HD Graphics 2000
fps
368%
HD Graphics 5000:
162 fps
100%
HD Graphics (Bay Trail):
9.6 [X] Intel NUC Kit DN2820FYKH Intel Celeron N2820 2.2GHz
HD Graphics (Bay Trail)
min:
3 fps, max:
13 fps
11.5 [X] Baytrail Reference Tablet Intel Atom Z3770 1.5GHz
HD Graphics (Bay Trail)
min:
8 fps
20 22 23 25.3 26 26 28 [X] MSI S100 Intel Atom Z3740D 1.3GHz
HD Graphics (Bay Trail)
34 ~ 23 fps
157%
HD Graphics 2000:
36 [X] no model Intel Core i5-2400 3.1GHz
HD Graphics 2000
fps
339%
HD Graphics 5000:
78 fps
100%
HD Graphics (Bay Trail):
12 12 13.5 ~ 13 fps
69%
HD Graphics 2000:
9 [X] no model Intel Core i5-2400 3.1GHz
HD Graphics 2000
fps
238%
HD Graphics 5000:
31 fps
100%
HD Graphics (Bay Trail):
5.6 7 ~ 6 fps
150%
HD Graphics 5000:
9 fps
HD Graphics 2000:
210 [X] no model Intel Core i5-2400 3.1GHz
HD Graphics 2000
fps
HD Graphics 2000:
70 [X] no model Intel Core i5-2400 3.1GHz
HD Graphics 2000
fps
HD Graphics 2000:
52 [X] no model Intel Core i5-2400 3.1GHz
HD Graphics 2000
fps
HD Graphics 2000:
44.1 [X] no model Intel Core i5-2400 3.1GHz
HD Graphics 2000
fps
100%
HD Graphics (Bay Trail):
190 [X] Baytrail Reference Tablet Intel Atom Z3770 1.5GHz
HD Graphics (Bay Trail)
fps
128%
HD Graphics 2000:
243 [X] no model Intel Core i5-2400 3.1GHz
HD Graphics 2000
fps
Average Gaming Intel HD Graphics (Bay Trail) → 100% Average Gaming 30-70 fps → 100%
Average Gaming Intel HD Graphics 2000 → 165% Average Gaming 30-70 fps → 176%
Average Gaming Intel HD Graphics 5000 → 365% Average Gaming 30-70 fps → 352%
v1.26
log 09. 02:23:02
#0 checking url part for id 4922 +0s ... 0s
#1 checking url part for id 1958 +0s ... 0s
#2 checking url part for id 4574 +0s ... 0s
#3 not redirecting to Ajax server +0s ... 0s
#4 did not recreate cache, as it is less than 5 days old! Created at Tue, 07 May 2024 05:40:33 +0200 +0.001s ... 0.001s
#5 composed specs +0.285s ... 0.286s
#6 did output specs +0s ... 0.286s
#7 start showIntegratedCPUs +0s ... 0.286s
#8 getting avg benchmarks for device 4922 +0.104s ... 0.39s
#9 got single benchmarks 4922 +0.404s ... 0.794s
#10 getting avg benchmarks for device 1958 +0.002s ... 0.797s
#11 got single benchmarks 1958 +0.051s ... 0.848s
#12 getting avg benchmarks for device 4574 +0.026s ... 0.873s
#13 got single benchmarks 4574 +0.041s ... 0.914s
#14 got avg benchmarks for devices +0s ... 0.914s
#15 min, max, avg, median took s +0.718s ... 1.632s
#16 before gaming benchmark output +0s ... 1.632s
#17 Got 707 rows for game benchmarks. +0.248s ... 1.88s
#18 composed SQL query for gamebenchmarks +0s ... 1.88s
#19 got data and put it in $dataArray +0.087s ... 1.967s
#20 benchmarks composed for output. +0.277s ... 2.243s
#21 calculated avg scores. +0s ... 2.243s
#22 return log +0.004s ... 2.248s
Teilen Sie diesen Artikel, um uns zu unterstützen. Jeder Link hilft!
Autor: Klaus Hinum, 8.09.2017 (Update: 1.07.2023)
 Deutsch
 English
 Español
 Français
 Italiano
 Nederlands
 Polski
 Português
 Русский
 Türkçe
 Svenska
 Chinese
 Magyar