NVIDIA GeForce RTX 2080 (Desktop) vs NVIDIA GeForce GTX 1650 Max-Q vs NVIDIA GeForce GTX 1650 Ti Max-Q
NVIDIA GeForce RTX 2080 (Desktop) ► remove from comparison
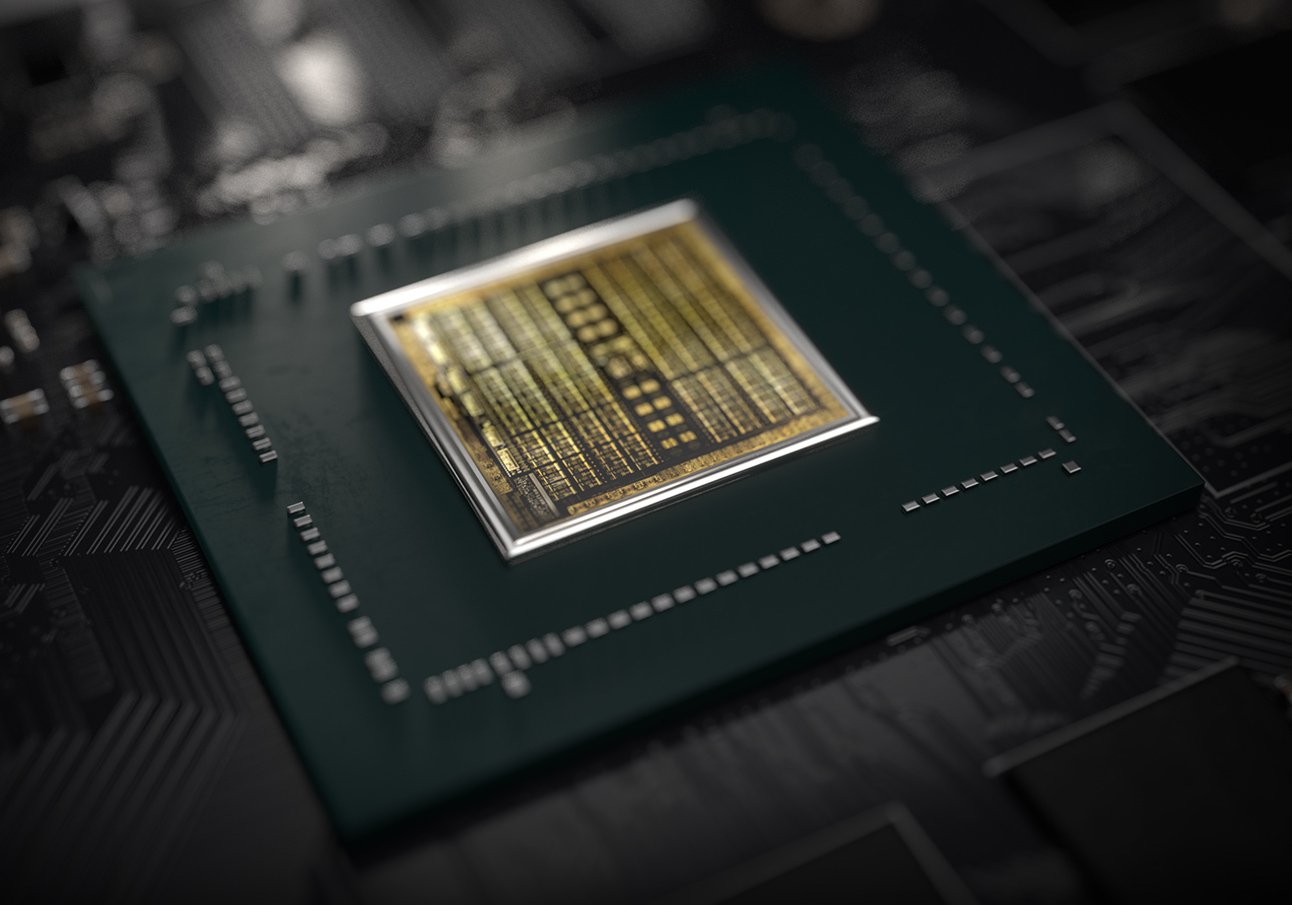
Die Nvidia GeForce RTX 2080 ist nach dem Topmodell GeForce RTX 2080 Ti die zweitschnellste Turing-Grafikkarte für Desktop-PCs und wurde im August 2018 vorgestellt. Die GPU verfügt über die 2.944 Shadereinheiten, sowie 8 GB GDDR6-Speicher an einem 256-Bit-Interface (14 GHz, 448 GB/s).
Features
Der TU104-Chip wird in 12nm gefertigt und bietet eine Reihe neuer Features, wie DLSS (Deep Learning Super Sampling) und Real Time Ray Tracing. Dadurch lassen sich vor allem Bleuchtungseffekte sehr viel realistischer darstellen. Weiterhin gibt es Support für DisplayPort 1.4 (ready), HDMI 2.0b, HDR, Simultaneous Multi-Projection (SMP) sowie H.265 Video De- und Encoding (PlayReady 3.0).
Performance
Die Performance der GeForce RTX 2080 liegt etwa auf dem Niveau einer GeForce GTX 1080 Ti. Werden auch die neuen Features unterstützt, so ist die GeForce RTX 2080 der GeForce GTX 1080 Ti deutlich überlegen. Damit ordnet sich die RTX 2080 im absoluten High-End-Segment ein und kann die meisten Spiele des Jahres 2018 in hohen Einstellungen und 4K-Auflösung flüssig darstellen.
Leistungsaufnahme
Die Leistungsaufnahme der GeForce RTX 2080 wird vom Hersteller mit 215 Watt beziffert und liegt damit etwas über dem Vorgänger GeForce GTX 1080 (180 Watt).
NVIDIA GeForce GTX 1650 Max-Q ► remove from comparison
Die Nvidia GeForce GTX 1650 mit Max-Q Design ist eine mobile Grafikkarte für Laptops basierend auf der Turing Architektur. Sie ist gedacht für dünne und leichte Notebook und je nach Kühlungsdesign etwa 10-15% langsamer als eine normale GTX 1650 für Laptops . Sie basiert wie die Desktop-Version auf den TU117 Chip, nutzt jedoch alle 1024 Shader und wurde Ende April 2019 vorgestellt. Die GTX 1650 Serie bietet im Unterschied zu den stärkeren RTX 2000er Karten (z.B. RTX 2060 ) keine Raytracing und Tensor Kerne. Die Leistung sollte etwas oberhalb einer mobilen GTX 1050 Ti Max-Q sein, jedoch bei deutlich geringerem Stromverbrauch.
Mit dem Refresh im März 2020 ist auch eine GDDR6 Variante (N18P-G61, max. 4 GB) erhältlich.
Bei der Turing Architektur gab es auch auf der Ebene der CUDA-Kerne deutliche Verbesserungen. Float und INT Operationen können nun gleichzeitig ausgeführt werden, der Cache wurde vereinheitlicht und verbessert und Adaptive Shading eingeführt. Nvidia spricht dadurch von einer bis zu 50% höheren Leistung pro Kern im Vergleich zu Pascal.
Im Gegensatz zu den größeren Turing Chips (wie den TU116 der GTX 1660 Ti) bietet der TU117 nur die älteren NVENC Videoenkodierung der Pascal / Volta Generation.
Nvidia spezifiziert einen Stromverbrauch von 35 Watt TGP (Total Graphics Power) für die Grafikkarte und damit 15 Watt weniger als die normale (Max-P) Variante der GTX1650 . Der TU117 Chip wird bei TSMC im 12nm FFN Verfahren gefertigt.
NVIDIA GeForce GTX 1650 Ti Max-Q ► remove from comparison
Die Nvidia GeForce GTX 1650 Ti Max-Q (N18P-G62) für Laptops ist die Stromsparversion der mobilen GeForce GTX 1650 Ti mit reduzierten Taktraten und Stromverbrauch. Die GTX 1650 Serie bietet im Unterschied zu den stärkeren RTX 2000er Karten (z.B. RTX 2060 ) keine Raytracing und Tensor Kerne. Die Leistung sollte leicht oberhalb einer mobilen GTX 1650 liegen.
Aktuell wissen wir von zwei Varianten mit 35 und 40 Watt TGP und unterschiedlichen Taktraten von 1035 - 1200 bzw 1200 - 1365 MHz. Beide Versionen sind jedoch deutlich unter der noromalen Max-P-Variante mit 1350 - 1485 MHz und 50 Watt TGP angesiedelt. Der Speicher wird mit 1250 MHz = 10.000 MHz effektiv (Gbps) getaktet. Es kann aber eventuell auch Varianten mit 1500 MHz (non Max-Q Taktraten) geben.
Bei der Turing Architektur gab es auch auf der Ebene der CUDA-Kerne deutliche Verbesserungen. Float und INT Operationen können nun gleichzeitig ausgeführt werden, der Cache wurde vereinheitlicht und verbessert und Adaptive Shading eingeführt. Nvidia spricht dadurch von einer bis zu 50% höheren Leistung pro Kern im Vergleich zu Pascal.
Im Gegensatz zu den größeren Turing Chips (wie den TU116 der GTX 1660 Ti) bietet der TU117 nur die älteren NVENC Videoenkodierung der Pascal / Volta Generation.
Nvidia spezifiziert einen Stromverbrauch von 35 bzw 40 Watt (im Vergleich zu den 50 - 80 Watt TGP der normalen GTX 1650 Ti Mobile ) für die Grafikkarte und damit 15 Watt mehr als die langsamere und effizientere Max-Q Variante der GTX1650 . Der TU117 Chip wird bei TSMC im 12nm FFN Verfahren gefertigt.
NVIDIA GeForce RTX 2080 (Desktop) NVIDIA GeForce GTX 1650 Max-Q NVIDIA GeForce GTX 1650 Ti Max-Q GeForce GTX 1600 Serie Codename Turing TU104 N18P-G0 / N18P-G61 N18P-G62 Max-Q Architektur Turing Turing Turing Pipelines 2944 - unified 1024 - unified 1024 - unified Kerntakt 1515 - 1710 (Boost) MHz 1020 - 1245 (Boost) MHz 1035 - 1200 (Boost) MHz Speichertakt 14000 MHz 8000 effective = 1750 MHz 10000 MHz Speicherbandbreite 256 Bit 128 Bit 128 Bit Speichertyp GDDR6 GDDR5, GDDR6 GDDR6 Max. Speichergröße 8 GB 4 GB 4 GB Shared Memory nein nein nein API DirectX 12_1, Shader 6.4, OpenGL 4.6 DirectX 12_1, OpenGL 4.6 DirectX 12_1, OpenGL 4.6 Stromverbrauch 215 Watt 35 Watt 35 Watt Transistors 13.6 Billion Herstellungsprozess 12 nm 12 nm 12 nm Features NVLink, DLSS, Raytraycing, VR Ready, G-SYNC, Vulkan, Multi Monitor, 650 Watt system power recommended Erscheinungsdatum 27.08.2018 23.04.2019 02.04.2020 TMUs 64 ROPs 32 Memory Bandwidth 112.1 GB/s PCIe 3.0 Notebookgröße mittel (15.4" z.B.) mittel (15.4" z.B.) Herstellerseite www.nvidia.com www.nvidia.com
Benchmarks Performance Rating - 3DMark 11 + Fire Strike + Time Spy - GeForce RTX 2080 (Desktop)
12.6 pt (38%)
...
NVIDIA GeForce RTX 2080 (Desktop)
...
Performance Rating - 3DMark 11 + Fire Strike + Time Spy - GeForce GTX 1650 Max-Q
3.5 pt (11%)
...
NVIDIA GeForce GTX 1650 Max-Q
...
3DMark - 3DMark Time Spy Score
min: 10660 avg: 10864 median: 10820 (31%) max: 11111 Points
min: 2859 avg: 3130 median: 3070 (9%) max: 3494 Points
min: 3015 avg: 3309 median: 3235.5 (9%) max: 3709 Points
GPU TDP ? TDP 21 W TDP 35 W 100% 71% 77%
3DMark - 3DMark Time Spy Graphics
min: 11099 avg: 11173 median: 11126 (29%) max: 11294 Points
min: 2836 avg: 2998 median: 3016 (8%) max: 3238 Points
min: 2886 avg: 3139 median: 3098 (8%) max: 3526 Points
GPU TDP ? TDP 21 W TDP 35 W 100% 69% 75%
3DMark - 3DMark Ice Storm Unlimited Graphics
min: 429810 avg: 465565 median: 436117 (49%) max: 530769 Points
min: 370469 avg: 377330 median: 373879 (42%) max: 391093 Points
GPU TDP ? TDP 40 W 100% 93%
421834 Points (48%)
GPU TDP ? TDP 35 W TDP 40 W 99% 100% 93%
3DMark - 3DMark Ice Storm Extreme Graphics
min: 322455 avg: 360917 median: 330412 (42%) max: 429885 Points
min: 40461 avg: 62256 median: 59656 (8%) max: 86650 Points
GPU TDP ? TDP 40 W 100% 16%
34142 Points (4%)
GPU TDP ? TDP 40 W 100% 19%
3DMark - 3DMark Cloud Gate Score
min: 50698 avg: 53450 median: 51449 (55%) max: 58204 Points
min: 14259 avg: 20728 median: 20883 (22%) max: 29013 Points
GPU TDP ? TDP 40 W 100% 86%
min: 18333 avg: 22116 median: 22895 (24%) max: 26161 Points
GPU TDP ? TDP 21 W TDP 35 W TDP 40 W 100% 92% 97% 91%
3DMark - 3DMark Cloud Gate Graphics
min: 138058 avg: 148217 median: 143576 (38%) max: 163017 Points
min: 21759 avg: 39625 median: 45243.5 (12%) max: 53981 Points
GPU TDP ? TDP 40 W 100% 49%
min: 29035 avg: 42978 median: 47657 (13%) max: 53539 Points
GPU TDP ? TDP 21 W TDP 35 W TDP 40 W 100% 91% 92% 54%
3DMark - 3DMark Fire Strike Standard Score
min: 19543 avg: 21436 median: 20492 (36%) max: 24273 Points
min: 6300 avg: 7026 median: 7004.5 (12%) max: 7784 Points
GPU TDP ? TDP 40 W 100% 77%
min: 7292 avg: 7764 median: 7700 (14%) max: 8659 Points
GPU TDP ? TDP 21 W TDP 35 W TDP 40 W 100% 81% 88% 85%
3DMark - 3DMark Fire Strike Standard Graphics
min: 27228 avg: 27772 median: 27620 (31%) max: 28469 Points
min: 6985 avg: 7853 median: 7779 (9%) max: 8618 Points
GPU TDP ? TDP 40 W 100% 69%
min: 8024 avg: 8542 median: 8564 (10%) max: 9573 Points
GPU TDP ? TDP 21 W TDP 35 W TDP 40 W 100% 75% 82% 78%
3DMark - 3DMark Ice Storm Graphics
min: 350422 avg: 401015 median: 372126 (45%) max: 480498 Points
min: 40513 avg: 68009 median: 64975.5 (8%) max: 101571 Points
GPU TDP ? TDP 40 W 100% 17%
3DMark - 3DMark Wild Life Unlimited
21348 Points (11%)
3DMark 11 - 3DM11 Performance Score
min: 26875 avg: 29060 median: 29073.5 (40%) max: 31219 Points
min: 9381 avg: 10635 median: 10471 (15%) max: 11966 Points
GPU TDP ? TDP 40 W 100% 72%
min: 10610 avg: 11524 median: 11398 (16%) max: 13121 Points
GPU TDP ? TDP 21 W TDP 35 W TDP 40 W 100% 77% 83% 77%
3DMark 11 - 3DM11 Performance GPU
min: 37989 avg: 39989 median: 40278 (35%) max: 41409 Points
min: 10248 avg: 11171 median: 11082.5 (10%) max: 12259 Points
GPU TDP ? TDP 40 W 100% 60%
min: 11055 avg: 11796 median: 11538 (10%) max: 13343 Points
GPU TDP ? TDP 21 W TDP 35 W TDP 40 W 100% 68% 74% 66%
3DMark Vantage + NVIDIA GeForce RTX 2080 (Desktop) 3DMark Vantage - 3DM Vant. Perf. total
min: 65648 avg: 66631 median: 66631 (19%) max: 67614 Points
3DM Vant. Perf. total + NVIDIA GeForce GTX 1650 Max-Q
30957 Points (9%)
3DM Vant. Perf. total + NVIDIA GeForce GTX 1650 Ti Max-Q
31116 Points (9%)
3DM Vant. Perf. GPU no PhysX + NVIDIA GeForce RTX 2080 (Desktop) 3DMark Vantage - 3DM Vant. Perf. GPU no PhysX
min: 70117 avg: 70700 median: 70700 (40%) max: 71283 Points
3DM Vant. Perf. GPU no PhysX + NVIDIA GeForce GTX 1650 Max-Q
33321 Points (19%)
3DM Vant. Perf. GPU no PhysX + NVIDIA GeForce GTX 1650 Ti Max-Q
33179 Points (19%)
3DMark 03 - 3DMark 03 - Standard
min: 141127 avg: 141572 median: 141572 (74%) max: 142016 Points
3DMark 05 - 3DMark 05 - Standard
min: 34601 avg: 38535 median: 38534.5 (42%) max: 42468 Points
3DMark 06 3DMark 06 - Standard 1280x1024 + NVIDIA GeForce RTX 2080 (Desktop)
min: 35085 avg: 38997 median: 35228 (46%) max: 46677 Points
3DMark 06 - Standard 1280x1024 + NVIDIA GeForce GTX 1650 Max-Q
min: 31487 avg: 32041 median: 32040.5 (42%) max: 32594 Points
3DMark 06 - Standard 1280x1024 + NVIDIA GeForce GTX 1650 Ti Max-Q
30266 Points (40%)
Unigine Valley 1.0 - Unigine Valley 1.0 DX
min: 119.6 avg: 121.5 median: 121.5 (40%) max: 123.3 fps
SPECviewperf 12 + NVIDIA GeForce RTX 2080 (Desktop) SPECviewperf 12 - specvp12 sw-03
min: 69.5 avg: 69.8 median: 69.8 (17%) max: 70.1 fps
specvp12 snx-02 + NVIDIA GeForce RTX 2080 (Desktop) SPECviewperf 12 - specvp12 snx-02
min: 11.74 avg: 11.9 median: 11.9 (2%) max: 12.08 fps
specvp12 showcase-01 + NVIDIA GeForce RTX 2080 (Desktop) SPECviewperf 12 - specvp12 showcase-01
137.9 fps (30%)
specvp12 mediacal-01 + NVIDIA GeForce RTX 2080 (Desktop) SPECviewperf 12 - specvp12 mediacal-01
min: 44.89 avg: 45.1 median: 45.1 (11%) max: 45.26 fps
specvp12 maya-04 + NVIDIA GeForce RTX 2080 (Desktop) SPECviewperf 12 - specvp12 maya-04
min: 148.7 avg: 149.6 median: 149.6 (41%) max: 150.4 fps
specvp12 energy-01 + NVIDIA GeForce RTX 2080 (Desktop) SPECviewperf 12 - specvp12 energy-01
min: 12.38 avg: 12.5 median: 12.5 (11%) max: 12.52 fps
specvp12 creo-01 + NVIDIA GeForce RTX 2080 (Desktop) SPECviewperf 12 - specvp12 creo-01
min: 52.1 avg: 52.3 median: 52.3 (21%) max: 52.5 fps
specvp12 catia-04 + NVIDIA GeForce RTX 2080 (Desktop) SPECviewperf 12 - specvp12 catia-04
min: 107.5 avg: 108.5 median: 108.5 (18%) max: 109.4 fps
specvp12 3dsmax-05 + NVIDIA GeForce RTX 2080 (Desktop) SPECviewperf 12 - specvp12 3dsmax-05
min: 176.2 avg: 205.2 median: 205.2 (36%) max: 234.1 fps
SPECviewperf 13 specvp13 sw-04 + NVIDIA GeForce RTX 2080 (Desktop) SPECviewperf 13 - specvp13 sw-04
100.3 fps (27%)
specvp13 sw-04 + NVIDIA GeForce GTX 1650 Max-Q
53 fps (14%)
specvp13 snx-03 + NVIDIA GeForce RTX 2080 (Desktop) SPECviewperf 13 - specvp13 snx-03
21.7 fps (2%)
specvp13 snx-03 + NVIDIA GeForce GTX 1650 Max-Q
10.7 fps (1%)
specvp13 medical-02 + NVIDIA GeForce RTX 2080 (Desktop) SPECviewperf 13 - specvp13 medical-02
71 fps (15%)
specvp13 medical-02 + NVIDIA GeForce GTX 1650 Max-Q
22.8 fps (5%)
specvp13 creo-02 + NVIDIA GeForce RTX 2080 (Desktop) SPECviewperf 13 - specvp13 creo-02
220.3 fps (32%)
specvp13 creo-02 + NVIDIA GeForce GTX 1650 Max-Q
68.9 fps (10%)
specvp13 showcase-02 + NVIDIA GeForce GTX 1650 Max-Q SPECviewperf 13 - specvp13 showcase-02
33.7 fps (7%)
specvp13 maya-05 + NVIDIA GeForce GTX 1650 Max-Q SPECviewperf 13 - specvp13 maya-05
88.2 fps (10%)
specvp13 catia-05 + NVIDIA GeForce GTX 1650 Max-Q SPECviewperf 13 - specvp13 catia-05
53.9 fps (6%)
specvp13 3dsmax-06 + NVIDIA GeForce GTX 1650 Max-Q SPECviewperf 13 - specvp13 3dsmax-06
71.3 fps (12%)
Cinebench R10 Cinebench R10 Shading (32bit) + NVIDIA GeForce GTX 1650 Max-Q Cinebench R10 - Cinebench R10 Shading (32bit)
min: 5121 avg: 5968 median: 5967.5 (4%) max: 6814 Points
Cinebench R11.5 Cinebench R11.5 OpenGL 64 Bit + NVIDIA GeForce GTX 1650 Max-Q Cinebench R11.5 - Cinebench R11.5 OpenGL 64 Bit
76.1 fps (26%)
Cinebench R11.5 OpenGL 64 Bit + NVIDIA GeForce GTX 1650 Ti Max-Q
64.9 fps (22%)
Cinebench R15 + NVIDIA GeForce GTX 1650 Max-Q Cinebench R15 - Cinebench R15 OpenGL 64 Bit
min: 85.3 avg: 110 median: 108.1 (6%) max: 143.6 fps
GPU TDP ? TDP 40 W 74% 100%
Cinebench R15 OpenGL 64 Bit + NVIDIA GeForce GTX 1650 Ti Max-Q
min: 83.9 avg: 132.8 median: 140 (8%) max: 145 fps
GPU TDP ? TDP 21 W TDP 35 W TDP 40 W 81% 88% 94% 100%
Cinebench R15 OpenGL Ref. Match 64 Bit + NVIDIA GeForce GTX 1650 Max-Q Cinebench R15 - Cinebench R15 OpenGL Ref. Match 64 Bit
99.6 % (100%)
GPU TDP ? TDP 40 W 100% 100%
Cinebench R15 OpenGL Ref. Match 64 Bit + NVIDIA GeForce GTX 1650 Ti Max-Q
99.6 % (100%)
GPU TDP ? TDP 21 W TDP 35 W TDP 40 W 100% 100% 100% 100%
GFXBench - GFXBench Car Chase Offscreen
154.2 fps (17%)
LuxMark v2.0 64Bit - LuxMark v2.0 Room GPU
min: 3423 avg: 3438 median: 3438 (16%) max: 3453 Samples/s
1589 Samples/s (7%)
9546 Samples/s (43%)
LuxMark v2.0 64Bit - LuxMark v2.0 Sala GPU
min: 7886 avg: 7907 median: 7907 (14%) max: 7928 Samples/s
3068 Samples/s (5%)
10809 Samples/s (19%)
ComputeMark v2.1 - ComputeMark v2.1 Result
min: 20484 avg: 20628 median: 20627.5 (22%) max: 20771 Points
5833 Points (6%)
6297 Points (7%)
Power Consumption - Furmark Stress Test Power Consumption - external Monitor *
402.2 Watt (57%)
min: 61.5 avg: 66.7 median: 65.2 (9%) max: 75 Watt
Power Consumption - The Witcher 3 Power Consumption - external Monitor *
404.7 Watt (57%)
min: 59.8 avg: 63.3 median: 63 (9%) max: 67.3 Watt
Power Consumption - Witcher 3 Power Consumption *
378 Watt (83%)
min: 60 avg: 71.7 median: 73 (16%) max: 90.1 Watt
min: 60.6 avg: 72 median: 68.6 (15%) max: 94 Watt
GPU TDP ? TDP 21 W TDP 35 W 100% 108% 103%
Power Consumption - Witcher 3 ultra Power Efficiency
0.3 fps per Watt (27%)
min: 0.3818 avg: 0.4 median: 0.4 (43%) max: 0.485 fps per Watt
min: 0.3568 avg: 0.4 median: 0.4 (44%) max: 0.522 fps per Watt
GPU TDP ? TDP 21 W TDP 35 W 82% 100% 86%
Power Consumption - Witcher 3 ultra Power Efficiency - external Monitor
0.3 fps per Watt (22%)
min: 0.4161 avg: 0.4 median: 0.4 (37%) max: 0.4716 fps per Watt
Emissions Witcher 3 Fan Noise + NVIDIA GeForce GTX 1650 Max-Q Emissions - Witcher 3 Fan Noise
min: 25.2 avg: 38.8 median: 39.8 (64%) max: 44.7 dB(A)
GPU TDP ? TDP 40 W 90% 100%
Witcher 3 Fan Noise + NVIDIA GeForce GTX 1650 Ti Max-Q
min: 34.5 avg: 40.9 median: 42 (67%) max: 47 dB(A)
GPU TDP ? TDP 21 W TDP 35 W TDP 40 W 94% 81% 90% 100%
Clock Speed - GPU Clock Witcher 3 ultra
min: 1350 avg: 1378 median: 1389 (54%) max: 1395 MHz
min: 1340 avg: 1405 median: 1405 (55%) max: 1470 MHz
GPU TDP ? TDP 35 W 93% 100%
Clock Speed - GPU Clock Speed Furmark
998 MHz (40%)
Average Benchmarks NVIDIA GeForce RTX 2080 (Desktop) → 100% n=16 Average Benchmarks NVIDIA GeForce GTX 1650 Max-Q → 41% n=16 Average Benchmarks NVIDIA GeForce GTX 1650 Ti Max-Q → 63% n=16
- Bereich der Benchmarkergebnisse für diese Grafikkarte
- Durchschnittliche Benchmarkergebnisse für diese Grafikkarte
* Smaller numbers mean a higher performance
1 This benchmark is not used for the average calculation
Spiele-Benchmarks Die folgenden Benchmarks basieren auf unseren Spieletests mit Testnotebooks. Die Performance dieser Grafikkarte bei den gelisteten Spielen ist abhängig von der verwendeten CPU, Speicherausstattung, Treiber und auch Betriebssystem. Dadurch müssen die untenstehenden Werte nicht repräsentativ sein. Detaillierte Informationen über das verwendete System sehen Sie nach einem Klick auf den fps-Wert.
100%
GeForce RTX 2080 (Desktop):
248 [X] MSI GeForce RTX 2080 Intel Core i9-9900K 3.6GHz
GeForce RTX 2080 (Desktop)
min:
177 fps
fps
100%
GeForce RTX 2080 (Desktop):
217 [X] MSI GeForce RTX 2080 Intel Core i9-9900K 3.6GHz
GeForce RTX 2080 (Desktop)
min:
180 fps
fps
100%
GeForce RTX 2080 (Desktop):
131 [X] MSI GeForce RTX 2080 Intel Core i9-9900K 3.6GHz
GeForce RTX 2080 (Desktop)
min:
110 fps
fps
100%
GeForce RTX 2080 (Desktop):
89 [X] MSI GeForce RTX 2080 Intel Core i9-9900K 3.6GHz
GeForce RTX 2080 (Desktop)
min:
79 fps
fps
100%
GeForce RTX 2080 (Desktop):
50 [X] MSI GeForce RTX 2080 Intel Core i9-9900K 3.6GHz
GeForce RTX 2080 (Desktop)
min:
44 fps
fps
100%
GeForce RTX 2080 (Desktop):
161 [X] MSI GeForce RTX 2080 Intel Core i9-9900K 3.6GHz
GeForce RTX 2080 (Desktop)
min:
35.6 fps, P0.1:
51.2 fps, P1:
94.8 fps, max:
263 fps
fps
100%
GeForce RTX 2080 (Desktop):
148 [X] MSI GeForce RTX 2080 Intel Core i9-9900K 3.6GHz
GeForce RTX 2080 (Desktop)
min:
38.2 fps, P0.1:
54.9 fps, P1:
90.7 fps, max:
251 fps
fps
100%
GeForce RTX 2080 (Desktop):
117 [X] MSI GeForce RTX 2080 Intel Core i9-9900K 3.6GHz
GeForce RTX 2080 (Desktop)
min:
40 fps, P0.1:
51.2 fps, P1:
76.9 fps, max:
226 fps
fps
100%
GeForce RTX 2080 (Desktop):
87.1 [X] MSI GeForce RTX 2080 Intel Core i9-9900K 3.6GHz
GeForce RTX 2080 (Desktop)
min:
20.4 fps, P0.1:
42.6 fps, P1:
59.5 fps, max:
171 fps
fps
100%
GeForce RTX 2080 (Desktop):
50.4 [X] MSI GeForce RTX 2080 Intel Core i9-9900K 3.6GHz
GeForce RTX 2080 (Desktop)
min:
29 fps, P0.1:
33.5 fps, P1:
38.7 fps, max:
98.6 fps
fps
100%
GeForce RTX 2080 (Desktop):
127 [X] MSI GeForce RTX 2080 Intel Core i9-9900K 3.6GHz
GeForce RTX 2080 (Desktop)
min:
23.4 fps, P0.1:
53.3 fps, P1:
71.4 fps, max:
343 fps
fps
100%
GeForce RTX 2080 (Desktop):
123 [X] MSI GeForce RTX 2080 Intel Core i9-9900K 3.6GHz
GeForce RTX 2080 (Desktop)
min:
25.3 fps, P0.1:
53.5 fps, P1:
68.9 fps, max:
354 fps
fps
100%
GeForce RTX 2080 (Desktop):
120 [X] MSI GeForce RTX 2080 Intel Core i9-9900K 3.6GHz
GeForce RTX 2080 (Desktop)
min:
25.4 fps, P0.1:
51.9 fps, P1:
66.9 fps, max:
299 fps
fps
100%
GeForce RTX 2080 (Desktop):
97.8 [X] MSI GeForce RTX 2080 Intel Core i9-9900K 3.6GHz
GeForce RTX 2080 (Desktop)
min:
25.7 fps, P0.1:
30.1 fps, P1:
63.9 fps, max:
324 fps
fps
100%
GeForce RTX 2080 (Desktop):
180 [X] MSI GeForce RTX 2080 Intel Core i9-9900K 3.6GHz
GeForce RTX 2080 (Desktop)
min:
120 fps, P0.1:
125 fps, P1:
136 fps, max:
233 fps
fps
100%
GeForce RTX 2080 (Desktop):
177 [X] MSI GeForce RTX 2080 Intel Core i9-9900K 3.6GHz
GeForce RTX 2080 (Desktop)
min:
118 fps, P0.1:
127 fps, P1:
139 fps, max:
226 fps
fps
100%
GeForce RTX 2080 (Desktop):
166 [X] MSI GeForce RTX 2080 Intel Core i9-9900K 3.6GHz
GeForce RTX 2080 (Desktop)
min:
111 fps, P0.1:
122 fps, P1:
134 fps, max:
220 fps
fps
100%
GeForce RTX 2080 (Desktop):
115 [X] MSI GeForce RTX 2080 Intel Core i9-9900K 3.6GHz
GeForce RTX 2080 (Desktop)
min:
37.9 fps, P0.1:
94.7 fps, P1:
97.1 fps, max:
156 fps
fps
100%
GeForce RTX 2080 (Desktop):
58.4 [X] MSI GeForce RTX 2080 Intel Core i9-9900K 3.6GHz
GeForce RTX 2080 (Desktop)
min:
32.9 fps, P0.1:
33.5 fps, P1:
37.3 fps, max:
82.9 fps
fps
100%
GeForce RTX 2080 (Desktop):
133 [X] MSI GeForce RTX 2080 Intel Core i9-9900K 3.6GHz
GeForce RTX 2080 (Desktop)
min:
36.7 fps, P0.1:
44.9 fps, P1:
60.3 fps, max:
224 fps
fps
100%
GeForce RTX 2080 (Desktop):
132 [X] MSI GeForce RTX 2080 Intel Core i9-9900K 3.6GHz
GeForce RTX 2080 (Desktop)
min:
30.7 fps, P0.1:
44.8 fps, P1:
60.2 fps, max:
219 fps
fps
100%
GeForce RTX 2080 (Desktop):
129 [X] MSI GeForce RTX 2080 Intel Core i9-9900K 3.6GHz
GeForce RTX 2080 (Desktop)
min:
43 fps, P0.1:
49.8 fps, P1:
64.3 fps, max:
240 fps
fps
100%
GeForce RTX 2080 (Desktop):
89.9 [X] MSI GeForce RTX 2080 Intel Core i9-9900K 3.6GHz
GeForce RTX 2080 (Desktop)
min:
32.6 fps, P0.1:
49.8 fps, P1:
53.9 fps, max:
211 fps
fps
100%
GeForce RTX 2080 (Desktop):
47.3 [X] MSI GeForce RTX 2080 Intel Core i9-9900K 3.6GHz
GeForce RTX 2080 (Desktop)
min:
6.58 fps, P0.1:
14.6 fps, P1:
32 fps, max:
206 fps
fps
100%
GeForce RTX 2080 (Desktop):
165 [X] MSI GeForce RTX 2080 Intel Core i9-9900K 3.6GHz
GeForce RTX 2080 (Desktop)
min:
78 fps
fps
100%
GeForce RTX 2080 (Desktop):
163 [X] MSI GeForce RTX 2080 Intel Core i9-9900K 3.6GHz
GeForce RTX 2080 (Desktop)
min:
71 fps
fps
100%
GeForce RTX 2080 (Desktop):
160 [X] MSI GeForce RTX 2080 Intel Core i9-9900K 3.6GHz
GeForce RTX 2080 (Desktop)
min:
68 fps
fps
100%
GeForce RTX 2080 (Desktop):
119 [X] MSI GeForce RTX 2080 Intel Core i9-9900K 3.6GHz
GeForce RTX 2080 (Desktop)
min:
49 fps
fps
100%
GeForce RTX 2080 (Desktop):
65.3 [X] MSI GeForce RTX 2080 Intel Core i9-9900K 3.6GHz
GeForce RTX 2080 (Desktop)
min:
44 fps
fps
GeForce GTX 1650 Ti Max-Q:
63.7 fps
100%
GeForce RTX 2080 (Desktop):
100 [X] MSI GeForce RTX 2080 Intel Core i9-9900K 3.6GHz
GeForce RTX 2080 (Desktop)
min:
20.7 fps, P0.1:
63.9 fps, P1:
77.9 fps, max:
146 fps
fps
33%
GeForce GTX 1650 Ti Max-Q:
33 fps
100%
GeForce RTX 2080 (Desktop):
85.9 [X] MSI GeForce RTX 2080 Intel Core i9-9900K 3.6GHz
GeForce RTX 2080 (Desktop)
min:
19.7 fps, P0.1:
61.9 fps, P1:
70.2 fps, max:
117 fps
fps
31%
GeForce GTX 1650 Ti Max-Q:
26.8 fps
100%
GeForce RTX 2080 (Desktop):
76.2 [X] MSI GeForce RTX 2080 Intel Core i9-9900K 3.6GHz
GeForce RTX 2080 (Desktop)
min:
20.7 fps, P0.1:
45.2 fps, P1:
61.5 fps, max:
105 fps
fps
29%
GeForce GTX 1650 Ti Max-Q:
22.2 fps
100%
GeForce RTX 2080 (Desktop):
50.3 [X] MSI GeForce RTX 2080 Intel Core i9-9900K 3.6GHz
GeForce RTX 2080 (Desktop)
min:
18.7 fps, P0.1:
39.5 fps, P1:
44 fps, max:
89.8 fps
fps
100%
GeForce RTX 2080 (Desktop):
24.4 [X] MSI GeForce RTX 2080 Intel Core i9-9900K 3.6GHz
GeForce RTX 2080 (Desktop)
min:
18.7 fps, P0.1:
19 fps, P1:
22.4 fps, max:
45.2 fps
fps
GeForce GTX 1650 Ti Max-Q:
70 77 ~ 74 fps
100%
GeForce RTX 2080 (Desktop):
104 [X] MSI GeForce RTX 2080 Intel Core i9-9900K 3.6GHz
GeForce RTX 2080 (Desktop)
min:
40 fps
fps
45%
GeForce GTX 1650 Ti Max-Q:
45 48 ~ 47 fps
100%
GeForce RTX 2080 (Desktop):
91 [X] MSI GeForce RTX 2080 Intel Core i9-9900K 3.6GHz
GeForce RTX 2080 (Desktop)
min:
35 fps
fps
38%
GeForce GTX 1650 Ti Max-Q:
32 36 [X] MSI Summit E15 A11SCST High Performance
Intel Core i7-1185G7 3GHz
GeForce GTX 1650 Ti Max-Q
min:
9 fps, max:
78 fps
37 ~ 35 fps
100%
GeForce RTX 2080 (Desktop):
83 [X] MSI GeForce RTX 2080 Intel Core i9-9900K 3.6GHz
GeForce RTX 2080 (Desktop)
min:
44 fps
fps
35%
GeForce GTX 1650 Ti Max-Q:
28 29 ~ 29 fps
100%
GeForce RTX 2080 (Desktop):
70 [X] MSI GeForce RTX 2080 Intel Core i9-9900K 3.6GHz
GeForce RTX 2080 (Desktop)
min:
40 fps
fps
34%
GeForce GTX 1650 Ti Max-Q:
24 fps
100%
GeForce RTX 2080 (Desktop):
48 [X] MSI GeForce RTX 2080 Intel Core i9-9900K 3.6GHz
GeForce RTX 2080 (Desktop)
min:
26 fps
fps
29%
GeForce GTX 1650 Ti Max-Q:
14 fps
GeForce GTX 1650 Ti Max-Q:
97.5 105.1 ~ 101 fps
100%
GeForce RTX 2080 (Desktop):
135 [X] MSI GeForce RTX 2080 Intel Core i9-9900K 3.6GHz
GeForce RTX 2080 (Desktop)
min:
17.7 fps, P0.1:
76.5 fps, P1:
94.6 fps, max:
166 fps
fps
33%
GeForce GTX 1650 Ti Max-Q:
42.5 46.9 ~ 45 fps
100%
GeForce RTX 2080 (Desktop):
131 [X] MSI GeForce RTX 2080 Intel Core i9-9900K 3.6GHz
GeForce RTX 2080 (Desktop)
min:
78.2 fps, P0.1:
81.4 fps, P1:
93.3 fps, max:
168 fps
fps
33%
GeForce GTX 1650 Ti Max-Q:
40.5 44.8 ~ 43 fps
100%
GeForce RTX 2080 (Desktop):
115 [X] MSI GeForce RTX 2080 Intel Core i9-9900K 3.6GHz
GeForce RTX 2080 (Desktop)
min:
20.5 fps, P0.1:
64.8 fps, P1:
76.9 fps, max:
155 fps
fps
33%
GeForce GTX 1650 Ti Max-Q:
35.7 39.6 ~ 38 fps
100%
GeForce RTX 2080 (Desktop):
80 [X] MSI GeForce RTX 2080 Intel Core i9-9900K 3.6GHz
GeForce RTX 2080 (Desktop)
min:
29.9 fps, P0.1:
48.1 fps, P1:
51.2 fps, max:
144 fps
fps
32%
GeForce GTX 1650 Ti Max-Q:
25.4 fps
100%
GeForce RTX 2080 (Desktop):
41.6 [X] MSI GeForce RTX 2080 Intel Core i9-9900K 3.6GHz
GeForce RTX 2080 (Desktop)
min:
27.5 fps, P0.1:
27.7 fps, P1:
28.3 fps, max:
78.7 fps
fps
30%
GeForce GTX 1650 Ti Max-Q:
12.4 fps
GeForce GTX 1650 Ti Max-Q:
100 fps
100%
GeForce RTX 2080 (Desktop):
133 [X] MSI GeForce RTX 2080 Intel Core i9-9900K 3.6GHz
GeForce RTX 2080 (Desktop)
min:
55.4 fps, P0.1:
81.8 fps, P1:
99.7 fps, max:
373 fps
fps
42%
GeForce GTX 1650 Ti Max-Q:
55.6 fps
100%
GeForce RTX 2080 (Desktop):
112 [X] MSI GeForce RTX 2080 Intel Core i9-9900K 3.6GHz
GeForce RTX 2080 (Desktop)
min:
59 fps, P0.1:
71.5 fps, P1:
83.1 fps, max:
274 fps
fps
39%
GeForce GTX 1650 Ti Max-Q:
44.1 fps
100%
GeForce RTX 2080 (Desktop):
102 [X] MSI GeForce RTX 2080 Intel Core i9-9900K 3.6GHz
GeForce RTX 2080 (Desktop)
min:
49.8 fps, P0.1:
60.2 fps, P1:
71.8 fps, max:
268 fps
fps
39%
GeForce GTX 1650 Ti Max-Q:
40.2 fps
100%
GeForce RTX 2080 (Desktop):
75.1 [X] MSI GeForce RTX 2080 Intel Core i9-9900K 3.6GHz
GeForce RTX 2080 (Desktop)
min:
37.5 fps, P0.1:
52.4 fps, P1:
59.1 fps, max:
238 fps
fps
34%
GeForce GTX 1650 Ti Max-Q:
25.8 fps
100%
GeForce RTX 2080 (Desktop):
42.5 [X] MSI GeForce RTX 2080 Intel Core i9-9900K 3.6GHz
GeForce RTX 2080 (Desktop)
min:
31 fps, P0.1:
32.1 fps, P1:
34.1 fps, max:
74.7 fps
fps
25%
GeForce GTX 1650 Ti Max-Q:
10.6 fps
GeForce GTX 1650 Ti Max-Q:
47 63 [X] MSI Summit E15 A11SCST Intel Core i7-1185G7 3GHz
GeForce GTX 1650 Ti Max-Q
min:
14 fps, P0.1:
28 fps, P1:
44 fps, max:
115 fps
74 ~ 61 fps
100%
GeForce RTX 2080 (Desktop):
98 [X] MSI GeForce RTX 2080 Intel Core i9-9900K 3.6GHz
GeForce RTX 2080 (Desktop)
P0.1:
58 fpsP1:
fps
fps
39%
GeForce GTX 1650 Ti Max-Q:
30 38 [X] MSI Summit E15 A11SCST Intel Core i7-1185G7 3GHz
GeForce GTX 1650 Ti Max-Q
min:
18 fps, P0.1:
22 fps, P1:
26 fps, max:
92 fps
45 ~ 38 fps
100%
GeForce RTX 2080 (Desktop):
83 [X] MSI GeForce RTX 2080 Intel Core i9-9900K 3.6GHz
GeForce RTX 2080 (Desktop)
P0.1:
46 fpsP1:
fps
fps
30%
GeForce GTX 1650 Ti Max-Q:
19 24 [X] MSI Summit E15 A11SCST Intel Core i7-1185G7 3GHz
GeForce GTX 1650 Ti Max-Q
min:
10 fps, P0.1:
12 fps, P1:
16 fps, max:
88 fps
32 ~ 25 fps
100%
GeForce RTX 2080 (Desktop):
73 [X] MSI GeForce RTX 2080 Intel Core i9-9900K 3.6GHz
GeForce RTX 2080 (Desktop)
P0.1:
42 fpsP1:
fps
fps
14%
GeForce GTX 1650 Ti Max-Q:
5 12 14 ~ 10 fps
100%
GeForce RTX 2080 (Desktop):
60 [X] MSI GeForce RTX 2080 Intel Core i9-9900K 3.6GHz
GeForce RTX 2080 (Desktop)
P0.1:
34 fpsP1:
fps
fps
20%
GeForce GTX 1650 Ti Max-Q:
12 fps
100%
GeForce RTX 2080 (Desktop):
38 [X] MSI GeForce RTX 2080 Intel Core i9-9900K 3.6GHz
GeForce RTX 2080 (Desktop)
P0.1:
22 fpsP1:
fps
fps
13%
GeForce GTX 1650 Ti Max-Q:
5 fps
100%
GeForce RTX 2080 (Desktop):
121 [X] MSI GeForce RTX 2080 Intel Core i9-9900K 3.6GHz
GeForce RTX 2080 (Desktop)
min:
19.2 fps, P0.1:
92.2 fps, P1:
101.9 fps, max:
154.5 fps
fps
100%
GeForce RTX 2080 (Desktop):
98.9 [X] MSI GeForce RTX 2080 Intel Core i9-9900K 3.6GHz
GeForce RTX 2080 (Desktop)
min:
19.1 fps, P0.1:
72 fps, P1:
83.5 fps, max:
135.2 fps
fps
100%
GeForce RTX 2080 (Desktop):
60.2 [X] MSI GeForce RTX 2080 Intel Core i9-9900K 3.6GHz
GeForce RTX 2080 (Desktop)
min:
19 fps, P0.1:
46.6 fps, P1:
50.4 fps, max:
93.1 fps
fps
100%
GeForce RTX 2080 (Desktop):
52.1 [X] MSI GeForce RTX 2080 Intel Core i9-9900K 3.6GHz
GeForce RTX 2080 (Desktop)
min:
18.7 fps, P0.1:
41.4 fps, P1:
44.2 fps, max:
125.2 fps
fps
100%
GeForce RTX 2080 (Desktop):
39.7 [X] MSI GeForce RTX 2080 Intel Core i9-9900K 3.6GHz
GeForce RTX 2080 (Desktop)
min:
19.4 fps, P0.1:
30.8 fps, P1:
34.6 fps, max:
72.5 fps
fps
GeForce GTX 1650 Ti Max-Q:
70 [X] MSI Summit E15 A11SCST Intel Core i7-1185G7 3GHz
GeForce GTX 1650 Ti Max-Q
min:
31 fps, P0.1:
43 fps, P1:
51 fps, max:
108 fps
89 ~ 80 fps
100%
GeForce RTX 2080 (Desktop):
110 [X] MSI GeForce RTX 2080 Intel Core i9-9900K 3.6GHz
GeForce RTX 2080 (Desktop)
min:
46.39 fps, P1:
82.24 fps, max:
158.71 fps
fps
45%
GeForce GTX 1650 Ti Max-Q:
43 [X] MSI Summit E15 A11SCST Intel Core i7-1185G7 3GHz
GeForce GTX 1650 Ti Max-Q
min:
19 fps, P0.1:
25 fps, P1:
33 fps, max:
59 fps
54 ~ 49 fps
100%
GeForce RTX 2080 (Desktop):
97.5 [X] MSI GeForce RTX 2080 Intel Core i9-9900K 3.6GHz
GeForce RTX 2080 (Desktop)
min:
43.06 fps, P1:
72.85 fps, max:
139.43 fps
fps
42%
GeForce GTX 1650 Ti Max-Q:
37 [X] MSI Summit E15 A11SCST Intel Core i7-1185G7 3GHz
GeForce GTX 1650 Ti Max-Q
min:
19 fps, P0.1:
22 fps, P1:
29 fps, max:
54 fps
39 [X] MSI Summit E15 A11SCST High Performance
Intel Core i7-1185G7 3GHz
GeForce GTX 1650 Ti Max-Q
min:
14 fps, P0.1:
17 fps, P1:
30 fps, max:
39 fps
47 ~ 41 fps
100%
GeForce RTX 2080 (Desktop):
78.6 [X] MSI GeForce RTX 2080 Intel Core i9-9900K 3.6GHz
GeForce RTX 2080 (Desktop)
min:
27.14 fps, P1:
59.65 fps, max:
129.03 fps
fps
20%
GeForce GTX 1650 Ti Max-Q:
11 21 ~ 16 fps
100%
GeForce RTX 2080 (Desktop):
58 [X] MSI GeForce RTX 2080 Intel Core i9-9900K 3.6GHz
GeForce RTX 2080 (Desktop)
min:
17.95 fps, P1:
36.76 fps, max:
120.81 fps
fps
24%
GeForce GTX 1650 Ti Max-Q:
14 fps
100%
GeForce RTX 2080 (Desktop):
34.7 [X] MSI GeForce RTX 2080 Intel Core i9-9900K 3.6GHz
GeForce RTX 2080 (Desktop)
min:
14.47 fps, P1:
18.08 fps, max:
96.46 fps
fps
100%
GeForce RTX 2080 (Desktop):
255 [X] MSI GeForce RTX 2080 1.5.4.5
Intel Core i9-9900K 3.6GHz
GeForce RTX 2080 (Desktop)
min:
10.4 fps, P1:
180 fps, max:
342 fps
fps
82%
GeForce GTX 1650 Ti Max-Q:
210 fps
100%
GeForce RTX 2080 (Desktop):
253 [X] MSI GeForce RTX 2080 1.5.4.5
Intel Core i9-9900K 3.6GHz
GeForce RTX 2080 (Desktop)
min:
67.4 fps, P1:
178 fps, max:
345 fps
fps
80%
GeForce GTX 1650 Ti Max-Q:
202 fps
100%
GeForce RTX 2080 (Desktop):
243 [X] MSI GeForce RTX 2080 1.5.4.5
Intel Core i9-9900K 3.6GHz
GeForce RTX 2080 (Desktop)
min:
77.6 fps, P1:
170 fps, max:
349 fps
fps
79%
GeForce GTX 1650 Ti Max-Q:
192.9 fps
100%
GeForce RTX 2080 (Desktop):
242 [X] MSI GeForce RTX 2080 1.5.4.5
Intel Core i9-9900K 3.6GHz
GeForce RTX 2080 (Desktop)
min:
17.3 fps, P1:
171 fps, max:
337 fps
fps
68%
GeForce GTX 1650 Ti Max-Q:
165.2 fps
100%
GeForce RTX 2080 (Desktop):
239 [X] MSI GeForce RTX 2080 1.5.4.5
Intel Core i9-9900K 3.6GHz
GeForce RTX 2080 (Desktop)
min:
18.4 fps, P1:
168 fps, max:
342 fps
fps
54%
GeForce GTX 1650 Ti Max-Q:
129.6 fps
100%
GeForce RTX 2080 (Desktop):
223 [X] MSI GeForce RTX 2080 1.5.4.5
Intel Core i9-9900K 3.6GHz
GeForce RTX 2080 (Desktop)
min:
69.3 fps, P1:
152 fps, max:
300 fps
fps
36%
GeForce GTX 1650 Ti Max-Q:
79.6 fps
100%
GeForce RTX 2080 (Desktop):
413 [X] MSI GeForce RTX 2080 1.5.4.5
Intel Core i9-9900K 3.6GHz
GeForce RTX 2080 (Desktop)
min:
178 fps, P1:
258 fps, max:
615 fps
fps
54%
GeForce GTX 1650 Ti Max-Q:
222 fps
100%
GeForce RTX 2080 (Desktop):
350 [X] MSI GeForce RTX 2080 1.5.4.5
Intel Core i9-9900K 3.6GHz
GeForce RTX 2080 (Desktop)
min:
181 fps, P1:
251 fps, max:
505 fps
fps
35%
GeForce GTX 1650 Ti Max-Q:
124 fps
100%
GeForce RTX 2080 (Desktop):
308 [X] MSI GeForce RTX 2080 1.5.4.5
Intel Core i9-9900K 3.6GHz
GeForce RTX 2080 (Desktop)
min:
169 fps, P1:
239 fps, max:
434 fps
fps
37%
GeForce GTX 1650 Ti Max-Q:
112.9 fps
100%
GeForce RTX 2080 (Desktop):
284 [X] MSI GeForce RTX 2080 1.5.4.5
Intel Core i9-9900K 3.6GHz
GeForce RTX 2080 (Desktop)
min:
152 fps, P1:
223 fps, max:
432 fps
fps
36%
GeForce GTX 1650 Ti Max-Q:
103.4 fps
100%
GeForce RTX 2080 (Desktop):
197 [X] MSI GeForce RTX 2080 1.5.4.5
Intel Core i9-9900K 3.6GHz
GeForce RTX 2080 (Desktop)
min:
114 fps, P1:
158 fps, max:
375 fps
fps
36%
GeForce GTX 1650 Ti Max-Q:
70 fps
100%
GeForce RTX 2080 (Desktop):
115 [X] MSI GeForce RTX 2080 1.5.4.5
Intel Core i9-9900K 3.6GHz
GeForce RTX 2080 (Desktop)
min:
62.5 fps, P1:
89.6 fps, max:
259 fps
fps
27%
GeForce GTX 1650 Ti Max-Q:
30.7 fps
100%
GeForce RTX 2080 (Desktop):
137 [X] MSI GeForce RTX 2080 1.5.4.5
Intel Core i9-9900K 3.6GHz
GeForce RTX 2080 (Desktop)
min:
71.5 fps, P1:
98 fps, max:
219 fps
fps
69%
GeForce GTX 1650 Ti Max-Q:
93.9 fps
100%
GeForce RTX 2080 (Desktop):
121 [X] MSI GeForce RTX 2080 1.5.4.5
Intel Core i9-9900K 3.6GHz
GeForce RTX 2080 (Desktop)
min:
67.9 fps, P1:
88 fps, max:
210 fps
fps
38%
GeForce GTX 1650 Ti Max-Q:
46.2 fps
100%
GeForce RTX 2080 (Desktop):
112 [X] MSI GeForce RTX 2080 1.5.4.5
Intel Core i9-9900K 3.6GHz
GeForce RTX 2080 (Desktop)
min:
66.2 fps, P1:
82.3 fps, max:
186 fps
fps
38%
GeForce GTX 1650 Ti Max-Q:
43 fps
100%
GeForce RTX 2080 (Desktop):
88 [X] MSI GeForce RTX 2080 1.5.4.5
Intel Core i9-9900K 3.6GHz
GeForce RTX 2080 (Desktop)
min:
50.1 fps, P1:
62.6 fps, max:
155 fps
fps
32%
GeForce GTX 1650 Ti Max-Q:
27.9 fps
100%
GeForce RTX 2080 (Desktop):
47.6 [X] MSI GeForce RTX 2080 1.5.4.5
Intel Core i9-9900K 3.6GHz
GeForce RTX 2080 (Desktop)
min:
35.3 fps, P1:
41.5 fps, max:
87.2 fps
fps
30%
GeForce GTX 1650 Ti Max-Q:
14.1 fps
100%
GeForce RTX 2080 (Desktop):
175 [X] MSI GeForce RTX 2080 Intel Core i9-9900K 3.6GHz
GeForce RTX 2080 (Desktop)
min:
12.6 fps, P1:
106 fps, max:
357 fps
fps
60%
GeForce GTX 1650 Ti Max-Q:
94.8 [X] MSI Summit E15 A11SCST Intel Core i7-1185G7 3GHz
GeForce GTX 1650 Ti Max-Q
min:
6.8 fps, P0.1:
19 fps, P1:
48.4 fps, max:
187 fps
115.7 ~ 105 fps
100%
GeForce RTX 2080 (Desktop):
101 [X] MSI GeForce RTX 2080 Intel Core i9-9900K 3.6GHz
GeForce RTX 2080 (Desktop)
min:
7.59 fps, P1:
62.2 fps, max:
188 fps
fps
50%
GeForce GTX 1650 Ti Max-Q:
47.5 [X] MSI Summit E15 A11SCST Intel Core i7-1185G7 3GHz
GeForce GTX 1650 Ti Max-Q
min:
7.4 fps, P0.1:
10.4 fps, P1:
23.4 fps, max:
86.8 fps
51.9 ~ 50 fps
100%
GeForce RTX 2080 (Desktop):
94.5 [X] MSI GeForce RTX 2080 Intel Core i9-9900K 3.6GHz
GeForce RTX 2080 (Desktop)
min:
3.58 fps, P1:
59.2 fps, max:
170 fps
fps
41%
GeForce GTX 1650 Ti Max-Q:
36.8 [X] MSI Summit E15 A11SCST Intel Core i7-1185G7 3GHz
GeForce GTX 1650 Ti Max-Q
min:
12.2 fps, P0.1:
12.7 fps, P1:
19.3 fps, max:
92.5 fps
40.8 ~ 39 fps
100%
GeForce RTX 2080 (Desktop):
85.3 [X] MSI GeForce RTX 2080 Intel Core i9-9900K 3.6GHz
GeForce RTX 2080 (Desktop)
min:
3.17 fps, P1:
50.9 fps, max:
157 fps
fps
30%
GeForce GTX 1650 Ti Max-Q:
20.9 [X] MSI Summit E15 A11SCST Intel Core i7-1185G7 3GHz
GeForce GTX 1650 Ti Max-Q
min:
6.91 fps, P0.1:
8.01 fps, P1:
9.96 fps, max:
62.5 fps
30.5 ~ 26 fps
100%
GeForce RTX 2080 (Desktop):
80.3 [X] MSI GeForce RTX 2080 Intel Core i9-9900K 3.6GHz
GeForce RTX 2080 (Desktop)
min:
11.7 fps, P1:
47.4 fps, max:
138 fps
fps
28%
GeForce GTX 1650 Ti Max-Q:
22.3 fps
100%
GeForce RTX 2080 (Desktop):
54 [X] MSI GeForce RTX 2080 Intel Core i9-9900K 3.6GHz
GeForce RTX 2080 (Desktop)
min:
17.6 fps, P1:
31.4 fps, max:
96.7 fps
fps
GeForce GTX 1650 Ti Max-Q:
154.1 fps
100%
GeForce RTX 2080 (Desktop):
165.6 [X] MSI GeForce RTX 2080 Intel Core i9-9900K 3.6GHz
GeForce RTX 2080 (Desktop)
min:
17.1 fps, P0.1:
64.1 fps, P1:
80.8 fps, max:
279 fps
fps
36%
GeForce GTX 1650 Ti Max-Q:
59.8 fps
100%
GeForce RTX 2080 (Desktop):
96.4 [X] MSI GeForce RTX 2080 Intel Core i9-9900K 3.6GHz
GeForce RTX 2080 (Desktop)
min:
11.9 fps, P0.1:
37 fps, P1:
47.1 fps, max:
139 fps
fps
33%
GeForce GTX 1650 Ti Max-Q:
31.9 fps
100%
GeForce RTX 2080 (Desktop):
61.6 [X] MSI GeForce RTX 2080 Intel Core i9-9900K 3.6GHz
GeForce RTX 2080 (Desktop)
min:
31.2 fps, P0.1:
31.7 fps, P1:
35 fps, max:
79.4 fps
fps
38%
GeForce GTX 1650 Ti Max-Q:
23.6 fps
100%
GeForce RTX 2080 (Desktop):
48.1 [X] MSI GeForce RTX 2080 Intel Core i9-9900K 3.6GHz
GeForce RTX 2080 (Desktop)
min:
30.5 fps, P0.1:
30.7 fps, P1:
33.2 fps, max:
68.5 fps
fps
100%
GeForce RTX 2080 (Desktop):
28.4 [X] MSI GeForce RTX 2080 Intel Core i9-9900K 3.6GHz
GeForce RTX 2080 (Desktop)
min:
2.7 fps, P0.1:
4.49 fps, P1:
12.9 fps, max:
74.1 fps
fps
100%
GeForce RTX 2080 (Desktop):
81.7 [X] MSI GeForce RTX 2080 1.5.4.5
Intel Core i9-9900K 3.6GHz
GeForce RTX 2080 (Desktop)
min:
8.71 fps, P1:
61.856 fps, max:
99.8 fps
fps
100%
GeForce RTX 2080 (Desktop):
71.6 [X] MSI GeForce RTX 2080 1.5.4.5
Intel Core i9-9900K 3.6GHz
GeForce RTX 2080 (Desktop)
min:
6.43 fps, P1:
52.364 fps, max:
84.9 fps
fps
100%
GeForce RTX 2080 (Desktop):
58.4 [X] MSI GeForce RTX 2080 1.5.4.5
Intel Core i9-9900K 3.6GHz
GeForce RTX 2080 (Desktop)
min:
5.84 fps, P1:
46.6 fps, max:
66.8 fps
fps
100%
GeForce RTX 2080 (Desktop):
47.3 [X] MSI GeForce RTX 2080 1.5.4.5
Intel Core i9-9900K 3.6GHz
GeForce RTX 2080 (Desktop)
min:
7.05 fps, P1:
38.736 fps, max:
54.7 fps
fps
100%
GeForce RTX 2080 (Desktop):
40.3 [X] MSI GeForce RTX 2080 1.5.4.5
Intel Core i9-9900K 3.6GHz
GeForce RTX 2080 (Desktop)
min:
7.95 fps, P1:
32.372 fps, max:
50.1 fps
fps
100%
GeForce RTX 2080 (Desktop):
25.5 [X] MSI GeForce RTX 2080 1.5.4.5
Intel Core i9-9900K 3.6GHz
GeForce RTX 2080 (Desktop)
min:
10.2 fps, P1:
21.814 fps, max:
45.5 fps
fps
100%
GeForce RTX 2080 (Desktop):
162 [X] MSI GeForce RTX 2080 Intel Core i9-9900K 3.6GHz
GeForce RTX 2080 (Desktop)
min:
30 fps
fps
56%
GeForce GTX 1650 Ti Max-Q:
80 99 ~ 90 fps
100%
GeForce RTX 2080 (Desktop):
124 [X] MSI GeForce RTX 2080 Intel Core i9-9900K 3.6GHz
GeForce RTX 2080 (Desktop)
min:
23 fps
fps
40%
GeForce GTX 1650 Ti Max-Q:
42 58 ~ 50 fps
100%
GeForce RTX 2080 (Desktop):
111 [X] MSI GeForce RTX 2080 Intel Core i9-9900K 3.6GHz
GeForce RTX 2080 (Desktop)
min:
28 fps
fps
36%
GeForce GTX 1650 Ti Max-Q:
35 36 [X] MSI Summit E15 A11SCST High Performance
Intel Core i7-1185G7 3GHz
GeForce GTX 1650 Ti Max-Q
min:
24 fps, max:
57 fps
48 ~ 40 fps
100%
GeForce RTX 2080 (Desktop):
93 [X] MSI GeForce RTX 2080 Intel Core i9-9900K 3.6GHz
GeForce RTX 2080 (Desktop)
min:
26 fps
fps
39%
GeForce GTX 1650 Ti Max-Q:
32 40 ~ 36 fps
100%
GeForce RTX 2080 (Desktop):
74 [X] MSI GeForce RTX 2080 Intel Core i9-9900K 3.6GHz
GeForce RTX 2080 (Desktop)
min:
16 fps
fps
41%
GeForce GTX 1650 Ti Max-Q:
30 fps
100%
GeForce RTX 2080 (Desktop):
42 [X] MSI GeForce RTX 2080 Intel Core i9-9900K 3.6GHz
GeForce RTX 2080 (Desktop)
min:
17 fps
fps
19%
GeForce GTX 1650 Ti Max-Q:
8 fps
100%
GeForce RTX 2080 (Desktop):
186 [X] MSI GeForce RTX 2080 Intel Core i9-9900K 3.6GHz
GeForce RTX 2080 (Desktop)
min:
125 fps
fps
50%
GeForce GTX 1650 Ti Max-Q:
85.6 99.6 ~ 93 fps
100%
GeForce RTX 2080 (Desktop):
163 [X] MSI GeForce RTX 2080 Intel Core i9-9900K 3.6GHz
GeForce RTX 2080 (Desktop)
min:
120 fps
fps
35%
GeForce GTX 1650 Ti Max-Q:
53.6 60.9 ~ 57 fps
100%
GeForce RTX 2080 (Desktop):
151 [X] MSI GeForce RTX 2080 Intel Core i9-9900K 3.6GHz
GeForce RTX 2080 (Desktop)
min:
120 fps
fps
36%
GeForce GTX 1650 Ti Max-Q:
50.7 56.4 ~ 54 fps
100%
GeForce RTX 2080 (Desktop):
147 [X] MSI GeForce RTX 2080 Intel Core i9-9900K 3.6GHz
GeForce RTX 2080 (Desktop)
min:
116 fps
fps
35%
GeForce GTX 1650 Ti Max-Q:
49.5 54.4 ~ 52 fps
100%
GeForce RTX 2080 (Desktop):
108 [X] MSI GeForce RTX 2080 Intel Core i9-9900K 3.6GHz
GeForce RTX 2080 (Desktop)
min:
93 fps
fps
33%
GeForce GTX 1650 Ti Max-Q:
35.9 fps
100%
GeForce RTX 2080 (Desktop):
61.8 [X] MSI GeForce RTX 2080 Intel Core i9-9900K 3.6GHz
GeForce RTX 2080 (Desktop)
min:
45 fps
fps
27%
GeForce GTX 1650 Ti Max-Q:
16.8 fps
100%
GeForce RTX 2080 (Desktop):
290 [X] MSI GeForce RTX 2080 Intel Core i9-9900K 3.6GHz
GeForce RTX 2080 (Desktop)
min:
227 fps
fps
73%
GeForce GTX 1650 Ti Max-Q:
211 fps
100%
GeForce RTX 2080 (Desktop):
246 [X] MSI GeForce RTX 2080 Intel Core i9-9900K 3.6GHz
GeForce RTX 2080 (Desktop)
min:
191 fps
fps
43%
GeForce GTX 1650 Ti Max-Q:
107 fps
100%
GeForce RTX 2080 (Desktop):
229 [X] MSI GeForce RTX 2080 Intel Core i9-9900K 3.6GHz
GeForce RTX 2080 (Desktop)
min:
183 fps
fps
36%
GeForce GTX 1650 Ti Max-Q:
82 fps
100%
GeForce RTX 2080 (Desktop):
169 [X] MSI GeForce RTX 2080 Intel Core i9-9900K 3.6GHz
GeForce RTX 2080 (Desktop)
min:
143 fps
fps
34%
GeForce GTX 1650 Ti Max-Q:
57 fps
100%
GeForce RTX 2080 (Desktop):
129 [X] MSI GeForce RTX 2080 Intel Core i9-9900K 3.6GHz
GeForce RTX 2080 (Desktop)
min:
110 fps
fps
32%
GeForce GTX 1650 Ti Max-Q:
41 fps
100%
GeForce RTX 2080 (Desktop):
76 [X] MSI GeForce RTX 2080 Intel Core i9-9900K 3.6GHz
GeForce RTX 2080 (Desktop)
min:
64 fps
fps
29%
GeForce GTX 1650 Ti Max-Q:
22 fps
100%
GeForce RTX 2080 (Desktop):
270 [X] MSI GeForce RTX 2080 Intel Core i9-9900K 3.6GHz
GeForce RTX 2080 (Desktop)
min:
211 fps
fps
100%
GeForce RTX 2080 (Desktop):
263 [X] MSI GeForce RTX 2080 Intel Core i9-9900K 3.6GHz
GeForce RTX 2080 (Desktop)
min:
202 fps
fps
100%
GeForce RTX 2080 (Desktop):
254 [X] MSI GeForce RTX 2080 Intel Core i9-9900K 3.6GHz
GeForce RTX 2080 (Desktop)
min:
192 fps
fps
100%
GeForce RTX 2080 (Desktop):
247 [X] MSI GeForce RTX 2080 Intel Core i9-9900K 3.6GHz
GeForce RTX 2080 (Desktop)
min:
190 fps
fps
100%
GeForce RTX 2080 (Desktop):
234 [X] MSI GeForce RTX 2080 Intel Core i9-9900K 3.6GHz
GeForce RTX 2080 (Desktop)
min:
190 fps
fps
100%
GeForce RTX 2080 (Desktop):
315 [X] MSI GeForce RTX 2080 Intel Core i9-9900K 3.6GHz
GeForce RTX 2080 (Desktop)
fps
52%
GeForce GTX 1650 Ti Max-Q:
162.9 fps
100%
GeForce RTX 2080 (Desktop):
227 [X] MSI GeForce RTX 2080 Intel Core i9-9900K 3.6GHz
GeForce RTX 2080 (Desktop)
fps
32%
GeForce GTX 1650 Ti Max-Q:
73.7 fps
100%
GeForce RTX 2080 (Desktop):
158 [X] MSI GeForce RTX 2080 Intel Core i9-9900K 3.6GHz
GeForce RTX 2080 (Desktop)
fps
28%
GeForce GTX 1650 Ti Max-Q:
44.4 fps
100%
GeForce RTX 2080 (Desktop):
115 [X] MSI GeForce RTX 2080 Intel Core i9-9900K 3.6GHz
GeForce RTX 2080 (Desktop)
fps
29%
GeForce GTX 1650 Ti Max-Q:
33.4 fps
100%
GeForce RTX 2080 (Desktop):
87.3 [X] MSI GeForce RTX 2080 Intel Core i9-9900K 3.6GHz
GeForce RTX 2080 (Desktop)
fps
27%
GeForce GTX 1650 Ti Max-Q:
23.5 fps
100%
GeForce RTX 2080 (Desktop):
46.9 [X] MSI GeForce RTX 2080 Intel Core i9-9900K 3.6GHz
GeForce RTX 2080 (Desktop)
fps
29%
GeForce GTX 1650 Ti Max-Q:
13.5 fps
100%
GeForce RTX 2080 (Desktop):
293 [X] MSI GeForce RTX 2080 Intel Core i9-9900K 3.6GHz
GeForce RTX 2080 (Desktop)
min:
143 fps
fps
50%
GeForce GTX 1650 Ti Max-Q:
145.1 fps
100%
GeForce RTX 2080 (Desktop):
249 [X] MSI GeForce RTX 2080 Intel Core i9-9900K 3.6GHz
GeForce RTX 2080 (Desktop)
min:
127 fps
fps
37%
GeForce GTX 1650 Ti Max-Q:
91.2 fps
100%
GeForce RTX 2080 (Desktop):
228 [X] MSI GeForce RTX 2080 Intel Core i9-9900K 3.6GHz
GeForce RTX 2080 (Desktop)
min:
125 fps
fps
23%
GeForce GTX 1650 Ti Max-Q:
52.6 fps
100%
GeForce RTX 2080 (Desktop):
223 [X] MSI GeForce RTX 2080 Intel Core i9-9900K 3.6GHz
GeForce RTX 2080 (Desktop)
min:
122 fps
fps
100%
GeForce RTX 2080 (Desktop):
161 [X] MSI GeForce RTX 2080 Intel Core i9-9900K 3.6GHz
GeForce RTX 2080 (Desktop)
min:
116 fps
fps
100%
GeForce RTX 2080 (Desktop):
87.5 [X] MSI GeForce RTX 2080 Intel Core i9-9900K 3.6GHz
GeForce RTX 2080 (Desktop)
min:
60 fps
fps
100%
GeForce RTX 2080 (Desktop):
225 [X] MSI GeForce RTX 2080 Intel Core i9-9900K 3.6GHz
GeForce RTX 2080 (Desktop)
min:
204 fps
fps
51%
GeForce GTX 1650 Max-Q:
114.8 fps
51%
GeForce GTX 1650 Ti Max-Q:
115.7 fps
100%
GeForce RTX 2080 (Desktop):
164 [X] MSI GeForce RTX 2080 Intel Core i9-9900K 3.6GHz
GeForce RTX 2080 (Desktop)
min:
150 fps
fps
28%
GeForce GTX 1650 Max-Q:
45.6 fps
31%
GeForce GTX 1650 Ti Max-Q:
50.1 fps
100%
GeForce RTX 2080 (Desktop):
145 [X] MSI GeForce RTX 2080 Intel Core i9-9900K 3.6GHz
GeForce RTX 2080 (Desktop)
min:
139 fps
fps
24%
GeForce GTX 1650 Max-Q:
35.3 fps
29%
GeForce GTX 1650 Ti Max-Q:
41.8 fps
100%
GeForce RTX 2080 (Desktop):
98.4 [X] MSI GeForce RTX 2080 Intel Core i9-9900K 3.6GHz
GeForce RTX 2080 (Desktop)
min:
90 fps
fps
100%
GeForce RTX 2080 (Desktop):
45.4 [X] MSI GeForce RTX 2080 Intel Core i9-9900K 3.6GHz
GeForce RTX 2080 (Desktop)
min:
43 fps
fps
100%
GeForce RTX 2080 (Desktop):
121 [X] MSI GeForce RTX 2080 Intel Core i9-9900K 3.6GHz
GeForce RTX 2080 (Desktop)
min:
120 fps
fps
100%
GeForce GTX 1650 Ti Max-Q:
120.7 fps
100%
GeForce RTX 2080 (Desktop):
121 [X] MSI GeForce RTX 2080 Intel Core i9-9900K 3.6GHz
GeForce RTX 2080 (Desktop)
min:
118 fps
fps
59%
GeForce GTX 1650 Ti Max-Q:
71.2 fps
100%
GeForce RTX 2080 (Desktop):
121 [X] MSI GeForce RTX 2080 Intel Core i9-9900K 3.6GHz
GeForce RTX 2080 (Desktop)
min:
116 fps
fps
44%
GeForce GTX 1650 Ti Max-Q:
52.8 fps
100%
GeForce RTX 2080 (Desktop):
121 [X] MSI GeForce RTX 2080 Intel Core i9-9900K 3.6GHz
GeForce RTX 2080 (Desktop)
min:
114 fps
fps
39%
GeForce GTX 1650 Ti Max-Q:
47 fps
100%
GeForce RTX 2080 (Desktop):
117 [X] MSI GeForce RTX 2080 Intel Core i9-9900K 3.6GHz
GeForce RTX 2080 (Desktop)
min:
96 fps
fps
100%
GeForce RTX 2080 (Desktop):
54.9 [X] MSI GeForce RTX 2080 Intel Core i9-9900K 3.6GHz
GeForce RTX 2080 (Desktop)
min:
47 fps
fps
100%
GeForce RTX 2080 (Desktop):
153 [X] MSI GeForce RTX 2080 Intel Core i9-9900K 3.6GHz
GeForce RTX 2080 (Desktop)
min:
19 fps
fps
36%
GeForce GTX 1650 Max-Q:
54.4 56.3 ~ 55 fps
100%
GeForce RTX 2080 (Desktop):
134 [X] MSI GeForce RTX 2080 Intel Core i9-9900K 3.6GHz
GeForce RTX 2080 (Desktop)
min:
13 fps
fps
31%
GeForce GTX 1650 Max-Q:
40.1 43.5 ~ 42 fps
100%
GeForce RTX 2080 (Desktop):
96.9 [X] MSI GeForce RTX 2080 Intel Core i9-9900K 3.6GHz
GeForce RTX 2080 (Desktop)
min:
9 fps
fps
29%
GeForce GTX 1650 Max-Q:
26.5 29.3 ~ 28 fps
100%
GeForce RTX 2080 (Desktop):
63.2 [X] MSI GeForce RTX 2080 Intel Core i9-9900K 3.6GHz
GeForce RTX 2080 (Desktop)
min:
8 fps
fps
27%
GeForce GTX 1650 Max-Q:
16.2 18.6 ~ 17 fps
100%
GeForce RTX 2080 (Desktop):
51.7 [X] MSI GeForce RTX 2080 Intel Core i9-9900K 3.6GHz
GeForce RTX 2080 (Desktop)
min:
5 fps
fps
100%
GeForce RTX 2080 (Desktop):
34.1 [X] MSI GeForce RTX 2080 Intel Core i9-9900K 3.6GHz
GeForce RTX 2080 (Desktop)
min:
6 fps
fps
100%
GeForce RTX 2080 (Desktop):
109 [X] MSI GeForce RTX 2080 Intel Core i9-9900K 3.6GHz
GeForce RTX 2080 (Desktop)
min:
68 fps
fps
50%
GeForce GTX 1650 Max-Q:
50.4 57.2 ~ 54 fps
58%
GeForce GTX 1650 Ti Max-Q:
63.3 fps
100%
GeForce RTX 2080 (Desktop):
102 [X] MSI GeForce RTX 2080 Intel Core i9-9900K 3.6GHz
GeForce RTX 2080 (Desktop)
min:
64 fps
fps
44%
GeForce GTX 1650 Max-Q:
40.3 49.7 ~ 45 fps
52%
GeForce GTX 1650 Ti Max-Q:
53.2 fps
100%
GeForce RTX 2080 (Desktop):
99 [X] MSI GeForce RTX 2080 Intel Core i9-9900K 3.6GHz
GeForce RTX 2080 (Desktop)
min:
63 fps
fps
42%
GeForce GTX 1650 Max-Q:
39.6 44.4 ~ 42 fps
46%
GeForce GTX 1650 Ti Max-Q:
46 fps
100%
GeForce RTX 2080 (Desktop):
95.3 [X] MSI GeForce RTX 2080 Intel Core i9-9900K 3.6GHz
GeForce RTX 2080 (Desktop)
min:
64 fps
fps
100%
GeForce RTX 2080 (Desktop):
58.9 [X] MSI GeForce RTX 2080 Intel Core i9-9900K 3.6GHz
GeForce RTX 2080 (Desktop)
min:
50 fps
fps
22%
GeForce GTX 1650 Max-Q:
12.7 fps
100%
GeForce RTX 2080 (Desktop):
133 [X] MSI GeForce RTX 2080 Intel Core i9-9900K 3.6GHz
GeForce RTX 2080 (Desktop)
min:
116 fps
fps
51%
GeForce GTX 1650 Max-Q:
67.6 68.9 ~ 68 fps
46%
GeForce GTX 1650 Ti Max-Q:
61.8 fps
100%
GeForce RTX 2080 (Desktop):
124 [X] MSI GeForce RTX 2080 Intel Core i9-9900K 3.6GHz
GeForce RTX 2080 (Desktop)
min:
109 fps
fps
41%
GeForce GTX 1650 Max-Q:
50.6 52.2 ~ 51 fps
40%
GeForce GTX 1650 Ti Max-Q:
49.3 fps
100%
GeForce RTX 2080 (Desktop):
117 [X] MSI GeForce RTX 2080 Intel Core i9-9900K 3.6GHz
GeForce RTX 2080 (Desktop)
min:
102 fps
fps
38%
GeForce GTX 1650 Max-Q:
44 46.8 ~ 45 fps
39%
GeForce GTX 1650 Ti Max-Q:
45.8 fps
100%
GeForce RTX 2080 (Desktop):
101 [X] MSI GeForce RTX 2080 Intel Core i9-9900K 3.6GHz
GeForce RTX 2080 (Desktop)
min:
88 fps
fps
39%
GeForce GTX 1650 Max-Q:
37.2 40.6 ~ 39 fps
34%
GeForce GTX 1650 Ti Max-Q:
33.9 fps
100%
GeForce RTX 2080 (Desktop):
88.4 [X] MSI GeForce RTX 2080 Intel Core i9-9900K 3.6GHz
GeForce RTX 2080 (Desktop)
min:
72 fps
fps
100%
GeForce RTX 2080 (Desktop):
53.8 [X] MSI GeForce RTX 2080 Intel Core i9-9900K 3.6GHz
GeForce RTX 2080 (Desktop)
min:
47 fps
fps
100%
GeForce RTX 2080 (Desktop):
274 [X] MSI GeForce RTX 2080 Intel Core i9-9900K 3.6GHz
GeForce RTX 2080 (Desktop)
min:
192 fps
fps
33%
GeForce GTX 1650 Max-Q:
85 94.1 ~ 90 fps
100%
GeForce RTX 2080 (Desktop):
187 [X] MSI GeForce RTX 2080 Intel Core i9-9900K 3.6GHz
GeForce RTX 2080 (Desktop)
min:
149 fps
fps
30%
GeForce GTX 1650 Max-Q:
54.8 59 ~ 57 fps
100%
GeForce RTX 2080 (Desktop):
178 [X] MSI GeForce RTX 2080 Intel Core i9-9900K 3.6GHz
GeForce RTX 2080 (Desktop)
min:
137 fps
fps
26%
GeForce GTX 1650 Max-Q:
44.1 49.8 ~ 47 fps
100%
GeForce RTX 2080 (Desktop):
145 [X] MSI GeForce RTX 2080 Intel Core i9-9900K 3.6GHz
GeForce RTX 2080 (Desktop)
min:
108 fps
fps
28%
GeForce GTX 1650 Max-Q:
38.4 40.6 ~ 40 fps
100%
GeForce RTX 2080 (Desktop):
110 [X] MSI GeForce RTX 2080 Intel Core i9-9900K 3.6GHz
GeForce RTX 2080 (Desktop)
min:
81 fps
fps
100%
GeForce RTX 2080 (Desktop):
65.1 [X] MSI GeForce RTX 2080 Intel Core i9-9900K 3.6GHz
GeForce RTX 2080 (Desktop)
min:
52 fps
fps
100%
GeForce RTX 2080 (Desktop):
212 [X] MSI GeForce RTX 2080 Intel Core i9-9900K 3.6GHz
GeForce RTX 2080 (Desktop)
min:
169 fps
fps
50%
GeForce GTX 1650 Max-Q:
92.4 121.5 ~ 107 fps
54%
GeForce GTX 1650 Ti Max-Q:
114 fps
100%
GeForce RTX 2080 (Desktop):
169 [X] MSI GeForce RTX 2080 Intel Core i9-9900K 3.6GHz
GeForce RTX 2080 (Desktop)
min:
141 fps
fps
37%
GeForce GTX 1650 Max-Q:
60 65.9 ~ 63 fps
46%
GeForce GTX 1650 Ti Max-Q:
76.9 fps
100%
GeForce RTX 2080 (Desktop):
140 [X] MSI GeForce RTX 2080 Intel Core i9-9900K 3.6GHz
GeForce RTX 2080 (Desktop)
min:
116 fps
fps
36%
GeForce GTX 1650 Max-Q:
47.6 53.4 ~ 51 fps
46%
GeForce GTX 1650 Ti Max-Q:
64.3 fps
100%
GeForce RTX 2080 (Desktop):
111 [X] MSI GeForce RTX 2080 Intel Core i9-9900K 3.6GHz
GeForce RTX 2080 (Desktop)
min:
91 fps
fps
32%
GeForce GTX 1650 Max-Q:
35.2 36.7 ~ 36 fps
25%
GeForce GTX 1650 Ti Max-Q:
27.5 fps
100%
GeForce RTX 2080 (Desktop):
91.2 [X] MSI GeForce RTX 2080 Intel Core i9-9900K 3.6GHz
GeForce RTX 2080 (Desktop)
min:
75 fps
fps
100%
GeForce RTX 2080 (Desktop):
60 [X] MSI GeForce RTX 2080 Intel Core i9-9900K 3.6GHz
GeForce RTX 2080 (Desktop)
min:
42 fps
fps
100%
GeForce RTX 2080 (Desktop):
148 [X] MSI GeForce RTX 2080 Intel Core i9-9900K 3.6GHz
GeForce RTX 2080 (Desktop)
min:
63 fps
fps
47%
GeForce GTX 1650 Max-Q:
63 75 ~ 69 fps
50%
GeForce GTX 1650 Ti Max-Q:
74 fps
100%
GeForce RTX 2080 (Desktop):
132 [X] MSI GeForce RTX 2080 Intel Core i9-9900K 3.6GHz
GeForce RTX 2080 (Desktop)
min:
60 fps
fps
32%
GeForce GTX 1650 Max-Q:
41 43 ~ 42 fps
34%
GeForce GTX 1650 Ti Max-Q:
45 fps
100%
GeForce RTX 2080 (Desktop):
117 [X] MSI GeForce RTX 2080 Intel Core i9-9900K 3.6GHz
GeForce RTX 2080 (Desktop)
min:
57 fps
fps
34%
GeForce GTX 1650 Max-Q:
39 41 ~ 40 fps
29%
GeForce GTX 1650 Ti Max-Q:
34 fps
100%
GeForce RTX 2080 (Desktop):
90 [X] MSI GeForce RTX 2080 Intel Core i9-9900K 3.6GHz
GeForce RTX 2080 (Desktop)
min:
54 fps
fps
28%
GeForce GTX 1650 Max-Q:
24 26 ~ 25 fps
24%
GeForce GTX 1650 Ti Max-Q:
22 fps
100%
GeForce RTX 2080 (Desktop):
69 [X] MSI GeForce RTX 2080 Intel Core i9-9900K 3.6GHz
GeForce RTX 2080 (Desktop)
min:
53 fps
fps
100%
GeForce RTX 2080 (Desktop):
38 [X] MSI GeForce RTX 2080 Intel Core i9-9900K 3.6GHz
GeForce RTX 2080 (Desktop)
min:
31 fps
fps
100%
GeForce RTX 2080 (Desktop):
298 [X] MSI GeForce RTX 2080 Intel Core i9-9900K 3.6GHz
GeForce RTX 2080 (Desktop)
min:
227 fps
fps
58%
GeForce GTX 1650 Max-Q:
150 198.6 ~ 174 fps
100%
GeForce RTX 2080 (Desktop):
289 [X] MSI GeForce RTX 2080 Intel Core i9-9900K 3.6GHz
GeForce RTX 2080 (Desktop)
min:
222 fps
fps
43%
GeForce GTX 1650 Max-Q:
118 127.9 ~ 123 fps
100%
GeForce RTX 2080 (Desktop):
275 [X] MSI GeForce RTX 2080 Intel Core i9-9900K 3.6GHz
GeForce RTX 2080 (Desktop)
min:
213 fps
fps
43%
GeForce GTX 1650 Max-Q:
115 121.5 ~ 118 fps
100%
GeForce RTX 2080 (Desktop):
272 [X] MSI GeForce RTX 2080 Intel Core i9-9900K 3.6GHz
GeForce RTX 2080 (Desktop)
min:
213 fps
fps
43%
GeForce GTX 1650 Max-Q:
114 117.7 ~ 116 fps
100%
GeForce RTX 2080 (Desktop):
270 [X] MSI GeForce RTX 2080 Intel Core i9-9900K 3.6GHz
GeForce RTX 2080 (Desktop)
min:
212 fps
fps
100%
GeForce RTX 2080 (Desktop):
248 [X] MSI GeForce RTX 2080 Intel Core i9-9900K 3.6GHz
GeForce RTX 2080 (Desktop)
min:
189 fps
fps
100%
GeForce RTX 2080 (Desktop):
139 [X] MSI GeForce RTX 2080 Intel Core i9-9900K 3.6GHz
GeForce RTX 2080 (Desktop)
fps
68%
GeForce GTX 1650 Max-Q:
86 103.1 ~ 95 fps
74%
GeForce GTX 1650 Ti Max-Q:
102.8 fps
100%
GeForce RTX 2080 (Desktop):
124 [X] MSI GeForce RTX 2080 Intel Core i9-9900K 3.6GHz
GeForce RTX 2080 (Desktop)
fps
42%
GeForce GTX 1650 Max-Q:
50.5 53.6 ~ 52 fps
42%
GeForce GTX 1650 Ti Max-Q:
52.6 fps
100%
GeForce RTX 2080 (Desktop):
107 [X] MSI GeForce RTX 2080 Intel Core i9-9900K 3.6GHz
GeForce RTX 2080 (Desktop)
fps
32%
GeForce GTX 1650 Max-Q:
33.2 34.9 ~ 34 fps
32%
GeForce GTX 1650 Ti Max-Q:
34.7 fps
100%
GeForce RTX 2080 (Desktop):
89.8 [X] MSI GeForce RTX 2080 Intel Core i9-9900K 3.6GHz
GeForce RTX 2080 (Desktop)
fps
29%
GeForce GTX 1650 Max-Q:
25.1 26 ~ 26 fps
29%
GeForce GTX 1650 Ti Max-Q:
26.1 fps
100%
GeForce RTX 2080 (Desktop):
65.4 [X] MSI GeForce RTX 2080 Intel Core i9-9900K 3.6GHz
GeForce RTX 2080 (Desktop)
fps
100%
GeForce RTX 2080 (Desktop):
35.4 [X] MSI GeForce RTX 2080 Intel Core i9-9900K 3.6GHz
GeForce RTX 2080 (Desktop)
fps
100%
GeForce RTX 2080 (Desktop):
240 [X] MSI GeForce RTX 2080 Intel Core i9-9900K 3.6GHz
GeForce RTX 2080 (Desktop)
min:
226 fps
fps
46%
GeForce GTX 1650 Max-Q:
102.8 120 ~ 111 fps
44%
GeForce GTX 1650 Ti Max-Q:
104.7 fps
100%
GeForce RTX 2080 (Desktop):
137 [X] MSI GeForce RTX 2080 Intel Core i9-9900K 3.6GHz
GeForce RTX 2080 (Desktop)
min:
121 fps
fps
28%
GeForce GTX 1650 Max-Q:
36.1 39.9 ~ 38 fps
29%
GeForce GTX 1650 Ti Max-Q:
39.2 fps
100%
GeForce RTX 2080 (Desktop):
106 [X] MSI GeForce RTX 2080 Intel Core i9-9900K 3.6GHz
GeForce RTX 2080 (Desktop)
min:
94 fps
fps
26%
GeForce GTX 1650 Max-Q:
26.3 29.1 ~ 28 fps
27%
GeForce GTX 1650 Ti Max-Q:
29.1 fps
100%
GeForce RTX 2080 (Desktop):
70.2 [X] MSI GeForce RTX 2080 Intel Core i9-9900K 3.6GHz
GeForce RTX 2080 (Desktop)
min:
61 fps
fps
100%
GeForce RTX 2080 (Desktop):
34.8 [X] MSI GeForce RTX 2080 Intel Core i9-9900K 3.6GHz
GeForce RTX 2080 (Desktop)
min:
29 fps
fps
100%
GeForce RTX 2080 (Desktop):
243 [X] MSI GeForce RTX 2080 Intel Core i9-9900K 3.6GHz
GeForce RTX 2080 (Desktop)
min:
188 fps
fps
52%
GeForce GTX 1650 Max-Q:
127 fps
70%
GeForce GTX 1650 Ti Max-Q:
171 fps
100%
GeForce RTX 2080 (Desktop):
213 [X] MSI GeForce RTX 2080 Intel Core i9-9900K 3.6GHz
GeForce RTX 2080 (Desktop)
min:
169 fps
fps
39%
GeForce GTX 1650 Max-Q:
83 84 ~ 84 fps
42%
GeForce GTX 1650 Ti Max-Q:
89 fps
100%
GeForce RTX 2080 (Desktop):
167 [X] MSI GeForce RTX 2080 Intel Core i9-9900K 3.6GHz
GeForce RTX 2080 (Desktop)
min:
140 fps
fps
40%
GeForce GTX 1650 Max-Q:
65 69 ~ 67 fps
43%
GeForce GTX 1650 Ti Max-Q:
71 fps
100%
GeForce RTX 2080 (Desktop):
152 [X] MSI GeForce RTX 2080 Intel Core i9-9900K 3.6GHz
GeForce RTX 2080 (Desktop)
min:
128 fps
fps
29%
GeForce GTX 1650 Max-Q:
41 46 ~ 44 fps
41%
GeForce GTX 1650 Ti Max-Q:
62 fps
100%
GeForce RTX 2080 (Desktop):
130 [X] MSI GeForce RTX 2080 Intel Core i9-9900K 3.6GHz
GeForce RTX 2080 (Desktop)
min:
123 fps
fps
27%
GeForce GTX 1650 Max-Q:
35 fps
100%
GeForce RTX 2080 (Desktop):
87 [X] MSI GeForce RTX 2080 Intel Core i9-9900K 3.6GHz
GeForce RTX 2080 (Desktop)
min:
81 fps
fps
23%
GeForce GTX 1650 Max-Q:
20 fps
GeForce GTX 1650 Max-Q:
150.1 fps
GeForce GTX 1650 Max-Q:
52.4 fps
GeForce GTX 1650 Max-Q:
31.9 fps
GeForce GTX 1650 Max-Q:
23 fps
100%
GeForce RTX 2080 (Desktop):
259 [X] AMD Ryzen 7 2700X 3.7GHz
GeForce RTX 2080 (Desktop)
P1:
88.3 fps
fps
40%
GeForce GTX 1650 Max-Q:
103 fps
100%
GeForce RTX 2080 (Desktop):
149 [X] AMD Ryzen 7 2700X 3.7GHz
GeForce RTX 2080 (Desktop)
P1:
65 fps
fps
30%
GeForce GTX 1650 Max-Q:
43 46.5 ~ 45 fps
100%
GeForce RTX 2080 (Desktop):
130 [X] AMD Ryzen 7 2700X 3.7GHz
GeForce RTX 2080 (Desktop)
P1:
58.7 fps
fps
29%
GeForce GTX 1650 Max-Q:
36.6 39.7 ~ 38 fps
100%
GeForce RTX 2080 (Desktop):
131 [X] AMD Ryzen 7 2700X 3.7GHz
GeForce RTX 2080 (Desktop)
P1:
64.4 fps
fps
28%
GeForce GTX 1650 Max-Q:
35.8 38.9 ~ 37 fps
100%
GeForce RTX 2080 (Desktop):
89 [X] AMD Ryzen 7 2700X 3.7GHz
GeForce RTX 2080 (Desktop)
P1:
47.6 fps
fps
25%
GeForce GTX 1650 Max-Q:
22.4 fps
100%
GeForce RTX 2080 (Desktop):
44.7 [X] AMD Ryzen 7 2700X 3.7GHz
GeForce RTX 2080 (Desktop)
P1:
37.5 fps
fps
17%
GeForce GTX 1650 Max-Q:
7.4 fps
100%
GeForce RTX 2080 (Desktop):
93 [X] AMD Ryzen 7 2700X 3.7GHz
GeForce RTX 2080 (Desktop)
min:
87 fps, max:
105 fps
fps
65%
GeForce GTX 1650 Max-Q:
60.4 fps
96%
GeForce GTX 1650 Ti Max-Q:
89.4 fps
100%
GeForce RTX 2080 (Desktop):
93 [X] AMD Ryzen 7 2700X 3.7GHz
GeForce RTX 2080 (Desktop)
min:
85 fps, max:
104 fps
fps
59%
GeForce GTX 1650 Max-Q:
52.2 56.8 ~ 55 fps
71%
GeForce GTX 1650 Ti Max-Q:
65.8 fps
100%
GeForce RTX 2080 (Desktop):
77 [X] AMD Ryzen 7 2700X 3.7GHz
GeForce RTX 2080 (Desktop)
min:
70 fps, max:
91 fps
fps
45%
GeForce GTX 1650 Max-Q:
34.7 36.2 ~ 35 fps
53%
GeForce GTX 1650 Ti Max-Q:
41.1 fps
100%
GeForce RTX 2080 (Desktop):
43.3 [X] AMD Ryzen 7 2700X 3.7GHz
GeForce RTX 2080 (Desktop)
min:
38 fps, max:
59 fps
fps
44%
GeForce GTX 1650 Max-Q:
18 19.2 ~ 19 fps
50%
GeForce GTX 1650 Ti Max-Q:
21.5 fps
100%
GeForce RTX 2080 (Desktop):
42.8 [X] AMD Ryzen 7 2700X 3.7GHz
GeForce RTX 2080 (Desktop)
min:
37 fps, max:
53 fps
fps
32%
GeForce GTX 1650 Max-Q:
13.8 fps
100%
GeForce RTX 2080 (Desktop):
32.3 [X] AMD Ryzen 7 2700X 3.7GHz
GeForce RTX 2080 (Desktop)
min:
30 fps, max:
35 fps
fps
26%
GeForce GTX 1650 Max-Q:
8.4 fps
100%
GeForce RTX 2080 (Desktop):
177 [X] AMD Ryzen 7 2700X 3.7GHz
GeForce RTX 2080 (Desktop)
fps
46%
GeForce GTX 1650 Max-Q:
82 fps
53%
GeForce GTX 1650 Ti Max-Q:
93 fps
100%
GeForce RTX 2080 (Desktop):
147 [X] AMD Ryzen 7 2700X 3.7GHz
GeForce RTX 2080 (Desktop)
fps
37%
GeForce GTX 1650 Max-Q:
51 56 ~ 54 fps
35%
GeForce GTX 1650 Ti Max-Q:
51 fps
100%
GeForce RTX 2080 (Desktop):
124 [X] AMD Ryzen 7 2700X 3.7GHz
GeForce RTX 2080 (Desktop)
fps
35%
GeForce GTX 1650 Max-Q:
41 45 ~ 43 fps
33%
GeForce GTX 1650 Ti Max-Q:
41 fps
100%
GeForce RTX 2080 (Desktop):
106 [X] AMD Ryzen 7 2700X 3.7GHz
GeForce RTX 2080 (Desktop)
fps
29%
GeForce GTX 1650 Max-Q:
30 32 ~ 31 fps
28%
GeForce GTX 1650 Ti Max-Q:
30 fps
100%
GeForce RTX 2080 (Desktop):
85 [X] AMD Ryzen 7 2700X 3.7GHz
GeForce RTX 2080 (Desktop)
fps
24%
GeForce GTX 1650 Max-Q:
20 fps
100%
GeForce RTX 2080 (Desktop):
50 [X] AMD Ryzen 7 2700X 3.7GHz
GeForce RTX 2080 (Desktop)
fps
18%
GeForce GTX 1650 Max-Q:
9 fps
100%
GeForce RTX 2080 (Desktop):
206 [X] AMD Ryzen 7 2700X 3.7GHz
GeForce RTX 2080 (Desktop)
min:
196 fps, max:
214 fps
fps
75%
GeForce GTX 1650 Max-Q:
154 fps
95%
GeForce GTX 1650 Ti Max-Q:
195.9 fps
100%
GeForce RTX 2080 (Desktop):
159 [X] AMD Ryzen 7 2700X 3.7GHz
GeForce RTX 2080 (Desktop)
min:
138 fps, max:
174 fps
fps
46%
GeForce GTX 1650 Max-Q:
64 81.6 ~ 73 fps
40%
GeForce GTX 1650 Ti Max-Q:
63.1 fps
100%
GeForce RTX 2080 (Desktop):
153 [X] AMD Ryzen 7 2700X 3.7GHz
GeForce RTX 2080 (Desktop)
min:
137 fps, max:
166 fps
fps
39%
GeForce GTX 1650 Max-Q:
51.1 68.8 ~ 60 fps
36%
GeForce GTX 1650 Ti Max-Q:
55.1 fps
100%
GeForce RTX 2080 (Desktop):
109 [X] AMD Ryzen 7 2700X 3.7GHz
GeForce RTX 2080 (Desktop)
min:
101 fps, max:
120 fps
fps
32%
GeForce GTX 1650 Max-Q:
31.7 38.7 ~ 35 fps
35%
GeForce GTX 1650 Ti Max-Q:
38.1 fps
100%
GeForce RTX 2080 (Desktop):
87 [X] AMD Ryzen 7 2700X 3.7GHz
GeForce RTX 2080 (Desktop)
min:
82 fps, max:
95 fps
fps
27%
GeForce GTX 1650 Max-Q:
23.1 fps
100%
GeForce RTX 2080 (Desktop):
56.7 [X] AMD Ryzen 7 2700X 3.7GHz
GeForce RTX 2080 (Desktop)
min:
53 fps, max:
63 fps
fps
100%
GeForce RTX 2080 (Desktop):
113 [X] AMD Ryzen 7 2700X 3.7GHz
GeForce RTX 2080 (Desktop)
min:
90 fps, max:
149 fps
fps
45%
GeForce GTX 1650 Max-Q:
51.3 fps
100%
GeForce RTX 2080 (Desktop):
105 [X] AMD Ryzen 7 2700X 3.7GHz
GeForce RTX 2080 (Desktop)
min:
83 fps, max:
146 fps
fps
45%
GeForce GTX 1650 Max-Q:
44.6 49.4 ~ 47 fps
100%
GeForce RTX 2080 (Desktop):
102 [X] AMD Ryzen 7 2700X 3.7GHz
GeForce RTX 2080 (Desktop)
min:
79 fps, max:
142 fps
fps
41%
GeForce GTX 1650 Max-Q:
40.9 42.6 ~ 42 fps
100%
GeForce RTX 2080 (Desktop):
97 [X] AMD Ryzen 7 2700X 3.7GHz
GeForce RTX 2080 (Desktop)
min:
77 fps, max:
137 fps
fps
34%
GeForce GTX 1650 Max-Q:
30.3 34.9 ~ 33 fps
100%
GeForce RTX 2080 (Desktop):
89 [X] AMD Ryzen 7 2700X 3.7GHz
GeForce RTX 2080 (Desktop)
min:
49 fps, max:
116 fps
fps
25%
GeForce GTX 1650 Max-Q:
22.6 fps
100%
GeForce RTX 2080 (Desktop):
53.4 [X] AMD Ryzen 7 2700X 3.7GHz
GeForce RTX 2080 (Desktop)
min:
37 fps, max:
66 fps
fps
25%
GeForce GTX 1650 Max-Q:
13.1 fps
100%
GeForce RTX 2080 (Desktop):
118 [X] AMD Ryzen 7 2700X 3.7GHz
GeForce RTX 2080 (Desktop)
min:
90 fps, max:
171 fps
fps
47%
GeForce GTX 1650 Max-Q:
39 72 ~ 56 fps
75%
GeForce GTX 1650 Ti Max-Q:
89 fps
100%
GeForce RTX 2080 (Desktop):
105 [X] AMD Ryzen 7 2700X 3.7GHz
GeForce RTX 2080 (Desktop)
min:
83 fps, max:
153 fps
fps
40%
GeForce GTX 1650 Max-Q:
21 52 53 ~ 42 fps
53%
GeForce GTX 1650 Ti Max-Q:
56 fps
100%
GeForce RTX 2080 (Desktop):
102 [X] AMD Ryzen 7 2700X 3.7GHz
GeForce RTX 2080 (Desktop)
min:
80 fps, max:
146 fps
fps
39%
GeForce GTX 1650 Max-Q:
20 49 50 ~ 40 fps
52%
GeForce GTX 1650 Ti Max-Q:
53 fps
100%
GeForce RTX 2080 (Desktop):
92 [X] AMD Ryzen 7 2700X 3.7GHz
GeForce RTX 2080 (Desktop)
min:
65 fps, max:
147 fps
fps
40%
GeForce GTX 1650 Max-Q:
19 46 46 ~ 37 fps
53%
GeForce GTX 1650 Ti Max-Q:
49 fps
100%
GeForce RTX 2080 (Desktop):
89 [X] AMD Ryzen 7 2700X 3.7GHz
GeForce RTX 2080 (Desktop)
min:
65 fps, max:
129 fps
fps
36%
GeForce GTX 1650 Max-Q:
32 fps
100%
GeForce RTX 2080 (Desktop):
62 [X] AMD Ryzen 7 2700X 3.7GHz
GeForce RTX 2080 (Desktop)
min:
52 fps, max:
76 fps
fps
26%
GeForce GTX 1650 Max-Q:
16 fps
100%
GeForce RTX 2080 (Desktop):
242.4 [X] AMD Ryzen 7 2700X 3.7GHz
GeForce RTX 2080 (Desktop)
min:
199 fps, max:
252 fps
fps
30%
GeForce GTX 1650 Max-Q:
73.3 fps
34%
GeForce GTX 1650 Ti Max-Q:
83.1 fps
100%
GeForce RTX 2080 (Desktop):
108.8 [X] AMD Ryzen 7 2700X 3.7GHz
GeForce RTX 2080 (Desktop)
min:
56 fps, max:
172 fps
fps
33%
GeForce GTX 1650 Max-Q:
35.4 36.9 ~ 36 fps
37%
GeForce GTX 1650 Ti Max-Q:
40.1 fps
100%
GeForce RTX 2080 (Desktop):
87.9 [X] AMD Ryzen 7 2700X 3.7GHz
GeForce RTX 2080 (Desktop)
min:
43 fps, max:
143 fps
fps
31%
GeForce GTX 1650 Max-Q:
26.4 27.5 ~ 27 fps
34%
GeForce GTX 1650 Ti Max-Q:
29.8 fps
100%
GeForce RTX 2080 (Desktop):
74.2 [X] AMD Ryzen 7 2700X 3.7GHz
GeForce RTX 2080 (Desktop)
min:
38 fps, max:
122 fps
fps
30%
GeForce GTX 1650 Max-Q:
21.6 22.6 ~ 22 fps
31%
GeForce GTX 1650 Ti Max-Q:
23.2 fps
100%
GeForce RTX 2080 (Desktop):
59.6 [X] AMD Ryzen 7 2700X 3.7GHz
GeForce RTX 2080 (Desktop)
min:
34 fps, max:
93 fps
fps
28%
GeForce GTX 1650 Max-Q:
16.4 fps
100%
GeForce RTX 2080 (Desktop):
38.6 [X] AMD Ryzen 7 2700X 3.7GHz
GeForce RTX 2080 (Desktop)
min:
25 fps, max:
58 fps
fps
26%
GeForce GTX 1650 Max-Q:
9.9 fps
100%
GeForce RTX 2080 (Desktop):
143 [X] AMD Ryzen 7 2700X 3.7GHz
GeForce RTX 2080 (Desktop)
min:
120 fps, max:
145 fps
fps
101%
GeForce GTX 1650 Max-Q:
143.9 144 ~ 144 fps
100%
GeForce GTX 1650 Ti Max-Q:
143.7 fps
100%
GeForce RTX 2080 (Desktop):
144 [X] AMD Ryzen 7 2700X 3.7GHz
GeForce RTX 2080 (Desktop)
min:
142 fps, max:
145 fps
fps
60%
GeForce GTX 1650 Ti Max-Q:
86.2 fps
100%
GeForce RTX 2080 (Desktop):
144 [X] AMD Ryzen 7 2700X 3.7GHz
GeForce RTX 2080 (Desktop)
min:
141 fps, max:
146 fps
fps
48%
GeForce GTX 1650 Ti Max-Q:
68.7 fps
100%
GeForce RTX 2080 (Desktop):
144 [X] AMD Ryzen 7 2700X 3.7GHz
GeForce RTX 2080 (Desktop)
min:
142 fps, max:
145 fps
fps
44%
GeForce GTX 1650 Ti Max-Q:
62.9 fps
100%
GeForce RTX 2080 (Desktop):
138 [X] AMD Ryzen 7 2700X 3.7GHz
GeForce RTX 2080 (Desktop)
min:
109 fps, max:
145 fps
fps
29%
GeForce GTX 1650 Max-Q:
39.7 fps
100%
GeForce RTX 2080 (Desktop):
82 [X] AMD Ryzen 7 2700X 3.7GHz
GeForce RTX 2080 (Desktop)
min:
60 fps, max:
87 fps
fps
27%
GeForce GTX 1650 Max-Q:
21.9 fps
100%
GeForce RTX 2080 (Desktop):
200 [X] AMD Ryzen 7 2700X 3.7GHz
GeForce RTX 2080 (Desktop)
min:
189 fps, max:
219 fps
fps
100%
GeForce RTX 2080 (Desktop):
165 [X] AMD Ryzen 7 2700X 3.7GHz
GeForce RTX 2080 (Desktop)
min:
153 fps, max:
174 fps
fps
36%
GeForce GTX 1650 Max-Q:
59 fps
100%
GeForce RTX 2080 (Desktop):
129 [X] AMD Ryzen 7 2700X 3.7GHz
GeForce RTX 2080 (Desktop)
min:
121 fps, max:
137 fps
fps
33%
GeForce GTX 1650 Max-Q:
42.6 fps
100%
GeForce RTX 2080 (Desktop):
123 [X] AMD Ryzen 7 2700X 3.7GHz
GeForce RTX 2080 (Desktop)
min:
115 fps, max:
131 fps
fps
32%
GeForce GTX 1650 Max-Q:
39.7 fps
100%
GeForce RTX 2080 (Desktop):
88 [X] AMD Ryzen 7 2700X 3.7GHz
GeForce RTX 2080 (Desktop)
min:
81 fps, max:
92 fps
fps
30%
GeForce GTX 1650 Max-Q:
26.2 fps
100%
GeForce RTX 2080 (Desktop):
50 [X] AMD Ryzen 7 2700X 3.7GHz
GeForce RTX 2080 (Desktop)
min:
47 fps, max:
53 fps
fps
26%
GeForce GTX 1650 Max-Q:
13.2 fps
100%
GeForce RTX 2080 (Desktop):
217 [X] AMD Ryzen 7 2700X 3.7GHz
GeForce RTX 2080 (Desktop)
min:
91 fps, max:
294 fps
fps
100%
GeForce RTX 2080 (Desktop):
146 [X] AMD Ryzen 7 2700X 3.7GHz
GeForce RTX 2080 (Desktop)
min:
80 fps, max:
179 fps
fps
46%
GeForce GTX 1650 Max-Q:
67.4 fps
100%
GeForce RTX 2080 (Desktop):
139 [X] AMD Ryzen 7 2700X 3.7GHz
GeForce RTX 2080 (Desktop)
min:
74 fps, max:
175 fps
fps
38%
GeForce GTX 1650 Max-Q:
53.4 fps
100%
GeForce RTX 2080 (Desktop):
129 [X] AMD Ryzen 7 2700X 3.7GHz
GeForce RTX 2080 (Desktop)
min:
66 fps, max:
164 fps
fps
37%
GeForce GTX 1650 Max-Q:
47.1 fps
100%
GeForce RTX 2080 (Desktop):
110 [X] AMD Ryzen 7 2700X 3.7GHz
GeForce RTX 2080 (Desktop)
min:
73 fps, max:
126 fps
fps
27%
GeForce GTX 1650 Max-Q:
29.3 fps
100%
GeForce RTX 2080 (Desktop):
57.6 [X] AMD Ryzen 7 2700X 3.7GHz
GeForce RTX 2080 (Desktop)
min:
47 fps, max:
65 fps
fps
17%
GeForce GTX 1650 Max-Q:
9.7 fps
100%
GeForce RTX 2080 (Desktop):
190 [X] AMD Ryzen 7 2700X 3.7GHz
GeForce RTX 2080 (Desktop)
min:
163 fps, max:
201 fps
fps
100%
GeForce RTX 2080 (Desktop):
163 [X] AMD Ryzen 7 2700X 3.7GHz
GeForce RTX 2080 (Desktop)
min:
136 fps, max:
193 fps
fps
39%
GeForce GTX 1650 Max-Q:
63.6 fps
100%
GeForce RTX 2080 (Desktop):
155 [X] AMD Ryzen 7 2700X 3.7GHz
GeForce RTX 2080 (Desktop)
min:
101 fps, max:
196 fps
fps
35%
GeForce GTX 1650 Max-Q:
54.1 fps
100%
GeForce RTX 2080 (Desktop):
145 [X] AMD Ryzen 7 2700X 3.7GHz
GeForce RTX 2080 (Desktop)
min:
79 fps, max:
185 fps
fps
34%
GeForce GTX 1650 Max-Q:
49.3 fps
100%
GeForce RTX 2080 (Desktop):
125 [X] AMD Ryzen 7 2700X 3.7GHz
GeForce RTX 2080 (Desktop)
min:
98 fps, max:
175 fps
fps
29%
GeForce GTX 1650 Max-Q:
36.1 fps
100%
GeForce RTX 2080 (Desktop):
76 [X] AMD Ryzen 7 2700X 3.7GHz
GeForce RTX 2080 (Desktop)
min:
54 fps, max:
115 fps
fps
26%
GeForce GTX 1650 Max-Q:
19.4 fps
100%
GeForce RTX 2080 (Desktop):
192 [X] AMD Ryzen 7 2700X 3.7GHz
GeForce RTX 2080 (Desktop)
min:
169 fps, max:
247 fps
fps
100%
GeForce RTX 2080 (Desktop):
141 [X] AMD Ryzen 7 2700X 3.7GHz
GeForce RTX 2080 (Desktop)
min:
74 fps, max:
149 fps
fps
96%
GeForce GTX 1650 Max-Q:
136 fps
100%
GeForce RTX 2080 (Desktop):
134 [X] AMD Ryzen 7 2700X 3.7GHz
GeForce RTX 2080 (Desktop)
min:
119 fps, max:
178 fps
fps
63%
GeForce GTX 1650 Max-Q:
84 fps
100%
GeForce RTX 2080 (Desktop):
124 [X] AMD Ryzen 7 2700X 3.7GHz
GeForce RTX 2080 (Desktop)
min:
109 fps, max:
167 fps
fps
49%
GeForce GTX 1650 Max-Q:
60.6 fps
100%
GeForce RTX 2080 (Desktop):
123 [X] AMD Ryzen 7 2700X 3.7GHz
GeForce RTX 2080 (Desktop)
min:
109 fps, max:
166 fps
fps
33%
GeForce GTX 1650 Max-Q:
40.7 fps
100%
GeForce RTX 2080 (Desktop):
83 [X] AMD Ryzen 7 2700X 3.7GHz
GeForce RTX 2080 (Desktop)
min:
63 fps, max:
149 fps
fps
100%
GeForce RTX 2080 (Desktop):
60 [X] AMD Ryzen 7 2700X 3.7GHz
GeForce RTX 2080 (Desktop)
fps
100%
GeForce RTX 2080 (Desktop):
60 [X] AMD Ryzen 7 2700X 3.7GHz
GeForce RTX 2080 (Desktop)
fps
100%
GeForce RTX 2080 (Desktop):
60 [X] AMD Ryzen 7 2700X 3.7GHz
GeForce RTX 2080 (Desktop)
fps
100%
GeForce RTX 2080 (Desktop):
60 [X] AMD Ryzen 7 2700X 3.7GHz
GeForce RTX 2080 (Desktop)
fps
100%
GeForce RTX 2080 (Desktop):
60 [X] AMD Ryzen 7 2700X 3.7GHz
GeForce RTX 2080 (Desktop)
fps
100%
GeForce RTX 2080 (Desktop):
60 [X] AMD Ryzen 7 2700X 3.7GHz
GeForce RTX 2080 (Desktop)
fps
100%
GeForce RTX 2080 (Desktop):
90 [X] AMD Ryzen 7 2700X 3.7GHz
GeForce RTX 2080 (Desktop)
min:
15 fps, max:
125 fps
fps
100%
GeForce RTX 2080 (Desktop):
90 [X] AMD Ryzen 7 2700X 3.7GHz
GeForce RTX 2080 (Desktop)
min:
71 fps, max:
121 fps
fps
59%
GeForce GTX 1650 Max-Q:
53.1 fps
100%
GeForce RTX 2080 (Desktop):
84 [X] AMD Ryzen 7 2700X 3.7GHz
GeForce RTX 2080 (Desktop)
min:
64 fps, max:
117 fps
fps
57%
GeForce GTX 1650 Max-Q:
47.6 fps
100%
GeForce RTX 2080 (Desktop):
79 [X] AMD Ryzen 7 2700X 3.7GHz
GeForce RTX 2080 (Desktop)
min:
60 fps, max:
114 fps
fps
56%
GeForce GTX 1650 Max-Q:
44.4 fps
100%
GeForce RTX 2080 (Desktop):
80 [X] AMD Ryzen 7 2700X 3.7GHz
GeForce RTX 2080 (Desktop)
min:
60 fps, max:
111 fps
fps
36%
GeForce GTX 1650 Max-Q:
28.6 fps
100%
GeForce RTX 2080 (Desktop):
60 [X] AMD Ryzen 7 2700X 3.7GHz
GeForce RTX 2080 (Desktop)
min:
46 fps, max:
71 fps
fps
24%
GeForce GTX 1650 Max-Q:
14.1 fps
100%
GeForce RTX 2080 (Desktop):
225 [X] AMD Ryzen 7 2700X 3.7GHz
GeForce RTX 2080 (Desktop)
min:
202 fps, max:
253 fps
250 [X] AMD Ryzen 7 2700X 3.7GHz
GeForce RTX 2080 (Desktop)
min:
216 fps, max:
293 fps
~ 238 fps
100%
GeForce RTX 2080 (Desktop):
190 [X] AMD Ryzen 7 2700X 3.7GHz
GeForce RTX 2080 (Desktop)
min:
144 fps, max:
218 fps
198 [X] AMD Ryzen 7 2700X 3.7GHz
GeForce RTX 2080 (Desktop)
min:
152 fps, max:
235 fps
~ 194 fps
32%
GeForce GTX 1650 Max-Q:
62.7 fps
100%
GeForce RTX 2080 (Desktop):
182 [X] AMD Ryzen 7 2700X 3.7GHz
GeForce RTX 2080 (Desktop)
min:
141 fps, max:
214 fps
193 [X] AMD Ryzen 7 2700X 3.7GHz
GeForce RTX 2080 (Desktop)
min:
151 fps, max:
226 fps
~ 188 fps
31%
GeForce GTX 1650 Max-Q:
58.5 fps
100%
GeForce RTX 2080 (Desktop):
175 [X] AMD Ryzen 7 2700X 3.7GHz
GeForce RTX 2080 (Desktop)
min:
130 fps, max:
216 fps
177 [X] AMD Ryzen 7 2700X 3.7GHz
GeForce RTX 2080 (Desktop)
min:
140 fps, max:
204 fps
~ 176 fps
29%
GeForce GTX 1650 Max-Q:
50.9 fps
100%
GeForce RTX 2080 (Desktop):
123 [X] AMD Ryzen 7 2700X 3.7GHz
GeForce RTX 2080 (Desktop)
min:
90 fps, max:
152 fps
fps
27%
GeForce GTX 1650 Max-Q:
32.7 fps
100%
GeForce RTX 2080 (Desktop):
64 [X] AMD Ryzen 7 2700X 3.7GHz
GeForce RTX 2080 (Desktop)
min:
48 fps, max:
79 fps
68 [X] AMD Ryzen 7 2700X 3.7GHz
GeForce RTX 2080 (Desktop)
min:
52 fps, max:
86 fps
~ 66 fps
17%
GeForce GTX 1650 Max-Q:
10.9 fps
100%
GeForce RTX 2080 (Desktop):
111 [X] AMD Ryzen 7 2700X 3.7GHz
GeForce RTX 2080 (Desktop)
113 [X] AMD Ryzen 7 2700X 3.7GHz
GeForce RTX 2080 (Desktop)
min:
23 fps, max:
173 fps
~ 112 fps
56%
GeForce GTX 1650 Ti Max-Q:
63 fps
100%
GeForce RTX 2080 (Desktop):
104 [X] AMD Ryzen 7 2700X 3.7GHz
GeForce RTX 2080 (Desktop)
106 [X] AMD Ryzen 7 2700X 3.7GHz
GeForce RTX 2080 (Desktop)
min:
23 fps, max:
156 fps
~ 105 fps
47%
GeForce GTX 1650 Max-Q:
49 fps
47%
GeForce GTX 1650 Ti Max-Q:
49 fps
100%
GeForce RTX 2080 (Desktop):
91 [X] AMD Ryzen 7 2700X 3.7GHz
GeForce RTX 2080 (Desktop)
min:
19 fps, max:
139 fps
91 [X] AMD Ryzen 7 2700X 3.7GHz
GeForce RTX 2080 (Desktop)
~ 91 fps
45%
GeForce GTX 1650 Max-Q:
41 fps
45%
GeForce GTX 1650 Ti Max-Q:
41 fps
100%
GeForce RTX 2080 (Desktop):
68 [X] AMD Ryzen 7 2700X 3.7GHz
GeForce RTX 2080 (Desktop)
min:
31 fps, max:
121 fps
68 [X] AMD Ryzen 7 2700X 3.7GHz
GeForce RTX 2080 (Desktop)
~ 68 fps
29%
GeForce GTX 1650 Max-Q:
20 fps
28%
GeForce GTX 1650 Ti Max-Q:
19 fps
100%
GeForce RTX 2080 (Desktop):
58 [X] AMD Ryzen 7 2700X 3.7GHz
GeForce RTX 2080 (Desktop)
fps
29%
GeForce GTX 1650 Max-Q:
17 fps
100%
GeForce RTX 2080 (Desktop):
40 [X] AMD Ryzen 7 2700X 3.7GHz
GeForce RTX 2080 (Desktop)
min:
19 fps, max:
86 fps
41 [X] AMD Ryzen 7 2700X 3.7GHz
GeForce RTX 2080 (Desktop)
~ 41 fps
20%
GeForce GTX 1650 Max-Q:
8 fps
100%
GeForce RTX 2080 (Desktop):
170 [X] AMD Ryzen 7 2700X 3.7GHz
GeForce RTX 2080 (Desktop)
179 [X] AMD Ryzen 7 2700X 3.7GHz
GeForce RTX 2080 (Desktop)
~ 175 fps
64%
GeForce GTX 1650 Max-Q:
112 fps
100%
GeForce RTX 2080 (Desktop):
153 [X] AMD Ryzen 7 2700X 3.7GHz
GeForce RTX 2080 (Desktop)
159 [X] AMD Ryzen 7 2700X 3.7GHz
GeForce RTX 2080 (Desktop)
~ 156 fps
47%
GeForce GTX 1650 Max-Q:
74 fps
100%
GeForce RTX 2080 (Desktop):
148 [X] AMD Ryzen 7 2700X 3.7GHz
GeForce RTX 2080 (Desktop)
157 [X] AMD Ryzen 7 2700X 3.7GHz
GeForce RTX 2080 (Desktop)
~ 153 fps
45%
GeForce GTX 1650 Max-Q:
69 fps
100%
GeForce RTX 2080 (Desktop):
125 [X] AMD Ryzen 7 2700X 3.7GHz
GeForce RTX 2080 (Desktop)
139 [X] AMD Ryzen 7 2700X 3.7GHz
GeForce RTX 2080 (Desktop)
~ 132 fps
42%
GeForce GTX 1650 Max-Q:
55 fps
100%
GeForce RTX 2080 (Desktop):
118 [X] AMD Ryzen 7 2700X 3.7GHz
GeForce RTX 2080 (Desktop)
fps
100%
GeForce RTX 2080 (Desktop):
77 [X] AMD Ryzen 7 2700X 3.7GHz
GeForce RTX 2080 (Desktop)
84 [X] AMD Ryzen 7 2700X 3.7GHz
GeForce RTX 2080 (Desktop)
~ 81 fps
100%
GeForce RTX 2080 (Desktop):
264 [X] AMD Ryzen 7 2700X 3.7GHz
GeForce RTX 2080 (Desktop)
min:
230 fps, max:
281 fps
282.4 [X] AMD Ryzen 7 2700X 3.7GHz
GeForce RTX 2080 (Desktop)
min:
254 fps, max:
295 fps
~ 273 fps
100%
GeForce RTX 2080 (Desktop):
260 [X] AMD Ryzen 7 2700X 3.7GHz
GeForce RTX 2080 (Desktop)
min:
238 fps, max:
272 fps
264.5 [X] AMD Ryzen 7 2700X 3.7GHz
GeForce RTX 2080 (Desktop)
min:
252 fps, max:
277 fps
~ 262 fps
74%
GeForce GTX 1650 Max-Q:
195 fps
100%
GeForce RTX 2080 (Desktop):
239 [X] AMD Ryzen 7 2700X 3.7GHz
GeForce RTX 2080 (Desktop)
min:
214 fps, max:
252 fps
247.9 [X] AMD Ryzen 7 2700X 3.7GHz
GeForce RTX 2080 (Desktop)
min:
237 fps, max:
259 fps
~ 243 fps
74%
GeForce GTX 1650 Max-Q:
179 fps
100%
GeForce RTX 2080 (Desktop):
228 [X] AMD Ryzen 7 2700X 3.7GHz
GeForce RTX 2080 (Desktop)
min:
218 fps, max:
235 fps
232.9 [X] AMD Ryzen 7 2700X 3.7GHz
GeForce RTX 2080 (Desktop)
min:
223 fps, max:
249 fps
~ 230 fps
75%
GeForce GTX 1650 Max-Q:
173 fps
100%
GeForce RTX 2080 (Desktop):
212 [X] AMD Ryzen 7 2700X 3.7GHz
GeForce RTX 2080 (Desktop)
min:
205 fps, max:
237 fps
fps
58%
GeForce GTX 1650 Max-Q:
124 fps
100%
GeForce RTX 2080 (Desktop):
203 [X] AMD Ryzen 7 2700X 3.7GHz
GeForce RTX 2080 (Desktop)
min:
196 fps, max:
219 fps
212.4 [X] AMD Ryzen 7 2700X 3.7GHz
GeForce RTX 2080 (Desktop)
min:
196 fps, max:
218 fps
~ 208 fps
31%
GeForce GTX 1650 Max-Q:
64.8 fps
100%
GeForce RTX 2080 (Desktop):
129 [X] AMD Ryzen 7 2700X 3.7GHz
GeForce RTX 2080 (Desktop)
144 [X] AMD Ryzen 7 2700X 3.7GHz
GeForce RTX 2080 (Desktop)
~ 137 fps
100%
GeForce RTX 2080 (Desktop):
116 [X] AMD Ryzen 7 2700X 3.7GHz
GeForce RTX 2080 (Desktop)
122 [X] AMD Ryzen 7 2700X 3.7GHz
GeForce RTX 2080 (Desktop)
~ 119 fps
100%
GeForce RTX 2080 (Desktop):
115 [X] AMD Ryzen 7 2700X 3.7GHz
GeForce RTX 2080 (Desktop)
119 [X] AMD Ryzen 7 2700X 3.7GHz
GeForce RTX 2080 (Desktop)
~ 117 fps
100%
GeForce RTX 2080 (Desktop):
110 [X] AMD Ryzen 7 2700X 3.7GHz
GeForce RTX 2080 (Desktop)
111 [X] AMD Ryzen 7 2700X 3.7GHz
GeForce RTX 2080 (Desktop)
~ 111 fps
100%
GeForce RTX 2080 (Desktop):
90 [X] AMD Ryzen 7 2700X 3.7GHz
GeForce RTX 2080 (Desktop)
fps
27%
GeForce GTX 1650 Max-Q:
24 fps
100%
GeForce RTX 2080 (Desktop):
45 [X] AMD Ryzen 7 2700X 3.7GHz
GeForce RTX 2080 (Desktop)
48 [X] AMD Ryzen 7 2700X 3.7GHz
GeForce RTX 2080 (Desktop)
~ 47 fps
26%
GeForce GTX 1650 Max-Q:
12 fps
32%
GeForce GTX 1650 Ti Max-Q:
15 15 ~ 15 fps
GeForce GTX 1650 Ti Max-Q:
167 [X] MSI Summit E14 A11SCS 1.47.22.14 D3D12
Intel Core i7-1185G7 3GHz
GeForce GTX 1650 Ti Max-Q
min:
117 fps, P1:
124 fps, max:
279 fps
188 [X] HP Envy 14-eb0010nr 1.47.22.14 D3D12
Intel Core i5-1135G7 2.4GHz
GeForce GTX 1650 Ti Max-Q
min:
61.8 fps, P1:
146 fps, max:
283 fps
196 ~ 184 fps
GeForce GTX 1650 Ti Max-Q:
68.6 [X] MSI Summit E14 A11SCS 1.47.22.14 D3D12
Intel Core i7-1185G7 3GHz
GeForce GTX 1650 Ti Max-Q
min:
51.8 fps, P1:
56.2 fps, max:
105 fps
76.5 [X] HP Envy 14-eb0010nr 1.47.22.14 D3D12
Intel Core i5-1135G7 2.4GHz
GeForce GTX 1650 Ti Max-Q
min:
46.5 fps, P1:
66.4 fps, max:
168 fps
81.5 ~ 76 fps
GeForce GTX 1650 Ti Max-Q:
54.9 [X] MSI Summit E14 A11SCS 1.47.22.14 D3D12
Intel Core i7-1185G7 3GHz
GeForce GTX 1650 Ti Max-Q
min:
40.1 fps, P1:
41.6 fps, max:
82.2 fps
62.2 [X] HP Envy 14-eb0010nr 1.47.22.14 D3D12
Intel Core i5-1135G7 2.4GHz
GeForce GTX 1650 Ti Max-Q
min:
48.5 fps, P1:
50 fps, max:
86.8 fps
65.6 ~ 61 fps
GeForce GTX 1650 Ti Max-Q:
47.9 [X] MSI Summit E14 A11SCS 1.47.22.14 D3D12
Intel Core i7-1185G7 3GHz
GeForce GTX 1650 Ti Max-Q
min:
35.1 fps, P1:
36.4 fps, max:
68.6 fps
53.6 [X] HP Envy 14-eb0010nr 1.47.22.14 D3D12
Intel Core i5-1135G7 2.4GHz
GeForce GTX 1650 Ti Max-Q
min:
27 fps, P1:
43 fps, max:
125 fps
55.2 ~ 52 fps
GeForce GTX 1650 Ti Max-Q:
35 [X] MSI Summit E14 A11SCS 1.47.22.14 D3D12
Intel Core i7-1185G7 3GHz
GeForce GTX 1650 Ti Max-Q
min:
29.2 fps, P1:
29.8 fps, max:
48 fps
fps
GeForce GTX 1650 Ti Max-Q:
21.4 [X] MSI Summit E14 A11SCS 1.47.22.14 D3D12
Intel Core i7-1185G7 3GHz
GeForce GTX 1650 Ti Max-Q
min:
18.1 fps, P1:
18.5 fps, max:
26.5 fps
fps
100%
GeForce RTX 2080 (Desktop):
242 [X] AMD Ryzen 7 2700X 3.7GHz
GeForce RTX 2080 (Desktop)
min:
170 fps, max:
266 fps
245 [X] AMD Ryzen 7 2700X 3.7GHz
GeForce RTX 2080 (Desktop)
min:
187 fps, max:
271 fps
~ 244 fps
100%
GeForce RTX 2080 (Desktop):
211 [X] AMD Ryzen 7 2700X 3.7GHz
GeForce RTX 2080 (Desktop)
min:
166 fps, max:
241 fps
219 [X] AMD Ryzen 7 2700X 3.7GHz
GeForce RTX 2080 (Desktop)
min:
167 fps, max:
244 fps
~ 215 fps
100%
GeForce RTX 2080 (Desktop):
160 [X] AMD Ryzen 7 2700X 3.7GHz
GeForce RTX 2080 (Desktop)
min:
131 fps, max:
179 fps
164 [X] AMD Ryzen 7 2700X 3.7GHz
GeForce RTX 2080 (Desktop)
min:
134 fps, max:
183 fps
~ 162 fps
100%
GeForce RTX 2080 (Desktop):
141 [X] AMD Ryzen 7 2700X 3.7GHz
GeForce RTX 2080 (Desktop)
min:
117 fps, max:
160 fps
142 [X] AMD Ryzen 7 2700X 3.7GHz
GeForce RTX 2080 (Desktop)
min:
119 fps, max:
162 fps
~ 142 fps
100%
GeForce RTX 2080 (Desktop):
120 [X] AMD Ryzen 7 2700X 3.7GHz
GeForce RTX 2080 (Desktop)
min:
106 fps, max:
132 fps
fps
100%
GeForce RTX 2080 (Desktop):
77 [X] AMD Ryzen 7 2700X 3.7GHz
GeForce RTX 2080 (Desktop)
min:
53 fps, max:
85 fps
78 [X] AMD Ryzen 7 2700X 3.7GHz
GeForce RTX 2080 (Desktop)
min:
69 fps, max:
89 fps
~ 78 fps
100%
GeForce RTX 2080 (Desktop):
144 [X] AMD Ryzen 7 2700X 3.7GHz
GeForce RTX 2080 (Desktop)
min:
116 fps, max:
158 fps
156 [X] AMD Ryzen 7 2700X 3.7GHz
GeForce RTX 2080 (Desktop)
min:
128 fps, max:
172 fps
~ 150 fps
100%
GeForce RTX 2080 (Desktop):
137 [X] AMD Ryzen 7 2700X 3.7GHz
GeForce RTX 2080 (Desktop)
min:
106 fps, max:
152 fps
144.6 [X] AMD Ryzen 7 2700X 3.7GHz
GeForce RTX 2080 (Desktop)
min:
116 fps, max:
162 fps
~ 141 fps
33%
GeForce GTX 1650 Max-Q:
46.3 fps
100%
GeForce RTX 2080 (Desktop):
135 [X] AMD Ryzen 7 2700X 3.7GHz
GeForce RTX 2080 (Desktop)
min:
110 fps, max:
152 fps
143.1 [X] AMD Ryzen 7 2700X 3.7GHz
GeForce RTX 2080 (Desktop)
min:
121 fps, max:
163 fps
~ 139 fps
29%
GeForce GTX 1650 Max-Q:
40.1 fps
100%
GeForce RTX 2080 (Desktop):
115 [X] AMD Ryzen 7 2700X 3.7GHz
GeForce RTX 2080 (Desktop)
min:
90 fps, max:
146 fps
116.5 [X] AMD Ryzen 7 2700X 3.7GHz
GeForce RTX 2080 (Desktop)
min:
89 fps, max:
145 fps
~ 116 fps
27%
GeForce GTX 1650 Max-Q:
31.4 fps
100%
GeForce RTX 2080 (Desktop):
78 [X] AMD Ryzen 7 2700X 3.7GHz
GeForce RTX 2080 (Desktop)
min:
62 fps, max:
97 fps
fps
25%
GeForce GTX 1650 Max-Q:
19.2 fps
100%
GeForce RTX 2080 (Desktop):
38.2 [X] AMD Ryzen 7 2700X 3.7GHz
GeForce RTX 2080 (Desktop)
min:
33 fps, max:
43 fps
38.6 [X] AMD Ryzen 7 2700X 3.7GHz
GeForce RTX 2080 (Desktop)
min:
33 fps, max:
46 fps
~ 38 fps
23%
GeForce GTX 1650 Max-Q:
8.9 fps
100%
GeForce RTX 2080 (Desktop):
60 [X] AMD Ryzen 7 2700X 3.7GHz
GeForce RTX 2080 (Desktop)
60 [X] AMD Ryzen 7 2700X 3.7GHz
GeForce RTX 2080 (Desktop)
~ 60 fps
100%
GeForce RTX 2080 (Desktop):
60 [X] AMD Ryzen 7 2700X 3.7GHz
GeForce RTX 2080 (Desktop)
60 [X] AMD Ryzen 7 2700X 3.7GHz
GeForce RTX 2080 (Desktop)
~ 60 fps
99%
GeForce GTX 1650 Max-Q:
59.3 fps
100%
GeForce RTX 2080 (Desktop):
60 [X] AMD Ryzen 7 2700X 3.7GHz
GeForce RTX 2080 (Desktop)
69 [X] AMD Ryzen 7 2700X 3.7GHz
GeForce RTX 2080 (Desktop)
~ 65 fps
76%
GeForce GTX 1650 Max-Q:
49.1 fps
100%
GeForce RTX 2080 (Desktop):
60 [X] AMD Ryzen 7 2700X 3.7GHz
GeForce RTX 2080 (Desktop)
60 [X] AMD Ryzen 7 2700X 3.7GHz
GeForce RTX 2080 (Desktop)
~ 60 fps
70%
GeForce GTX 1650 Max-Q:
42 fps
100%
GeForce RTX 2080 (Desktop):
60 [X] AMD Ryzen 7 2700X 3.7GHz
GeForce RTX 2080 (Desktop)
fps
44%
GeForce GTX 1650 Max-Q:
26.4 fps
100%
GeForce RTX 2080 (Desktop):
60 [X] AMD Ryzen 7 2700X 3.7GHz
GeForce RTX 2080 (Desktop)
60 [X] AMD Ryzen 7 2700X 3.7GHz
GeForce RTX 2080 (Desktop)
~ 60 fps
22%
GeForce GTX 1650 Max-Q:
13 fps
100%
GeForce RTX 2080 (Desktop):
129 [X] AMD Ryzen 7 2700X 3.7GHz
GeForce RTX 2080 (Desktop)
min:
86 fps, max:
173 fps
133 [X] AMD Ryzen 7 2700X 3.7GHz
GeForce RTX 2080 (Desktop)
min:
94 fps, max:
179 fps
~ 131 fps
53%
GeForce GTX 1650 Max-Q:
47 91 ~ 69 fps
78%
GeForce GTX 1650 Ti Max-Q:
90 102 115 ~ 102 fps
100%
GeForce RTX 2080 (Desktop):
116 [X] AMD Ryzen 7 2700X 3.7GHz
GeForce RTX 2080 (Desktop)
min:
90 fps, max:
157 fps
117 [X] AMD Ryzen 7 2700X 3.7GHz
GeForce RTX 2080 (Desktop)
min:
80 fps, max:
159 fps
~ 117 fps
32%
GeForce GTX 1650 Max-Q:
24 52 ~ 38 fps
47%
GeForce GTX 1650 Ti Max-Q:
46 56 64 ~ 55 fps
100%
GeForce RTX 2080 (Desktop):
111 [X] AMD Ryzen 7 2700X 3.7GHz
GeForce RTX 2080 (Desktop)
min:
88 fps, max:
150 fps
113 [X] AMD Ryzen 7 2700X 3.7GHz
GeForce RTX 2080 (Desktop)
min:
90 fps, max:
154 fps
~ 112 fps
31%
GeForce GTX 1650 Max-Q:
22 48 ~ 35 fps
46%
GeForce GTX 1650 Ti Max-Q:
42 51 60 ~ 51 fps
100%
GeForce RTX 2080 (Desktop):
105 [X] AMD Ryzen 7 2700X 3.7GHz
GeForce RTX 2080 (Desktop)
min:
81 fps, max:
140 fps
107 [X] AMD Ryzen 7 2700X 3.7GHz
GeForce RTX 2080 (Desktop)
min:
82 fps, max:
145 fps
~ 106 fps
31%
GeForce GTX 1650 Max-Q:
21 45 ~ 33 fps
45%
GeForce GTX 1650 Ti Max-Q:
39 47 48 [X] MSI Summit E15 A11SCST High Performance
Intel Core i7-1185G7 3GHz
GeForce GTX 1650 Ti Max-Q
min:
41 fps, max:
56 fps
56 ~ 48 fps
100%
GeForce RTX 2080 (Desktop):
99 [X] AMD Ryzen 7 2700X 3.7GHz
GeForce RTX 2080 (Desktop)
min:
80 fps, max:
122 fps
fps
33%
GeForce GTX 1650 Ti Max-Q:
27 38 ~ 33 fps
100%
GeForce RTX 2080 (Desktop):
58 [X] AMD Ryzen 7 2700X 3.7GHz
GeForce RTX 2080 (Desktop)
min:
52 fps, max:
69 fps
59 [X] AMD Ryzen 7 2700X 3.7GHz
GeForce RTX 2080 (Desktop)
min:
53 fps, max:
71 fps
~ 59 fps
27%
GeForce GTX 1650 Ti Max-Q:
14 17 ~ 16 fps
GeForce GTX 1650 Max-Q:
414.6 fps
GeForce GTX 1650 Max-Q:
160.1 fps
GeForce GTX 1650 Max-Q:
59.4 fps
GeForce GTX 1650 Ti Max-Q:
79 80.2 85.9 86.6 86.8 91.2 92.6 93.9 96.4 97.5 [X] MSI Summit E15 A11SCST High Performance
Intel Core i7-1185G7 3GHz
GeForce GTX 1650 Ti Max-Q
98 [X] MSI Summit E15 A11SCST High Performance, Cooler Boost
Intel Core i7-1185G7 3GHz
GeForce GTX 1650 Ti Max-Q
~ 90 fps
GeForce GTX 1650 Ti Max-Q:
71.5 71.9 72.8 73.5 78.2 79.2 79.4 80.7 83.5 [X] MSI Summit E15 A11SCST High Performance
Intel Core i7-1185G7 3GHz
GeForce GTX 1650 Ti Max-Q
83.9 [X] MSI Summit E15 A11SCST High Performance, Cooler Boost
Intel Core i7-1185G7 3GHz
GeForce GTX 1650 Ti Max-Q
87.5 ~ 78 fps
GeForce GTX 1650 Ti Max-Q:
60.5 62.6 62.7 63.1 66.4 66.7 67.5 69.7 70.6 [X] MSI Summit E15 A11SCST High Performance
Intel Core i7-1185G7 3GHz
GeForce GTX 1650 Ti Max-Q
70.8 [X] MSI Summit E15 A11SCST High Performance, Cooler Boost
Intel Core i7-1185G7 3GHz
GeForce GTX 1650 Ti Max-Q
72.3 ~ 67 fps
100%
GeForce RTX 2080 (Desktop):
139.5 [X] AMD Ryzen 7 2700X 3.7GHz
GeForce RTX 2080 (Desktop)
min:
61 fps, max:
187 fps
141 [X] AMD Ryzen 7 2700X 3.7GHz
GeForce RTX 2080 (Desktop)
min:
61 fps, max:
184 fps
~ 140 fps
100%
GeForce RTX 2080 (Desktop):
125 [X] AMD Ryzen 7 2700X 3.7GHz
GeForce RTX 2080 (Desktop)
min:
62 fps, max:
150 fps
129.6 [X] AMD Ryzen 7 2700X 3.7GHz
GeForce RTX 2080 (Desktop)
min:
61 fps, max:
161 fps
~ 127 fps
38%
GeForce GTX 1650 Max-Q:
48.1 fps
100%
GeForce RTX 2080 (Desktop):
96 [X] AMD Ryzen 7 2700X 3.7GHz
GeForce RTX 2080 (Desktop)
min:
61 fps, max:
129 fps
108 [X] AMD Ryzen 7 2700X 3.7GHz
GeForce RTX 2080 (Desktop)
min:
61 fps, max:
137 fps
~ 102 fps
37%
GeForce GTX 1650 Max-Q:
38 fps
100%
GeForce RTX 2080 (Desktop):
78 [X] AMD Ryzen 7 2700X 3.7GHz
GeForce RTX 2080 (Desktop)
min:
53 fps, max:
100 fps
83.3 [X] AMD Ryzen 7 2700X 3.7GHz
GeForce RTX 2080 (Desktop)
min:
58 fps, max:
103 fps
~ 81 fps
33%
GeForce GTX 1650 Max-Q:
26.4 fps
100%
GeForce RTX 2080 (Desktop):
70 [X] AMD Ryzen 7 2700X 3.7GHz
GeForce RTX 2080 (Desktop)
min:
55 fps, max:
83 fps
fps
26%
GeForce GTX 1650 Max-Q:
18.5 fps
100%
GeForce RTX 2080 (Desktop):
38.5 [X] AMD Ryzen 7 2700X 3.7GHz
GeForce RTX 2080 (Desktop)
min:
32 fps, max:
44 fps
39.1 [X] AMD Ryzen 7 2700X 3.7GHz
GeForce RTX 2080 (Desktop)
min:
32 fps, max:
44 fps
~ 39 fps
24%
GeForce GTX 1650 Max-Q:
9.4 fps
100%
GeForce RTX 2080 (Desktop):
163.1 [X] AMD Ryzen 7 2700X 3.7GHz
GeForce RTX 2080 (Desktop)
163.4 [X] AMD Ryzen 7 2700X 3.7GHz
GeForce RTX 2080 (Desktop)
min:
117 fps, max:
194 fps
~ 163 fps
44%
GeForce GTX 1650 Max-Q:
51.7 91.2 ~ 71 fps
52%
GeForce GTX 1650 Ti Max-Q:
72 90.1 94 ~ 85 fps
100%
GeForce RTX 2080 (Desktop):
125.3 [X] AMD Ryzen 7 2700X 3.7GHz
GeForce RTX 2080 (Desktop)
min:
93 fps, max:
164 fps
125.5 [X] AMD Ryzen 7 2700X 3.7GHz
GeForce RTX 2080 (Desktop)
~ 125 fps
100%
GeForce RTX 2080 (Desktop):
96.1 [X] AMD Ryzen 7 2700X 3.7GHz
GeForce RTX 2080 (Desktop)
96.6 [X] AMD Ryzen 7 2700X 3.7GHz
GeForce RTX 2080 (Desktop)
min:
54 fps, max:
142 fps
~ 96 fps
GeForce GTX 1650 Max-Q:
23.4 fps
GeForce GTX 1650 Ti Max-Q:
19.3 fps
100%
GeForce RTX 2080 (Desktop):
44.2 [X] AMD Ryzen 7 2700X 3.7GHz
GeForce RTX 2080 (Desktop)
44.5 [X] AMD Ryzen 7 2700X 3.7GHz
GeForce RTX 2080 (Desktop)
min:
21 fps, max:
63 fps
~ 44 fps
20%
GeForce GTX 1650 Max-Q:
8.7 9.6 ~ 9 fps
23%
GeForce GTX 1650 Ti Max-Q:
10.1 fps
100%
GeForce RTX 2080 (Desktop):
223 [X] AMD Ryzen 7 2700X 3.7GHz
GeForce RTX 2080 (Desktop)
min:
155 fps, max:
287 fps
259.2 [X] AMD Ryzen 7 2700X 3.7GHz
GeForce RTX 2080 (Desktop)
~ 241 fps
100%
GeForce RTX 2080 (Desktop):
180 [X] AMD Ryzen 7 2700X 3.7GHz
GeForce RTX 2080 (Desktop)
min:
70 fps, max:
226 fps
218.9 [X] AMD Ryzen 7 2700X 3.7GHz
GeForce RTX 2080 (Desktop)
~ 199 fps
69%
GeForce GTX 1650 Max-Q:
138 fps
100%
GeForce RTX 2080 (Desktop):
163 [X] AMD Ryzen 7 2700X 3.7GHz
GeForce RTX 2080 (Desktop)
min:
126 fps, max:
197 fps
182.2 [X] AMD Ryzen 7 2700X 3.7GHz
GeForce RTX 2080 (Desktop)
~ 173 fps
46%
GeForce GTX 1650 Max-Q:
79.9 fps
100%
GeForce RTX 2080 (Desktop):
147 [X] AMD Ryzen 7 2700X 3.7GHz
GeForce RTX 2080 (Desktop)
min:
115 fps, max:
180 fps
165.3 [X] AMD Ryzen 7 2700X 3.7GHz
GeForce RTX 2080 (Desktop)
~ 156 fps
38%
GeForce GTX 1650 Max-Q:
59.1 fps
100%
GeForce RTX 2080 (Desktop):
128 [X] AMD Ryzen 7 2700X 3.7GHz
GeForce RTX 2080 (Desktop)
min:
113 fps, max:
139 fps
fps
28%
GeForce GTX 1650 Max-Q:
36.2 fps
100%
GeForce RTX 2080 (Desktop):
63.6 [X] AMD Ryzen 7 2700X 3.7GHz
GeForce RTX 2080 (Desktop)
66 [X] AMD Ryzen 7 2700X 3.7GHz
GeForce RTX 2080 (Desktop)
min:
58 fps, max:
71 fps
~ 65 fps
17%
GeForce GTX 1650 Max-Q:
10.9 fps
GeForce GTX 1650 Max-Q:
72.2 fps
GeForce GTX 1650 Max-Q:
62.3 fps
GeForce GTX 1650 Max-Q:
46.5 fps
GeForce GTX 1650 Max-Q:
29.4 fps
GeForce GTX 1650 Max-Q:
5.6 fps
GeForce GTX 1650 Max-Q:
72.3 fps
GeForce GTX 1650 Max-Q:
61.8 fps
GeForce GTX 1650 Max-Q:
58.9 fps
GeForce GTX 1650 Max-Q:
38.6 fps
GeForce GTX 1650 Max-Q:
19.1 fps
100%
GeForce RTX 2080 (Desktop):
249 [X] AMD Ryzen 7 2700X 3.7GHz
GeForce RTX 2080 (Desktop)
min:
160 fps, max:
361 fps
250 [X] AMD Ryzen 7 2700X 3.7GHz
GeForce RTX 2080 (Desktop)
min:
165 fps, max:
344 fps
~ 250 fps
100%
GeForce RTX 2080 (Desktop):
245.8 [X] AMD Ryzen 7 2700X 3.7GHz
GeForce RTX 2080 (Desktop)
min:
162 fps, max:
359 fps
246 [X] AMD Ryzen 7 2700X 3.7GHz
GeForce RTX 2080 (Desktop)
min:
162 fps, max:
349 fps
~ 246 fps
100%
GeForce RTX 2080 (Desktop):
187 [X] AMD Ryzen 7 2700X 3.7GHz
GeForce RTX 2080 (Desktop)
min:
128 fps, max:
257 fps
198.7 [X] AMD Ryzen 7 2700X 3.7GHz
GeForce RTX 2080 (Desktop)
min:
132 fps, max:
273 fps
~ 193 fps
100%
GeForce RTX 2080 (Desktop):
167 [X] AMD Ryzen 7 2700X 3.7GHz
GeForce RTX 2080 (Desktop)
min:
119 fps, max:
211 fps
169 [X] AMD Ryzen 7 2700X 3.7GHz
GeForce RTX 2080 (Desktop)
min:
119 fps, max:
220 fps
~ 168 fps
100%
GeForce RTX 2080 (Desktop):
142 [X] AMD Ryzen 7 2700X 3.7GHz
GeForce RTX 2080 (Desktop)
min:
115 fps, max:
168 fps
fps
100%
GeForce RTX 2080 (Desktop):
89 [X] AMD Ryzen 7 2700X 3.7GHz
GeForce RTX 2080 (Desktop)
min:
62 fps, max:
104 fps
97.4 [X] AMD Ryzen 7 2700X 3.7GHz
GeForce RTX 2080 (Desktop)
min:
80 fps, max:
117 fps
~ 93 fps
100%
GeForce RTX 2080 (Desktop):
114 [X] AMD Ryzen 7 2700X 3.7GHz
GeForce RTX 2080 (Desktop)
116 [X] AMD Ryzen 7 2700X 3.7GHz
GeForce RTX 2080 (Desktop)
~ 115 fps
100%
GeForce RTX 2080 (Desktop):
104 [X] AMD Ryzen 7 2700X 3.7GHz
GeForce RTX 2080 (Desktop)
104 [X] AMD Ryzen 7 2700X 3.7GHz
GeForce RTX 2080 (Desktop)
~ 104 fps
100%
GeForce RTX 2080 (Desktop):
101 [X] AMD Ryzen 7 2700X 3.7GHz
GeForce RTX 2080 (Desktop)
103 [X] AMD Ryzen 7 2700X 3.7GHz
GeForce RTX 2080 (Desktop)
~ 102 fps
100%
GeForce RTX 2080 (Desktop):
86 [X] AMD Ryzen 7 2700X 3.7GHz
GeForce RTX 2080 (Desktop)
87 [X] AMD Ryzen 7 2700X 3.7GHz
GeForce RTX 2080 (Desktop)
~ 87 fps
100%
GeForce RTX 2080 (Desktop):
79 [X] AMD Ryzen 7 2700X 3.7GHz
GeForce RTX 2080 (Desktop)
fps
100%
GeForce RTX 2080 (Desktop):
51 [X] AMD Ryzen 7 2700X 3.7GHz
GeForce RTX 2080 (Desktop)
52 [X] AMD Ryzen 7 2700X 3.7GHz
GeForce RTX 2080 (Desktop)
~ 52 fps
100%
GeForce RTX 2080 (Desktop):
146.8 [X] AMD Ryzen 7 2700X 3.7GHz
GeForce RTX 2080 (Desktop)
169.3 [X] AMD Ryzen 7 2700X 3.7GHz
GeForce RTX 2080 (Desktop)
~ 158 fps
100%
GeForce RTX 2080 (Desktop):
146.4 [X] AMD Ryzen 7 2700X 3.7GHz
GeForce RTX 2080 (Desktop)
165.4 [X] AMD Ryzen 7 2700X 3.7GHz
GeForce RTX 2080 (Desktop)
~ 156 fps
100%
GeForce RTX 2080 (Desktop):
146.3 [X] AMD Ryzen 7 2700X 3.7GHz
GeForce RTX 2080 (Desktop)
164.7 [X] AMD Ryzen 7 2700X 3.7GHz
GeForce RTX 2080 (Desktop)
~ 156 fps
100%
GeForce RTX 2080 (Desktop):
146.1 [X] AMD Ryzen 7 2700X 3.7GHz
GeForce RTX 2080 (Desktop)
169.2 [X] AMD Ryzen 7 2700X 3.7GHz
GeForce RTX 2080 (Desktop)
~ 158 fps
100%
GeForce RTX 2080 (Desktop):
130.5 [X] AMD Ryzen 7 2700X 3.7GHz
GeForce RTX 2080 (Desktop)
fps
100%
GeForce RTX 2080 (Desktop):
71.5 [X] AMD Ryzen 7 2700X 3.7GHz
GeForce RTX 2080 (Desktop)
72.4 [X] AMD Ryzen 7 2700X 3.7GHz
GeForce RTX 2080 (Desktop)
~ 72 fps
GeForce GTX 1650 Max-Q:
61.1 fps
GeForce GTX 1650 Max-Q:
48.6 fps
GeForce GTX 1650 Max-Q:
37.3 fps
GeForce GTX 1650 Max-Q:
24.5 fps
GeForce GTX 1650 Max-Q:
12.2 fps
GeForce GTX 1650 Max-Q:
64 fps
GeForce GTX 1650 Max-Q:
47 fps
GeForce GTX 1650 Max-Q:
35 fps
GeForce GTX 1650 Max-Q:
14 fps
100%
GeForce RTX 2080 (Desktop):
204.7 [X] AMD Ryzen 7 2700X 3.7GHz
GeForce RTX 2080 (Desktop)
min:
137 fps, max:
245 fps
278 [X] AMD Ryzen 7 2700X 3.7GHz
GeForce RTX 2080 (Desktop)
min:
245 fps, max:
309 fps
~ 241 fps
100%
GeForce RTX 2080 (Desktop):
195 [X] AMD Ryzen 7 2700X 3.7GHz
GeForce RTX 2080 (Desktop)
min:
164 fps, max:
227 fps
222 [X] AMD Ryzen 7 2700X 3.7GHz
GeForce RTX 2080 (Desktop)
min:
171 fps, max:
293 fps
~ 209 fps
40%
GeForce GTX 1650 Max-Q:
84.6 fps
100%
GeForce RTX 2080 (Desktop):
166 [X] AMD Ryzen 7 2700X 3.7GHz
GeForce RTX 2080 (Desktop)
min:
97 fps, max:
231 fps
210.1 [X] AMD Ryzen 7 2700X 3.7GHz
GeForce RTX 2080 (Desktop)
min:
190 fps, max:
251 fps
~ 188 fps
38%
GeForce GTX 1650 Max-Q:
70.8 fps
100%
GeForce RTX 2080 (Desktop):
157 [X] AMD Ryzen 7 2700X 3.7GHz
GeForce RTX 2080 (Desktop)
min:
106 fps, max:
182 fps
181 [X] AMD Ryzen 7 2700X 3.7GHz
GeForce RTX 2080 (Desktop)
min:
136 fps, max:
226 fps
~ 169 fps
31%
GeForce GTX 1650 Max-Q:
52.6 fps
100%
GeForce RTX 2080 (Desktop):
63.6 [X] AMD Ryzen 7 2700X 3.7GHz
GeForce RTX 2080 (Desktop)
min:
56 fps, max:
70 fps
74 [X] AMD Ryzen 7 2700X 3.7GHz
GeForce RTX 2080 (Desktop)
min:
64 fps, max:
81 fps
~ 69 fps
24%
GeForce GTX 1650 Max-Q:
16.6 fps
100%
GeForce RTX 2080 (Desktop):
312 [X] AMD Ryzen 7 2700X 3.7GHz
GeForce RTX 2080 (Desktop)
min:
301 fps, max:
324 fps
316.8 [X] AMD Ryzen 7 2700X 3.7GHz
GeForce RTX 2080 (Desktop)
min:
305 fps, max:
327 fps
~ 314 fps
100%
GeForce RTX 2080 (Desktop):
249 [X] AMD Ryzen 7 2700X 3.7GHz
GeForce RTX 2080 (Desktop)
min:
236 fps, max:
279 fps
249.3 [X] AMD Ryzen 7 2700X 3.7GHz
GeForce RTX 2080 (Desktop)
min:
230 fps, max:
263 fps
~ 249 fps
100%
GeForce RTX 2080 (Desktop):
215.8 [X] AMD Ryzen 7 2700X 3.7GHz
GeForce RTX 2080 (Desktop)
min:
203 fps, max:
226 fps
216 [X] AMD Ryzen 7 2700X 3.7GHz
GeForce RTX 2080 (Desktop)
min:
204 fps, max:
229 fps
~ 216 fps
100%
GeForce RTX 2080 (Desktop):
159.6 [X] AMD Ryzen 7 2700X 3.7GHz
GeForce RTX 2080 (Desktop)
min:
137 fps, max:
184 fps
161 [X] AMD Ryzen 7 2700X 3.7GHz
GeForce RTX 2080 (Desktop)
min:
143 fps, max:
186 fps
~ 160 fps
100%
GeForce RTX 2080 (Desktop):
99.2 [X] AMD Ryzen 7 2700X 3.7GHz
GeForce RTX 2080 (Desktop)
min:
88 fps, max:
114 fps
100 [X] AMD Ryzen 7 2700X 3.7GHz
GeForce RTX 2080 (Desktop)
min:
89 fps, max:
115 fps
~ 100 fps
100%
GeForce RTX 2080 (Desktop):
247.4 [X] AMD Ryzen 7 2700X 3.7GHz
GeForce RTX 2080 (Desktop)
min:
120 fps, max:
252 fps
247.8 [X] AMD Ryzen 7 2700X 3.7GHz
GeForce RTX 2080 (Desktop)
~ 248 fps
100%
GeForce RTX 2080 (Desktop):
248.1 [X] AMD Ryzen 7 2700X 3.7GHz
GeForce RTX 2080 (Desktop)
248.3 [X] AMD Ryzen 7 2700X 3.7GHz
GeForce RTX 2080 (Desktop)
min:
238 fps, max:
252 fps
~ 248 fps
100%
GeForce RTX 2080 (Desktop):
242.4 [X] AMD Ryzen 7 2700X 3.7GHz
GeForce RTX 2080 (Desktop)
min:
209 fps, max:
252 fps
242.5 [X] AMD Ryzen 7 2700X 3.7GHz
GeForce RTX 2080 (Desktop)
~ 242 fps
100%
GeForce RTX 2080 (Desktop):
146.1 [X] AMD Ryzen 7 2700X 3.7GHz
GeForce RTX 2080 (Desktop)
min:
124 fps, max:
186 fps
146.3 [X] AMD Ryzen 7 2700X 3.7GHz
GeForce RTX 2080 (Desktop)
~ 146 fps
29%
GeForce GTX 1650 Max-Q:
42.7 fps
GeForce GTX 1650 Max-Q:
97.5 fps
GeForce GTX 1650 Max-Q:
77.3 fps
GeForce GTX 1650 Max-Q:
67.1 fps
GeForce GTX 1650 Max-Q:
23.6 fps
100%
GeForce RTX 2080 (Desktop):
144.7 [X] AMD Ryzen 7 2700X 3.7GHz
GeForce RTX 2080 (Desktop)
min:
115 fps, max:
166 fps
161 [X] AMD Ryzen 7 2700X 3.7GHz
GeForce RTX 2080 (Desktop)
min:
137 fps, max:
180 fps
~ 153 fps
100%
GeForce RTX 2080 (Desktop):
128.4 [X] AMD Ryzen 7 2700X 3.7GHz
GeForce RTX 2080 (Desktop)
min:
113 fps, max:
142 fps
130 [X] AMD Ryzen 7 2700X 3.7GHz
GeForce RTX 2080 (Desktop)
min:
118 fps, max:
144 fps
~ 129 fps
38%
GeForce GTX 1650 Max-Q:
48.5 fps
100%
GeForce RTX 2080 (Desktop):
120 [X] AMD Ryzen 7 2700X 3.7GHz
GeForce RTX 2080 (Desktop)
min:
99 fps, max:
137 fps
123 [X] AMD Ryzen 7 2700X 3.7GHz
GeForce RTX 2080 (Desktop)
min:
105 fps, max:
137 fps
~ 122 fps
36%
GeForce GTX 1650 Max-Q:
44.4 fps
100%
GeForce RTX 2080 (Desktop):
73.9 [X] AMD Ryzen 7 2700X 3.7GHz
GeForce RTX 2080 (Desktop)
min:
44 fps, max:
83 fps
74 [X] AMD Ryzen 7 2700X 3.7GHz
GeForce RTX 2080 (Desktop)
min:
62 fps, max:
84 fps
~ 74 fps
29%
GeForce GTX 1650 Max-Q:
21.7 fps
100%
GeForce RTX 2080 (Desktop):
52 [X] AMD Ryzen 7 2700X 3.7GHz
GeForce RTX 2080 (Desktop)
min:
42 fps, max:
59 fps
53.8 [X] AMD Ryzen 7 2700X 3.7GHz
GeForce RTX 2080 (Desktop)
min:
44 fps, max:
61 fps
~ 53 fps
28%
GeForce GTX 1650 Max-Q:
14.6 fps
100%
GeForce RTX 2080 (Desktop):
294.1 [X] AMD Ryzen 7 2700X 3.7GHz
GeForce RTX 2080 (Desktop)
min:
207 fps, max:
414 fps
300.6 [X] AMD Ryzen 7 2700X 3.7GHz
GeForce RTX 2080 (Desktop)
min:
88 fps, max:
395 fps
~ 297 fps
100%
GeForce RTX 2080 (Desktop):
222 [X] AMD Ryzen 7 2700X 3.7GHz
GeForce RTX 2080 (Desktop)
min:
164 fps, max:
287 fps
224.3 [X] AMD Ryzen 7 2700X 3.7GHz
GeForce RTX 2080 (Desktop)
min:
161 fps, max:
279 fps
~ 223 fps
30%
GeForce GTX 1650 Max-Q:
66.8 fps
100%
GeForce RTX 2080 (Desktop):
214.8 [X] AMD Ryzen 7 2700X 3.7GHz
GeForce RTX 2080 (Desktop)
min:
168 fps, max:
284 fps
216.3 [X] AMD Ryzen 7 2700X 3.7GHz
GeForce RTX 2080 (Desktop)
min:
168 fps, max:
269 fps
~ 216 fps
30%
GeForce GTX 1650 Max-Q:
63.8 fps
100%
GeForce RTX 2080 (Desktop):
169.7 [X] AMD Ryzen 7 2700X 3.7GHz
GeForce RTX 2080 (Desktop)
min:
120 fps, max:
227 fps
172.6 [X] AMD Ryzen 7 2700X 3.7GHz
GeForce RTX 2080 (Desktop)
~ 171 fps
29%
GeForce GTX 1650 Max-Q:
49.4 fps
100%
GeForce RTX 2080 (Desktop):
76.8 [X] AMD Ryzen 7 2700X 3.7GHz
GeForce RTX 2080 (Desktop)
min:
56 fps, max:
96 fps
77.6 [X] AMD Ryzen 7 2700X 3.7GHz
GeForce RTX 2080 (Desktop)
min:
47 fps, max:
92 fps
~ 77 fps
25%
GeForce GTX 1650 Max-Q:
19.1 fps
GeForce GTX 1650 Max-Q:
146 fps
GeForce GTX 1650 Max-Q:
78.8 fps
GeForce GTX 1650 Max-Q:
65.2 fps
GeForce GTX 1650 Max-Q:
21.5 fps
100%
GeForce RTX 2080 (Desktop):
141.3 [X] AMD Ryzen 7 2700X 3.7GHz
GeForce RTX 2080 (Desktop)
min:
108 fps, max:
171 fps
141.9 [X] AMD Ryzen 7 2700X 3.7GHz
GeForce RTX 2080 (Desktop)
min:
106 fps, max:
174 fps
~ 142 fps
100%
GeForce RTX 2080 (Desktop):
127.6 [X] AMD Ryzen 7 2700X 3.7GHz
GeForce RTX 2080 (Desktop)
min:
96 fps, max:
160 fps
134.4 [X] AMD Ryzen 7 2700X 3.7GHz
GeForce RTX 2080 (Desktop)
min:
97 fps, max:
162 fps
~ 131 fps
100%
GeForce RTX 2080 (Desktop):
110 [X] AMD Ryzen 7 2700X 3.7GHz
GeForce RTX 2080 (Desktop)
min:
84 fps, max:
133 fps
115 [X] AMD Ryzen 7 2700X 3.7GHz
GeForce RTX 2080 (Desktop)
min:
85 fps, max:
136 fps
~ 113 fps
100%
GeForce RTX 2080 (Desktop):
86.6 [X] AMD Ryzen 7 2700X 3.7GHz
GeForce RTX 2080 (Desktop)
min:
70 fps, max:
99 fps
88.1 [X] AMD Ryzen 7 2700X 3.7GHz
GeForce RTX 2080 (Desktop)
min:
70 fps, max:
103 fps
~ 87 fps
100%
GeForce RTX 2080 (Desktop):
54.8 [X] AMD Ryzen 7 2700X 3.7GHz
GeForce RTX 2080 (Desktop)
min:
49 fps, max:
61 fps
55.6 [X] AMD Ryzen 7 2700X 3.7GHz
GeForce RTX 2080 (Desktop)
min:
51 fps, max:
62 fps
~ 55 fps
GeForce GTX 1650 Max-Q:
53.9 fps
GeForce GTX 1650 Max-Q:
44.8 fps
GeForce GTX 1650 Max-Q:
21.2 fps
100%
GeForce RTX 2080 (Desktop):
193 [X] AMD Ryzen 7 2700X 3.7GHz
GeForce RTX 2080 (Desktop)
min:
160 fps, max:
201 fps
193.3 [X] AMD Ryzen 7 2700X 3.7GHz
GeForce RTX 2080 (Desktop)
min:
169 fps, max:
201 fps
~ 193 fps
100%
GeForce RTX 2080 (Desktop):
175 [X] AMD Ryzen 7 2700X 3.7GHz
GeForce RTX 2080 (Desktop)
min:
164 fps, max:
185 fps
182.5 [X] AMD Ryzen 7 2700X 3.7GHz
GeForce RTX 2080 (Desktop)
min:
170 fps, max:
193 fps
~ 179 fps
100%
GeForce RTX 2080 (Desktop):
159 [X] AMD Ryzen 7 2700X 3.7GHz
GeForce RTX 2080 (Desktop)
min:
134 fps, max:
173 fps
166.6 [X] AMD Ryzen 7 2700X 3.7GHz
GeForce RTX 2080 (Desktop)
min:
154 fps, max:
175 fps
~ 163 fps
100%
GeForce RTX 2080 (Desktop):
147 [X] AMD Ryzen 7 2700X 3.7GHz
GeForce RTX 2080 (Desktop)
min:
126 fps, max:
157 fps
154.1 [X] AMD Ryzen 7 2700X 3.7GHz
GeForce RTX 2080 (Desktop)
min:
137 fps, max:
166 fps
~ 151 fps
100%
GeForce RTX 2080 (Desktop):
88 [X] AMD Ryzen 7 2700X 3.7GHz
GeForce RTX 2080 (Desktop)
min:
79 fps, max:
93 fps
90 [X] AMD Ryzen 7 2700X 3.7GHz
GeForce RTX 2080 (Desktop)
min:
82 fps, max:
93 fps
~ 89 fps
100%
GeForce RTX 2080 (Desktop):
151.6 [X] AMD Ryzen 7 2700X 3.7GHz
GeForce RTX 2080 (Desktop)
min:
72 fps, max:
216 fps
154 [X] AMD Ryzen 7 2700X 3.7GHz
GeForce RTX 2080 (Desktop)
min:
108 fps, max:
219 fps
~ 153 fps
100%
GeForce RTX 2080 (Desktop):
142.8 [X] AMD Ryzen 7 2700X 3.7GHz
GeForce RTX 2080 (Desktop)
min:
101 fps, max:
205 fps
142.9 [X] AMD Ryzen 7 2700X 3.7GHz
GeForce RTX 2080 (Desktop)
min:
101 fps, max:
205 fps
~ 143 fps
100%
GeForce RTX 2080 (Desktop):
124.4 [X] AMD Ryzen 7 2700X 3.7GHz
GeForce RTX 2080 (Desktop)
min:
73 fps, max:
166 fps
125.3 [X] AMD Ryzen 7 2700X 3.7GHz
GeForce RTX 2080 (Desktop)
min:
93 fps, max:
167 fps
~ 125 fps
34%
GeForce GTX 1650 Max-Q:
43 fps
100%
GeForce RTX 2080 (Desktop):
80.5 [X] AMD Ryzen 7 2700X 3.7GHz
GeForce RTX 2080 (Desktop)
min:
62 fps, max:
105 fps
83.1 [X] AMD Ryzen 7 2700X 3.7GHz
GeForce RTX 2080 (Desktop)
min:
64 fps, max:
109 fps
~ 82 fps
28%
GeForce GTX 1650 Max-Q:
22.9 fps
100%
GeForce RTX 2080 (Desktop):
53.6 [X] AMD Ryzen 7 2700X 3.7GHz
GeForce RTX 2080 (Desktop)
min:
45 fps, max:
66 fps
55.1 [X] AMD Ryzen 7 2700X 3.7GHz
GeForce RTX 2080 (Desktop)
min:
47 fps, max:
68 fps
~ 54 fps
26%
GeForce GTX 1650 Max-Q:
14.1 fps
GeForce GTX 1650 Max-Q:
54.7 fps
GeForce GTX 1650 Max-Q:
49.9 fps
GeForce GTX 1650 Max-Q:
17.5 fps
100%
GeForce RTX 2080 (Desktop):
300 [X] AMD Ryzen 7 2700X 3.7GHz
GeForce RTX 2080 (Desktop)
300 [X] AMD Ryzen 7 2700X 3.7GHz
GeForce RTX 2080 (Desktop)
min:
299 fps, max:
301 fps
~ 300 fps
100%
GeForce RTX 2080 (Desktop):
300 [X] AMD Ryzen 7 2700X 3.7GHz
GeForce RTX 2080 (Desktop)
300 [X] AMD Ryzen 7 2700X 3.7GHz
GeForce RTX 2080 (Desktop)
min:
297 fps, max:
302 fps
~ 300 fps
100%
GeForce RTX 2080 (Desktop):
300 [X] AMD Ryzen 7 2700X 3.7GHz
GeForce RTX 2080 (Desktop)
300 [X] AMD Ryzen 7 2700X 3.7GHz
GeForce RTX 2080 (Desktop)
min:
299 fps, max:
301 fps
~ 300 fps
40%
GeForce GTX 1650 Max-Q:
119 fps
100%
GeForce RTX 2080 (Desktop):
158 [X] AMD Ryzen 7 2700X 3.7GHz
GeForce RTX 2080 (Desktop)
min:
135 fps, max:
179 fps
262 [X] AMD Ryzen 7 2700X 3.7GHz
GeForce RTX 2080 (Desktop)
~ 210 fps
33%
GeForce GTX 1650 Max-Q:
69.5 fps
100%
GeForce RTX 2080 (Desktop):
143 [X] AMD Ryzen 7 2700X 3.7GHz
GeForce RTX 2080 (Desktop)
min:
121 fps, max:
163 fps
150 [X] AMD Ryzen 7 2700X 3.7GHz
GeForce RTX 2080 (Desktop)
min:
129 fps, max:
174 fps
~ 147 fps
27%
GeForce GTX 1650 Max-Q:
39.1 fps
100%
GeForce RTX 2080 (Desktop):
157.1 [X] AMD Ryzen 7 2700X 3.7GHz
GeForce RTX 2080 (Desktop)
min:
92 fps, max:
201 fps
172.3 [X] AMD Ryzen 7 2700X 3.7GHz
GeForce RTX 2080 (Desktop)
~ 165 fps
100%
GeForce RTX 2080 (Desktop):
155.5 [X] AMD Ryzen 7 2700X 3.7GHz
GeForce RTX 2080 (Desktop)
min:
111 fps, max:
201 fps
160.1 [X] AMD Ryzen 7 2700X 3.7GHz
GeForce RTX 2080 (Desktop)
~ 158 fps
100%
GeForce RTX 2080 (Desktop):
139.6 [X] AMD Ryzen 7 2700X 3.7GHz
GeForce RTX 2080 (Desktop)
min:
88 fps, max:
195 fps
152.4 [X] AMD Ryzen 7 2700X 3.7GHz
GeForce RTX 2080 (Desktop)
~ 146 fps
55%
GeForce GTX 1650 Max-Q:
79.6 fps
100%
GeForce RTX 2080 (Desktop):
140.3 [X] AMD Ryzen 7 2700X 3.7GHz
GeForce RTX 2080 (Desktop)
min:
101 fps, max:
196 fps
150.3 [X] AMD Ryzen 7 2700X 3.7GHz
GeForce RTX 2080 (Desktop)
~ 145 fps
53%
GeForce GTX 1650 Max-Q:
77.4 fps
100%
GeForce RTX 2080 (Desktop):
115.1 [X] AMD Ryzen 7 2700X 3.7GHz
GeForce RTX 2080 (Desktop)
117.7 [X] AMD Ryzen 7 2700X 3.7GHz
GeForce RTX 2080 (Desktop)
min:
87 fps, max:
151 fps
~ 116 fps
21%
GeForce GTX 1650 Max-Q:
23.9 fps
GeForce GTX 1650 Max-Q:
60.3 fps
GeForce GTX 1650 Max-Q:
42.5 fps
GeForce GTX 1650 Max-Q:
36.9 fps
100%
GeForce RTX 2080 (Desktop):
265.4 [X] AMD Ryzen 7 2700X 3.7GHz
GeForce RTX 2080 (Desktop)
285.4 [X] AMD Ryzen 7 2700X 3.7GHz
GeForce RTX 2080 (Desktop)
~ 275 fps
100%
GeForce RTX 2080 (Desktop):
227.6 [X] AMD Ryzen 7 2700X 3.7GHz
GeForce RTX 2080 (Desktop)
245.2 [X] AMD Ryzen 7 2700X 3.7GHz
GeForce RTX 2080 (Desktop)
~ 236 fps
100%
GeForce RTX 2080 (Desktop):
159.4 [X] AMD Ryzen 7 2700X 3.7GHz
GeForce RTX 2080 (Desktop)
162.3 [X] AMD Ryzen 7 2700X 3.7GHz
GeForce RTX 2080 (Desktop)
~ 161 fps
100%
GeForce RTX 2080 (Desktop):
129.8 [X] AMD Ryzen 7 2700X 3.7GHz
GeForce RTX 2080 (Desktop)
131.1 [X] AMD Ryzen 7 2700X 3.7GHz
GeForce RTX 2080 (Desktop)
~ 130 fps
100%
GeForce RTX 2080 (Desktop):
69.1 [X] AMD Ryzen 7 2700X 3.7GHz
GeForce RTX 2080 (Desktop)
71.7 [X] AMD Ryzen 7 2700X 3.7GHz
GeForce RTX 2080 (Desktop)
~ 70 fps
100%
GeForce RTX 2080 (Desktop):
119 [X] AMD Ryzen 7 2700X 3.7GHz
GeForce RTX 2080 (Desktop)
min:
92 fps, max:
139 fps
127 [X] AMD Ryzen 7 2700X 3.7GHz
GeForce RTX 2080 (Desktop)
min:
100 fps, max:
150 fps
~ 123 fps
100%
GeForce RTX 2080 (Desktop):
108 [X] AMD Ryzen 7 2700X 3.7GHz
GeForce RTX 2080 (Desktop)
min:
82 fps, max:
124 fps
115 [X] AMD Ryzen 7 2700X 3.7GHz
GeForce RTX 2080 (Desktop)
min:
87 fps, max:
134 fps
~ 112 fps
100%
GeForce RTX 2080 (Desktop):
98 [X] AMD Ryzen 7 2700X 3.7GHz
GeForce RTX 2080 (Desktop)
min:
76 fps, max:
117 fps
104 [X] AMD Ryzen 7 2700X 3.7GHz
GeForce RTX 2080 (Desktop)
min:
80 fps, max:
122 fps
~ 101 fps
100%
GeForce RTX 2080 (Desktop):
90 [X] AMD Ryzen 7 2700X 3.7GHz
GeForce RTX 2080 (Desktop)
min:
65 fps, max:
107 fps
97 [X] AMD Ryzen 7 2700X 3.7GHz
GeForce RTX 2080 (Desktop)
min:
69 fps, max:
113 fps
~ 94 fps
100%
GeForce RTX 2080 (Desktop):
68 [X] AMD Ryzen 7 2700X 3.7GHz
GeForce RTX 2080 (Desktop)
min:
63 fps, max:
75 fps
71 [X] AMD Ryzen 7 2700X 3.7GHz
GeForce RTX 2080 (Desktop)
min:
65 fps, max:
78 fps
~ 70 fps
100%
GeForce RTX 2080 (Desktop):
263 [X] AMD Ryzen 7 2700X 3.7GHz
GeForce RTX 2080 (Desktop)
min:
247 fps, max:
277 fps
293.2 [X] AMD Ryzen 7 2700X 3.7GHz
GeForce RTX 2080 (Desktop)
min:
278 fps, max:
308 fps
~ 278 fps
48%
GeForce GTX 1650 Max-Q:
134.6 fps
46%
GeForce GTX 1650 Ti Max-Q:
89.7 163.4 ~ 127 fps
100%
GeForce RTX 2080 (Desktop):
196 [X] AMD Ryzen 7 2700X 3.7GHz
GeForce RTX 2080 (Desktop)
min:
188 fps, max:
204 fps
208.4 [X] AMD Ryzen 7 2700X 3.7GHz
GeForce RTX 2080 (Desktop)
min:
184 fps, max:
219 fps
~ 202 fps
46%
GeForce GTX 1650 Max-Q:
93 fps
48%
GeForce GTX 1650 Ti Max-Q:
84.7 107.4 ~ 96 fps
100%
GeForce RTX 2080 (Desktop):
182 [X] AMD Ryzen 7 2700X 3.7GHz
GeForce RTX 2080 (Desktop)
min:
170 fps, max:
194 fps
184.8 [X] AMD Ryzen 7 2700X 3.7GHz
GeForce RTX 2080 (Desktop)
min:
175 fps, max:
192 fps
~ 183 fps
28%
GeForce GTX 1650 Max-Q:
50.9 fps
32%
GeForce GTX 1650 Ti Max-Q:
58.1 60.5 ~ 59 fps
100%
GeForce RTX 2080 (Desktop):
158.5 [X] AMD Ryzen 7 2700X 3.7GHz
GeForce RTX 2080 (Desktop)
min:
144 fps, max:
173 fps
162 [X] AMD Ryzen 7 2700X 3.7GHz
GeForce RTX 2080 (Desktop)
min:
147 fps, max:
173 fps
~ 160 fps
26%
GeForce GTX 1650 Max-Q:
41.7 fps
31%
GeForce GTX 1650 Ti Max-Q:
48.9 49.1 ~ 49 fps
100%
GeForce RTX 2080 (Desktop):
73.4 [X] AMD Ryzen 7 2700X 3.7GHz
GeForce RTX 2080 (Desktop)
min:
67 fps, max:
80 fps
77 [X] AMD Ryzen 7 2700X 3.7GHz
GeForce RTX 2080 (Desktop)
min:
71 fps, max:
85 fps
~ 75 fps
24%
GeForce GTX 1650 Max-Q:
18.3 fps
28%
GeForce GTX 1650 Ti Max-Q:
19.9 22.9 ~ 21 fps
100%
GeForce RTX 2080 (Desktop):
298.5 [X] AMD Ryzen 7 2700X 3.7GHz
GeForce RTX 2080 (Desktop)
min:
30 fps, max:
478 fps
322.8 [X] AMD Ryzen 7 2700X 3.7GHz
GeForce RTX 2080 (Desktop)
min:
12 fps, max:
494 fps
~ 311 fps
100%
GeForce RTX 2080 (Desktop):
257.8 [X] AMD Ryzen 7 2700X 3.7GHz
GeForce RTX 2080 (Desktop)
min:
54 fps, max:
419 fps
289 [X] AMD Ryzen 7 2700X 3.7GHz
GeForce RTX 2080 (Desktop)
min:
84 fps, max:
483 fps
~ 273 fps
100%
GeForce RTX 2080 (Desktop):
241.9 [X] AMD Ryzen 7 2700X 3.7GHz
GeForce RTX 2080 (Desktop)
min:
59 fps, max:
389 fps
269.5 [X] AMD Ryzen 7 2700X 3.7GHz
GeForce RTX 2080 (Desktop)
min:
54 fps, max:
430 fps
~ 256 fps
45%
GeForce GTX 1650 Max-Q:
115 fps
100%
GeForce RTX 2080 (Desktop):
238 [X] AMD Ryzen 7 2700X 3.7GHz
GeForce RTX 2080 (Desktop)
min:
36 fps, max:
365 fps
260.7 [X] AMD Ryzen 7 2700X 3.7GHz
GeForce RTX 2080 (Desktop)
min:
32 fps, max:
409 fps
~ 249 fps
41%
GeForce GTX 1650 Max-Q:
101 fps
100%
GeForce RTX 2080 (Desktop):
137.3 [X] AMD Ryzen 7 2700X 3.7GHz
GeForce RTX 2080 (Desktop)
min:
63 fps, max:
169 fps
139.8 [X] AMD Ryzen 7 2700X 3.7GHz
GeForce RTX 2080 (Desktop)
min:
80 fps, max:
223 fps
~ 139 fps
29%
GeForce GTX 1650 Max-Q:
40 fps
GeForce GTX 1650 Max-Q:
179 fps
GeForce GTX 1650 Max-Q:
144.1 fps
GeForce GTX 1650 Max-Q:
117.7 fps
GeForce GTX 1650 Max-Q:
104.2 fps
GeForce GTX 1650 Ti Max-Q:
118 128 130 137 140 [X] MSI Summit E15 A11SCST High Performance, Cooler Boost
Intel Core i7-1185G7 3GHz
GeForce GTX 1650 Ti Max-Q
min:
123.5 fps, max:
-1 fps
140 142 143 [X] MSI Summit E15 A11SCST High Performance
Intel Core i7-1185G7 3GHz
GeForce GTX 1650 Ti Max-Q
min:
125.9 fps, max:
-1 fps
143 144 147 ~ 137 fps
GeForce GTX 1650 Ti Max-Q:
112 116 117 118 118 119 121 124 [X] MSI Summit E15 A11SCST High Performance
Intel Core i7-1185G7 3GHz
GeForce GTX 1650 Ti Max-Q
min:
109 fps, max:
-1 fps
124 [X] MSI Summit E15 A11SCST High Performance, Cooler Boost
Intel Core i7-1185G7 3GHz
GeForce GTX 1650 Ti Max-Q
min:
107.8 fps, max:
-1 fps
127 129 ~ 120 fps
GeForce GTX 1650 Ti Max-Q:
107 107 109 111 111 112 113 115 117 [X] MSI Summit E15 A11SCST High Performance
Intel Core i7-1185G7 3GHz
GeForce GTX 1650 Ti Max-Q
min:
100.4 fps, max:
-1 fps
117 [X] MSI Summit E15 A11SCST High Performance, Cooler Boost
Intel Core i7-1185G7 3GHz
GeForce GTX 1650 Ti Max-Q
min:
100.7 fps, max:
-1 fps
121 ~ 113 fps
GeForce GTX 1650 Ti Max-Q:
101 103 104 104 105 106 107 108 [X] MSI Summit E15 A11SCST High Performance
Intel Core i7-1185G7 3GHz
GeForce GTX 1650 Ti Max-Q
min:
89.9 fps, max:
-1 fps
108 [X] MSI Summit E15 A11SCST High Performance, Cooler Boost
Intel Core i7-1185G7 3GHz
GeForce GTX 1650 Ti Max-Q
min:
91.3 fps, max:
-1 fps
109 110 ~ 106 fps
GeForce GTX 1650 Max-Q:
121 fps
GeForce GTX 1650 Max-Q:
75 fps
GeForce GTX 1650 Max-Q:
64 fps
GeForce GTX 1650 Max-Q:
38 fps
100%
GeForce RTX 2080 (Desktop):
301 [X] AMD Ryzen 7 2700X 3.7GHz
GeForce RTX 2080 (Desktop)
min:
256 fps, max:
341 fps
319.5 [X] AMD Ryzen 7 2700X 3.7GHz
GeForce RTX 2080 (Desktop)
min:
212 fps, max:
347 fps
~ 310 fps
100%
GeForce RTX 2080 (Desktop):
263 [X] AMD Ryzen 7 2700X 3.7GHz
GeForce RTX 2080 (Desktop)
min:
219 fps, max:
293 fps
270.2 [X] AMD Ryzen 7 2700X 3.7GHz
GeForce RTX 2080 (Desktop)
min:
187 fps, max:
304 fps
~ 267 fps
100%
GeForce RTX 2080 (Desktop):
179.6 [X] AMD Ryzen 7 2700X 3.7GHz
GeForce RTX 2080 (Desktop)
min:
144 fps, max:
210 fps
182 [X] AMD Ryzen 7 2700X 3.7GHz
GeForce RTX 2080 (Desktop)
min:
156 fps, max:
213 fps
~ 181 fps
100%
GeForce RTX 2080 (Desktop):
103.4 [X] AMD Ryzen 7 2700X 3.7GHz
GeForce RTX 2080 (Desktop)
min:
81 fps, max:
119 fps
109 [X] AMD Ryzen 7 2700X 3.7GHz
GeForce RTX 2080 (Desktop)
min:
94 fps, max:
120 fps
~ 106 fps
100%
GeForce RTX 2080 (Desktop):
73.8 [X] AMD Ryzen 7 2700X 3.7GHz
GeForce RTX 2080 (Desktop)
min:
66 fps, max:
81 fps
78 [X] AMD Ryzen 7 2700X 3.7GHz
GeForce RTX 2080 (Desktop)
min:
69 fps, max:
87 fps
~ 76 fps
24%
GeForce GTX 1650 Max-Q:
17.5 17.6 ~ 18 fps
100%
GeForce RTX 2080 (Desktop):
162 [X] AMD Ryzen 7 2700X 3.7GHz
GeForce RTX 2080 (Desktop)
min:
22.2 fps, P1:
90.9 fps, max:
236 fps
173.7 [X] AMD Ryzen 7 2700X 3.7GHz
GeForce RTX 2080 (Desktop)
~ 168 fps
97%
GeForce GTX 1650 Max-Q:
162.7 fps
98%
GeForce GTX 1650 Ti Max-Q:
156 [X] HP Envy 14-eb0010nr Intel Core i5-1135G7 2.4GHz
GeForce GTX 1650 Ti Max-Q
min:
4.62 fps, P1:
90.9 fps, max:
263 fps
167 171 ~ 165 fps
100%
GeForce RTX 2080 (Desktop):
145 [X] AMD Ryzen 7 2700X 3.7GHz
GeForce RTX 2080 (Desktop)
min:
17.6 fps, P1:
90.9 fps, max:
186 fps
166.1 [X] AMD Ryzen 7 2700X 3.7GHz
GeForce RTX 2080 (Desktop)
~ 156 fps
92%
GeForce GTX 1650 Max-Q:
142.8 fps
99%
GeForce GTX 1650 Ti Max-Q:
145 [X] HP Envy 14-eb0010nr Intel Core i5-1135G7 2.4GHz
GeForce GTX 1650 Ti Max-Q
min:
4.59 fps, P1:
83.3 fps, max:
250 fps
157 164 ~ 155 fps
100%
GeForce RTX 2080 (Desktop):
125 [X] AMD Ryzen 7 2700X 3.7GHz
GeForce RTX 2080 (Desktop)
min:
11.1 fps, P1:
90.9 fps, max:
156 fps
150 [X] AMD Ryzen 7 2700X 3.7GHz
GeForce RTX 2080 (Desktop)
~ 138 fps
55%
GeForce GTX 1650 Max-Q:
76.5 fps
61%
GeForce GTX 1650 Ti Max-Q:
73.2 88.1 [X] HP Envy 14-eb0010nr Intel Core i5-1135G7 2.4GHz
GeForce GTX 1650 Ti Max-Q
min:
15.1 fps, P1:
62.5 fps, max:
150 fps
91.5 ~ 84 fps
100%
GeForce RTX 2080 (Desktop):
116 [X] AMD Ryzen 7 2700X 3.7GHz
GeForce RTX 2080 (Desktop)
min:
6.8 fps, P1:
83.3 fps, max:
147 fps
132.5 [X] AMD Ryzen 7 2700X 3.7GHz
GeForce RTX 2080 (Desktop)
~ 124 fps
29%
GeForce GTX 1650 Max-Q:
36 fps
35%
GeForce GTX 1650 Ti Max-Q:
37.1 45.3 [X] HP Envy 14-eb0010nr Intel Core i5-1135G7 2.4GHz
GeForce GTX 1650 Ti Max-Q
min:
17.6 fps, P1:
29.4 fps, max:
102 fps
45.4 ~ 43 fps
GeForce GTX 1650 Ti Max-Q:
26 fps
100%
GeForce RTX 2080 (Desktop):
89 [X] AMD Ryzen 7 2700X 3.7GHz
GeForce RTX 2080 (Desktop)
min:
9.54 fps, P1:
62.5 fps, max:
139 fps
124 [X] AMD Ryzen 7 2700X 3.7GHz
GeForce RTX 2080 (Desktop)
~ 107 fps
23%
GeForce GTX 1650 Ti Max-Q:
24.8 fps
100%
GeForce RTX 2080 (Desktop):
200 [X] AMD Ryzen 7 2700X 3.7GHz
GeForce RTX 2080 (Desktop)
200 [X] AMD Ryzen 7 2700X 3.7GHz
GeForce RTX 2080 (Desktop)
min:
188 fps, max:
202 fps
~ 200 fps
100%
GeForce RTX 2080 (Desktop):
200 [X] AMD Ryzen 7 2700X 3.7GHz
GeForce RTX 2080 (Desktop)
200 [X] AMD Ryzen 7 2700X 3.7GHz
GeForce RTX 2080 (Desktop)
min:
198 fps, max:
201 fps
~ 200 fps
100%
GeForce RTX 2080 (Desktop):
200 [X] AMD Ryzen 7 2700X 3.7GHz
GeForce RTX 2080 (Desktop)
200 [X] AMD Ryzen 7 2700X 3.7GHz
GeForce RTX 2080 (Desktop)
min:
195 fps, max:
201 fps
~ 200 fps
100%
GeForce RTX 2080 (Desktop):
200 [X] AMD Ryzen 7 2700X 3.7GHz
GeForce RTX 2080 (Desktop)
200 [X] AMD Ryzen 7 2700X 3.7GHz
GeForce RTX 2080 (Desktop)
min:
197 fps, max:
201 fps
~ 200 fps
100%
GeForce RTX 2080 (Desktop):
121 [X] AMD Ryzen 7 2700X 3.7GHz
GeForce RTX 2080 (Desktop)
125.4 [X] AMD Ryzen 7 2700X 3.7GHz
GeForce RTX 2080 (Desktop)
min:
111 fps, max:
151 fps
~ 123 fps
GeForce GTX 1650 Max-Q:
367.2 fps
GeForce GTX 1650 Max-Q:
253.9 fps
GeForce GTX 1650 Max-Q:
191.5 fps
GeForce GTX 1650 Max-Q:
92.7 fps
GeForce GTX 1650 Max-Q:
309.6 fps
GeForce GTX 1650 Max-Q:
294.4 fps
GeForce GTX 1650 Max-Q:
258.6 fps
GeForce GTX 1650 Max-Q:
166.6 fps
Average Gaming NVIDIA GeForce RTX 2080 (Desktop) → 100% Average Gaming 30-70 fps → 100%
Average Gaming NVIDIA GeForce GTX 1650 Max-Q → 39% Average Gaming 30-70 fps → 38%
Average Gaming NVIDIA GeForce GTX 1650 Ti Max-Q → 42% Average Gaming 30-70 fps → 39%
 Deutsch
 English
 Español
 Français
 Italiano
 Nederlands
 Polski
 Português
 Русский
 Türkçe
 Svenska
 Chinese
 Magyar