Notebookcheck Logo

AMD Radeon RX 7700 XT vs NVIDIA GeForce RTX 2080 Super Max-Q vs NVIDIA Titan RTX

AMD Radeon RX 7700 XT

► remove from comparison AMD Radeon RX 7700 XT

Die AMD Radeon RX 7700 XT ist eine Mittelklasse-Desktop-GPU und primär für das Gaming in 1.440p ausgelegt. Damit ist die AMD Radeon RX 7700 XT der kleinste Ableger im Bereich 1.440p-Gaming und reiht sich damit direkt hinter der AMD Radeon RX 7800 XT und der AMD Radeon RX 7900 GRE ein. Der Grafikchip wird im 5 nm Verfahren bei TSMC gefertigt. Das Chiplet-Design kommt auch bei der AMD Radeon RX 7700 XT zum Einsatz, wenngleich hier nur noch drei MCDs aktiv sind. Mit 12-GB-VRAM bekommt die AMD Radeon RX 7700 XT genauso viel wie die AMD Radeon RX 6700 XT, welche der direkte Vorgänger ist. 

Features

RDNA 3 dient weiterhin als Basis für den Navi 32 getauften Grafikchip. Die bereits etablierten Features wie SAM (Smart Access Memory) und der Infinity Cache gibt es auch bei dem neuen Mittelklassemodell aka Radeon RX 7700 XT. Gegenüber der AMD Radeon RX 6700 XT wurden der Raytracing-Part überarbeitet und eine hardwareseitige AI-Unterstützung implementiert. Die Media Engine wurde erneuert und Videos lassen sich mit einer Auflösung von bis zu 8K dekodieren/enkodieren. Den modernen DisplayPort 2.1 Anschluss gibt es auch bei der AMD Radeon RX 7700 XT. AMDs Antwort auf DLSS heißt FSR 2.0 und bietet mit der Upscaling-Option eine deutliche Performance-Steigerung in Spielen. Mit FSR 3 wird es hier in naher Zukunft ein weiteres Feature geben, welches wie DLSS 3.0 durch Frame-Generation noch bessere Frameraten verspricht.

Performance

Die Leistung der AMD Radeon RX 7700 XT positioniert sich in Spielen ohne Raytracing deutlich vor einer Nvidia GeForce RTX 4060 Ti. Die Nvidia GeForce RTX 4070 ist für die AMD Radeon RX 7700 XT jedoch nicht in Reichweite. Im hauseigenen Duell kann die Leistung der AMD Radeon RX 7700 XT mit einer AMD Radeon RX 6800 verglichen werden.

Leistungsaufnahme

Die Leistungsaufnahme der AMD Radeon RX 7700 XT wird vom Hersteller mit 245 Watt (TBP) beziffert und ist damit nur unwesentlich sparsamer als eine AMD Radeon RX 6800 (250 Watt). Im Vergleich zur Nvidia GeForce RTX 4070 benötigt die AMD Radeon RX 7500 XT jedoch 45 Watt mehr.

NVIDIA GeForce RTX 2080 Super Max-Q

► remove from comparison NVIDIA GeForce RTX 2080 Super Max-Q

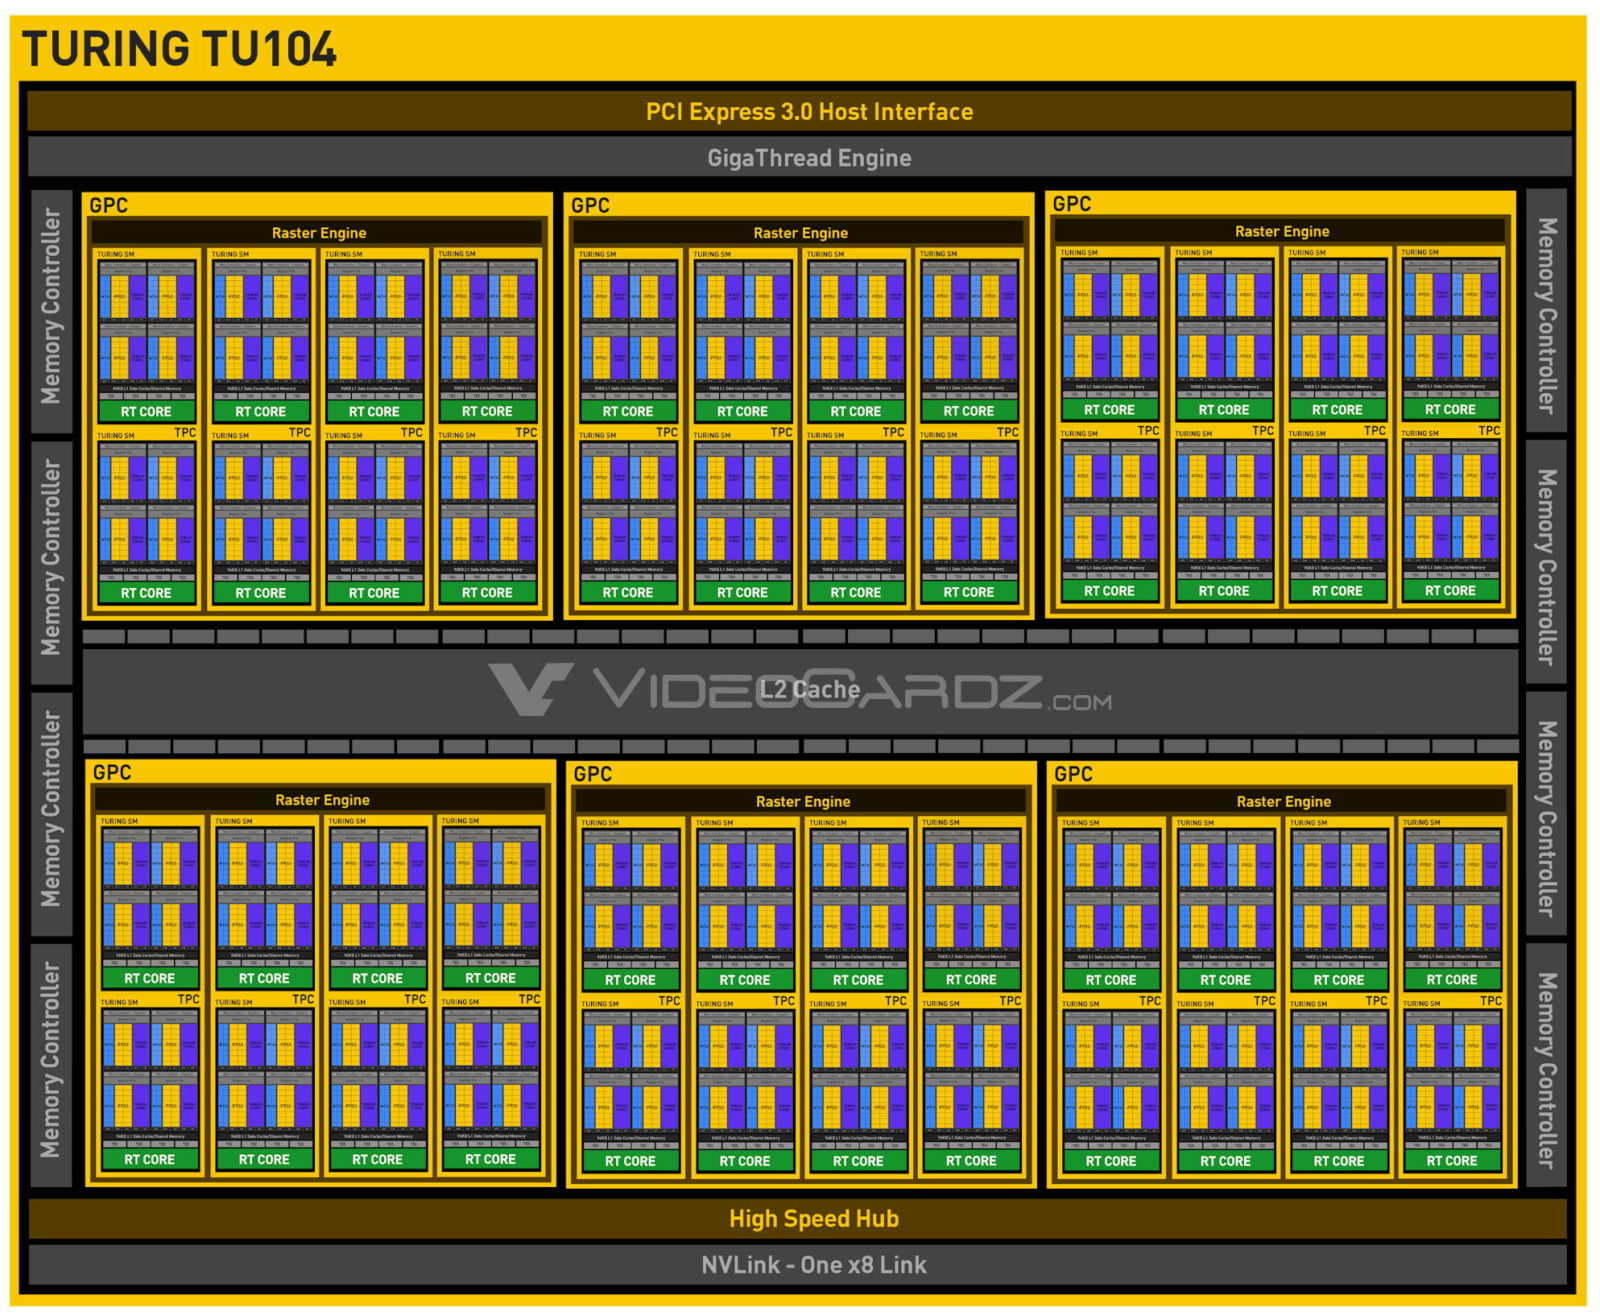
Die Nvidia GeForce RTX 2080 Super Max-Q (für Laptops) ist die Stromsparversion der mobilen GeForce RTX 2080 Super. Sie basiert auf den selben TU104-775-A1 Chip mit 3.072 Shader, jedoch bei deutlich reduzierten Taktraten und Stromverbrauch. Es gibt drei Varianten mit einem TGP (Stromverbrauch des Chips) von 80, 85 und 90 Watt. Die Taktung rangiert von 735 - 975 MHz für den Basistakt und 1.080 - 1.230 MHz im Boost. Die normale 2080 Super Mobile taktet mit 1.365 - 1.560 / 1.560 - 1.740 MHz bis zu 48% höher im Boost, die gleichnamige Desktop-Version ist nochmals schneller getaktet. Die GPU trägt den Codenamen N18E-G3R-A1 (für Refresh).

Mit dem Refresh wurden die Max-Q Technologien überarbeitet und bieten nun neben einer verbesserten Effizienz durch (neue Spannungswandler, Low-Power-GDDR6) auch zwei optionale Features. Der Notebookhersteller kann Dynamic Boost implementieren um Strom von der CPU zur GPU zu verlagern (TDP in 5 Watt Schritten). Weiters gibt es einen neuen "Dynamic Display Switch" für Advanced Optimus der G-SYNC und bis zu 4K 120 Hz ermöglichen.

Features

Der TU104-Chip wird in 12nm gefertigt und bietet eine Reihe neuer Features, wie DLSS (Deep Learning Super Sampling) und Real Time Ray Tracing. Dadurch lassen sich vor allem Beleuchtungseffekte sehr viel realistischer darstellen. Weiterhin gibt es Support für DisplayPort 1.4 (ready), HDMI 2.0b, HDR, Simultaneous Multi-Projection (SMP) sowie H.265 Video De- und Encoding (PlayReady 3.0). 

Performance

Die Performance der mobilen GeForce RTX 2080 Super Max-Q ist stark abhängig vom verbauten Notebook und kann sich in unseren ersten Tests nur minimal von der alten RTX 2080 Max-Q absetzen. Damit erreicht sie meist nur die Performance einer normalen RTX 2070 für Notebooks. Damit eignet sich die Grafikkarte am besten für 1440p bei maximalen Details in anspruchsvollen Spielen wie Red Dead Redemption 2, Control oder Borderlands 3. Weniger anspruchsvolle Spiele wie F1 2019 können auch in 4k mit maximalen Details flüssig gespielt werden. Detaillierte Spielebenchmarks finden Sie am Ende dieser Seite.

Durch den verringerten Stromverbrauch von 80 - 90 Watt TGP eignet sich die RTX 2080 Super Max-Q auch für dünnere Gaming-Notebooks.

NVIDIA Titan RTX

► remove from comparison

Die Nvidia Titan RTX bietet mit dem Vollausbau des TU102-Grafikprozessors nochmals mehr Leistung als das bisherige Topmodell Nvidia GeForce RTX 2080 Ti. Dieses Topmodell für High-End-Consumer auf Basis der aktuellen Turing-Grafikkarten für Desktop-PCs wurde im Dezember 2018 vorgestellt. Die GPU verfügt über die 4.608 Shadereinheiten, sowie 24 GB GDDR6-Speicher an einem 384-Bit-Interface (14 GHz, 672 GB/s). Zusätzlich integriert die 2080 Ti 576 Tensor-Kerne und 72 Raytracing-Kerne.

Features

Der TU102-Chip wird in 12nm gefertigt und bietet eine Reihe neuer Features, wie DLSS (Deep Learning Super Sampling) und Real Time Ray Tracing. Dadurch lassen sich vor allem Bleuchtungseffekte sehr viel realistischer darstellen. Weiterhin gibt es Support für DisplayPort 1.4 (ready), HDMI 2.0b, HDR, Simultaneous Multi-Projection (SMP) sowie H.265 Video De- und Encoding (PlayReady 3.0). Im Vollausbau bietet der TU102 4.608 Shader, 576 Tensor Kerne und 72 Raytracing Kerne. Damit bietet die Nvidia Titan RTX die gleichen Spezifikationen wie die Nvidia Quadro RTX 8000. Leider bleiben die vielen Quadro-Features weiterhin nur der teureren Quadro-Familie erhalten. 

Performance

Die Performance der Titan RTX liegt in 4K zwar vor der GeForce RTX 2080 ti, jedoch ist dieser mit wenigen Prozent schon fast zu vernachlässigen. Eine übertaktete RTX 2080 ti sollte somit einer Titan RTX wieder überlegen sein. Im Gegen die Titan X auf Pascal-Basis kann sich das Turing-Modell einen Vorsprung von bis zu 30 % erzielen. Mit dieser Leistung ordnet sich die Titan RTX zweifelsohne im High-End-Segment ein und kann die meisten Spiele des Jahres 2018 in hohen Einstellungen und 4K-Auflösung flüssig darstellen.

Leistungsaufnahme

Die Leistungsaufnahme der Nvidia Titan RTX wird vom Hersteller mit 280 Watt beziffert. Im Vergleich zur Titan X (Pascal) benötigt das neue Spitzenmodell bei voller Auslastung 30 Watt mehr.

AMD Radeon RX 7700 XTNVIDIA GeForce RTX 2080 Super Max-QNVIDIA Titan RTX
GeForce RTX 2000 Serie
Radeon RX 7900 XTX 6144 @ 2.27 GHz384 Bit @ 20000 MHz
Radeon RX 7900 XT 5376 @ 2 GHz320 Bit @ 20000 MHz
Radeon RX 7900 GRE 5120 @ 2.25 GHz256 Bit @ 18000 MHz
Radeon RX 7800 XT 3840 @ 2.43 GHz256 Bit @ 19500 MHz
Radeon RX 7700 XT 3456 @ 1.7 - 2.54 GHz192 Bit @ 18000 MHz
Titan RTX 4608 @ 1.35 - 1.77 GHz384 Bit @ 14000 MHz
GeForce RTX 2080 Ti (Desktop) 4352 @ 1.35 - 1.55 GHz352 Bit @ 14000 MHz
GeForce RTX 2080 Super (Desktop) 3072 @ 1.65 - 1.82 GHz256 Bit @ 15500 MHz
GeForce RTX 2080 (Desktop) 2944 @ 1.52 - 1.71 GHz256 Bit @ 14000 MHz
GeForce RTX 2080 Super Mobile 3072 @ 1.37 - 1.56 GHz256 Bit @ 14000 MHz
GeForce RTX 2080 Mobile 2944 @ 1.38 - 1.59 GHz256 Bit @ 14000 MHz
GeForce RTX 2070 Super (Desktop) 2560 @ 1.61 - 1.77 GHz256 Bit @ 14000 MHz
GeForce RTX 2070 (Desktop) 2304 @ 1.41 - 1.62 GHz256 Bit @ 14000 MHz
GeForce RTX 2070 Super Mobile 2560 @ 1.14 - 1.38 GHz256 Bit @ 14002 MHz
GeForce RTX 2080 Super Max-Q 3072 @ 0.98 - 1.23 GHz256 Bit @ 11000 MHz
GeForce RTX 2060 Super (Desktop) 2176 @ 1.47 - 1.65 GHz256 Bit @ 14000 MHz
GeForce RTX 2070 Mobile 2304 @ 1.22 - 1.44 GHz256 Bit @ 14000 MHz
GeForce RTX 2080 Max-Q 2944 @ 0.74 - 1.1 GHz256 Bit @ 12000 MHz
GeForce RTX 2060 (Desktop) 1920 @ 1.32 - 1.62 GHz192 Bit @ 14000 MHz
GeForce RTX 2070 Super Max-Q 2560 @ 0.93 - 1.16 GHz256 Bit @ 11000 MHz
GeForce RTX 2070 Max-Q 2304 @ 0.89 - 1.19 GHz256 Bit @ 12000 MHz
GeForce RTX 2060 Mobile 1920 @ 0.96 - 1.2 GHz192 Bit @ 14000 MHz
GeForce RTX 2060 Max-Q 1920 @ 0.98 - 1.19 GHz192 Bit @ 11000 MHz
GeForce RTX 2050 Mobile 2048 @ 1.48 GHz64 Bit @ 14000 MHz
CodenameNavi 32N18E-G3Turing TU102
ArchitekturRDNA 3TuringTuring
Pipelines3456 - unified3072 - unified4608 - unified
TMUs216
ROPs96
Raytracing Cores54
Tensor / AI Cores108
Kerntakt1700 - 2544 (Boost) MHz975 - 1230 (Boost) MHz1350 - 1770 (Boost) MHz
Theoretical Performance70.34 TFLOPS FP16, 35.17 TFLOPS FP32, 1.099 TFLOPS FP64
CacheL2: 2 MB, L3: 48 MB
Speichertakt18000 effective = 2430 MHz11000 MHz14000 MHz
Speicherbandbreite192 Bit256 Bit384 Bit
SpeichertypGDDR6GDDR6GDDR6
Max. Speichergröße12 GB8 GB24 GB
Shared Memoryneinneinnein
Memory Bandwidth432 GB/s
APIDirectX 12 Ultimate (12_2), Shader 6.7, OpenGL 4.6, OpenCL 2.2, Vulkan 1.3DirectX 12_1, OpenGL 4.6DirectX 12_1, Shader 6.4, OpenGL 4.6
Stromverbrauch245 Watt90 Watt280 Watt
Transistors28.1 Billion13.6 Billion18.6 Billion
Die Size 346 mm²
PCIe4.0 x16
Displays4 Displays (max.), HDMI 2.1a, DisplayPort 2.1 UHBR13.5
Erscheinungsdatum25.08.2023 02.04.2020 03.12.2018
Herstellerseitewww.amd.com
SuccessorRadeon RX 6700 XT
Herstellungsprozess12 nm12 nm
FeaturesNVLink, DLSS, Raytraycing, VR Ready, G-SYNC, Vulkan, Multi Monitor, 650 Watt system power recommendedNVLink, DLSS, Raytraycing, VR Ready, G-SYNC, Vulkan, Multi Monitor, 650 Watt system power recommended
Notebookgrößegroß (17" z.B.)

Benchmarks

Performance Rating - 3DMark 11 + Fire Strike + Time Spy - Radeon RX 7700 XT
16 pt (48%)
Restrict / Search: Model: Max. age: years
Performance Rating - 3DMark 11 + Fire Strike + Time Spy - Titan RTX
13.4 pt (40%)
Restrict / Search: Model: Max. age: years
3DMark - 3DMark Speed Way Score
3124 Points (21%)
min: 3182     avg: 3191     median: 3186 (22%)     max: 3205 Points
3DMark - 3DMark Steel Nomad
3779 Points (26%)
3DMark - 3DMark Steel Nomad Light
15462 Points (35%)
3DMark - 3DMark Wild Life Unlimited
96465 Points (49%)
3DMark - 3DMark Solar Bay
68829 Points (32%)
3DMark - 3DMark Fire Strike Standard Score
38758 Points (59%)
min: 17053     avg: 18565     median: 18578.5 (28%)     max: 20173 Points
min: 20679     avg: 28156     median: 27999 (42%)     max: 35830 Points
3DMark - 3DMark Fire Strike Standard Graphics
42801 Points (39%)
min: 19655     avg: 21743     median: 21902.5 (20%)     max: 23649 Points
min: 33377     avg: 36062     median: 35884 (33%)     max: 40910 Points
3DMark - 3DMark Ice Storm Graphics
628317 Points (70%)
min: 304286     avg: 499679     median: 510836 (57%)     max: 708281 Points
3DMark - 3DMark Time Spy Score
16454 Points (43%)
min: 7475     avg: 8204     median: 8075 (21%)     max: 9051 Points
min: 10798     avg: 13874     median: 14007 (36%)     max: 15955 Points
3DMark - 3DMark Time Spy Graphics
16777 Points (34%)
min: 7372     avg: 8210     median: 8331 (17%)     max: 8979 Points
min: 14216     avg: 14893     median: 14961.5 (30%)     max: 15283 Points
3DMark - 3DMark Ice Storm Unlimited Graphics
730434 Points (74%)
min: 443119     avg: 465029     median: 468363 (47%)     max: 483604 Points
min: 386786     avg: 573459     median: 537413 (54%)     max: 798347 Points
3DMark - 3DMark Ice Storm Extreme Graphics
569083 Points (67%)
min: 290154     avg: 456832     median: 461607 (54%)     max: 615600 Points
3DMark - 3DMark Cloud Gate Score
80883 Points (76%)
min: 32880     avg: 42751     median: 44534 (42%)     max: 53680 Points
min: 24891     avg: 59427     median: 63672.5 (60%)     max: 81469 Points
3DMark - 3DMark Cloud Gate Graphics
201871 Points (50%)
min: 101976     avg: 126108     median: 127741 (31%)     max: 140750 Points
min: 145389     avg: 176948     median: 177234 (44%)     max: 202725 Points
3DMark - 3DMark Night Raid
83002 Points (78%)
min: 0     avg: 50876     median: 56519 (53%)     max: 88698 Points
3DMark - 3DMark Night Raid Graphics Score
176451 Points (68%)
min: 79576     avg: 126974     median: 132210 (51%)     max: 174384 Points
3DMark 11 - 3DM11 Performance Score
45241 Points (55%)
min: 20888     avg: 23821     median: 24119 (29%)     max: 26066 Points
min: 23108     avg: 34679     median: 34920 (42%)     max: 44979 Points
3DMark 11 - 3DM11 Performance GPU
57340 Points (44%)
min: 26292     avg: 29663     median: 29636.5 (23%)     max: 32995 Points
min: 43461     avg: 49115     median: 49602 (38%)     max: 51863 Points
3DMark Vantage
3DM Vant. Perf. total + AMD Radeon RX 7700 XT
3DMark Vantage - 3DM Vant. Perf. total
126733 Points (37%)
3DM Vant. Perf. total + NVIDIA GeForce RTX 2080 Super Max-Q
60306 Points (17%)
3DM Vant. Perf. total + NVIDIA Titan RTX
min: 71673     avg: 98814     median: 99561 (29%)     max: 120336 Points
3DM Vant. Perf. GPU no PhysX + AMD Radeon RX 7700 XT
3DMark Vantage - 3DM Vant. Perf. GPU no PhysX
135301 Points (74%)
3DM Vant. Perf. GPU no PhysX + NVIDIA GeForce RTX 2080 Super Max-Q
69467 Points (38%)
3DM Vant. Perf. GPU no PhysX + NVIDIA Titan RTX
min: 10307     avg: 98904     median: 107177 (58%)     max: 128166 Points
3DMark 03 - 3DMark 03 - Standard
141003 Points (74%)
3DMark 05 - 3DMark 05 - Standard
min: 35314     avg: 62178     median: 60144 (66%)     max: 91296 Points
3DMark 06 3DMark 06 - Standard 1280x1024 + AMD Radeon RX 7700 XT
3DMark 06
65983 Points (86%)
3DMark 06 - Standard 1280x1024 + NVIDIA GeForce RTX 2080 Super Max-Q
38265 Points (50%)
3DMark 06 - Standard 1280x1024 + NVIDIA Titan RTX
min: 7882     avg: 49384     median: 51380 (67%)     max: 69803 Points
3DMark 06 - Standard 1366x768 + NVIDIA Titan RTX
3DMark 06
46874 Points (61%)
Unigine Valley 1.0 - Unigine Valley 1.0 DX
160.1 fps (49%)
min: 135     avg: 173.3     median: 179 (54%)     max: 191.4 fps
Blender - Blender 3.3 Classroom CUDA *
31 Seconds (5%)
Blender - Blender 3.3 Classroom OPTIX *
21 Seconds (8%)
Blender - Blender 3.3 Classroom HIP *
37 Seconds (3%)
SPECviewperf 12
specvp12 sw-03 + AMD Radeon RX 7700 XT
SPECviewperf 12 - specvp12 sw-03
288 fps (71%)
specvp12 sw-03 + NVIDIA Titan RTX
min: 114.8     avg: 164.8     median: 165 (41%)     max: 207 fps
specvp12 snx-02 + AMD Radeon RX 7700 XT
SPECviewperf 12 - specvp12 snx-02
268 fps (40%)
specvp12 snx-02 + NVIDIA Titan RTX
min: 227.5     avg: 263.9     median: 263.3 (39%)     max: 306 fps
specvp12 showcase-01 + AMD Radeon RX 7700 XT
SPECviewperf 12 - specvp12 showcase-01
179 fps (31%)
specvp12 showcase-01 + NVIDIA Titan RTX
min: 185.7     avg: 193.8     median: 193.3 (34%)     max: 203 fps
specvp12 mediacal-01 + AMD Radeon RX 7700 XT
SPECviewperf 12 - specvp12 mediacal-01
177 fps (45%)
specvp12 mediacal-01 + NVIDIA Titan RTX
min: 83.9     avg: 94.6     median: 90.7 (23%)     max: 127 fps
specvp12 maya-04 + AMD Radeon RX 7700 XT
SPECviewperf 12 - specvp12 maya-04
283 fps (77%)
specvp12 maya-04 + NVIDIA Titan RTX
min: 110.9     avg: 184     median: 186 (51%)     max: 260 fps
specvp12 energy-01 + AMD Radeon RX 7700 XT
SPECviewperf 12 - specvp12 energy-01
33.4 fps (30%)
specvp12 energy-01 + NVIDIA Titan RTX
min: 27.75     avg: 28.7     median: 28.5 (25%)     max: 31.1 fps
specvp12 creo-01 + AMD Radeon RX 7700 XT
SPECviewperf 12 - specvp12 creo-01
123 fps (49%)
specvp12 creo-01 + NVIDIA Titan RTX
min: 106.3     avg: 153.8     median: 154.5 (62%)     max: 202 fps
specvp12 catia-04 + AMD Radeon RX 7700 XT
SPECviewperf 12 - specvp12 catia-04
351 fps (58%)
specvp12 catia-04 + NVIDIA Titan RTX
min: 146.7     avg: 238.9     median: 225.2 (37%)     max: 354 fps
specvp12 3dsmax-05 + AMD Radeon RX 7700 XT
SPECviewperf 12 - specvp12 3dsmax-05
373 fps (56%)
specvp12 3dsmax-05 + NVIDIA Titan RTX
min: 243.4     avg: 283.6     median: 288.4 (43%)     max: 315 fps
SPECviewperf 13 specvp13 sw-04 + AMD Radeon RX 7700 XT
SPECviewperf 13 - specvp13 sw-04
265 fps (71%)
specvp13 sw-04 + NVIDIA GeForce RTX 2080 Super Max-Q
min: 88.7     avg: 88.8     median: 88.8 (24%)     max: 88.9 fps
specvp13 sw-04 + NVIDIA Titan RTX
min: 112.8     avg: 169.6     median: 166.2 (45%)     max: 229 fps
specvp13 snx-03 + AMD Radeon RX 7700 XT
SPECviewperf 13 - specvp13 snx-03
486 fps (54%)
specvp13 snx-03 + NVIDIA GeForce RTX 2080 Super Max-Q
min: 20.88     avg: 21.1     median: 21.1 (2%)     max: 21.33 fps
specvp13 snx-03 + NVIDIA Titan RTX
min: 411.2     avg: 476.5     median: 472.9 (52%)     max: 552 fps
specvp13 showcase-02 + AMD Radeon RX 7700 XT
SPECviewperf 13 - specvp13 showcase-02
179 fps (30%)
specvp13 showcase-02 + NVIDIA GeForce RTX 2080 Super Max-Q
96.2 fps (16%)
specvp13 showcase-02 + NVIDIA Titan RTX
min: 184.3     avg: 192.8     median: 193.2 (33%)     max: 199 fps
specvp13 medical-02 + AMD Radeon RX 7700 XT
SPECviewperf 13 - specvp13 medical-02
300 fps (51%)
specvp13 medical-02 + NVIDIA GeForce RTX 2080 Super Max-Q
min: 53.1     avg: 55.5     median: 55.5 (9%)     max: 57.9 fps
specvp13 medical-02 + NVIDIA Titan RTX
min: 84     avg: 90.1     median: 90 (15%)     max: 93.7 fps
specvp13 maya-05 + AMD Radeon RX 7700 XT
SPECviewperf 13 - specvp13 maya-05
487 fps (55%)
specvp13 maya-05 + NVIDIA GeForce RTX 2080 Super Max-Q
min: 210.2     avg: 212.8     median: 212.8 (24%)     max: 215.4 fps
specvp13 maya-05 + NVIDIA Titan RTX
min: 291.6     avg: 425.4     median: 411.9 (47%)     max: 530 fps
specvp13 energy-02 + AMD Radeon RX 7700 XT
SPECviewperf 13 - specvp13 energy-02
115 fps (37%)
specvp13 energy-02 + NVIDIA GeForce RTX 2080 Super Max-Q
min: 17.49     avg: 17.7     median: 17.7 (6%)     max: 17.92 fps
specvp13 energy-02 + NVIDIA Titan RTX
min: 51.8     avg: 52.7     median: 52.4 (17%)     max: 53.9 fps
specvp13 creo-02 + AMD Radeon RX 7700 XT
SPECviewperf 13 - specvp13 creo-02
387 fps (57%)
specvp13 creo-02 + NVIDIA GeForce RTX 2080 Super Max-Q
min: 170     avg: 173.6     median: 173.6 (25%)     max: 177.2 fps
specvp13 creo-02 + NVIDIA Titan RTX
min: 266.2     avg: 344     median: 339.2 (50%)     max: 405 fps
specvp13 catia-05 + AMD Radeon RX 7700 XT
SPECviewperf 13 - specvp13 catia-05
529 fps (59%)
specvp13 catia-05 + NVIDIA GeForce RTX 2080 Super Max-Q
min: 132.3     avg: 136.4     median: 136.4 (15%)     max: 140.4 fps
specvp13 catia-05 + NVIDIA Titan RTX
min: 221.9     avg: 373.5     median: 366.8 (41%)     max: 546 fps
specvp13 3dsmax-06 + AMD Radeon RX 7700 XT
SPECviewperf 13 - specvp13 3dsmax-06
371 fps (58%)
specvp13 3dsmax-06 + NVIDIA GeForce RTX 2080 Super Max-Q
min: 175.5     avg: 176.1     median: 176.1 (28%)     max: 176.6 fps
specvp13 3dsmax-06 + NVIDIA Titan RTX
min: 243.1     avg: 283.2     median: 288 (45%)     max: 321 fps
SPECviewperf 2020 specvp2020 snx-04 4k + AMD Radeon RX 7700 XT
SPECviewperf 2020 - specvp2020 snx-04 4k
312 fps (32%)
specvp2020 snx-04 4k + NVIDIA Titan RTX
min: 337     avg: 372.4     median: 371 (38%)     max: 454 fps
specvp2020 medical-03 4k + AMD Radeon RX 7700 XT
SPECviewperf 2020 - specvp2020 medical-03 4k
56.2 fps (36%)
specvp2020 medical-03 4k + NVIDIA Titan RTX
min: 16.33     avg: 18.6     median: 16.7 (11%)     max: 41.1 fps
specvp2020 maya-06 4k + AMD Radeon RX 7700 XT
SPECviewperf 2020 - specvp2020 maya-06 4k
261 fps (37%)
specvp2020 maya-06 4k + NVIDIA Titan RTX
min: 247     avg: 277.6     median: 264.3 (38%)     max: 445 fps
specvp2020 energy-03 4k + AMD Radeon RX 7700 XT
SPECviewperf 2020 - specvp2020 energy-03 4k
95 fps (21%)
specvp2020 energy-03 4k + NVIDIA Titan RTX
min: 37.7     avg: 50.1     median: 39.4 (9%)     max: 93.9 fps
specvp2020 creo-03 4k + AMD Radeon RX 7700 XT
SPECviewperf 2020 - specvp2020 creo-03 4k
130 fps (58%)
specvp2020 creo-03 4k + NVIDIA Titan RTX
min: 109     avg: 127.5     median: 126 (57%)     max: 163 fps
specvp2020 catia-06 4k + AMD Radeon RX 7700 XT
SPECviewperf 2020 - specvp2020 catia-06 4k
88.8 fps (58%)
specvp2020 catia-06 4k + NVIDIA Titan RTX
min: 73.8     avg: 83.8     median: 79.3 (52%)     max: 122 fps
specvp2020 3dsmax-07 4k + AMD Radeon RX 7700 XT
SPECviewperf 2020 - specvp2020 3dsmax-07 4k
106 fps (36%)
specvp2020 3dsmax-07 4k + NVIDIA Titan RTX
min: 108     avg: 119.4     median: 116 (39%)     max: 169 fps
specvp2020 solidworks-05 4k + NVIDIA Titan RTX
SPECviewperf 2020 - specvp2020 solidworks-05 4k
min: 153     avg: 171.2     median: 157.5 (38%)     max: 336 fps
Cinebench R10 Cinebench R10 Shading (32bit) + NVIDIA GeForce RTX 2080 Super Max-Q
Cinebench R10 - Cinebench R10 Shading (32bit)
13620 Points (10%)
Cinebench R10 Shading (32bit) + NVIDIA Titan RTX
min: 6709     avg: 7901     median: 6831 (5%)     max: 19419 Points
Cinebench R11.5 Cinebench R11.5 OpenGL 64 Bit + NVIDIA GeForce RTX 2080 Super Max-Q
Cinebench R11.5 - Cinebench R11.5 OpenGL 64 Bit
82.1 fps (27%)
Cinebench R11.5 OpenGL 64 Bit + NVIDIA Titan RTX
min: 104     avg: 181.2     median: 174.2 (57%)     max: 274.3 fps
Cinebench R15
Cinebench R15 OpenGL 64 Bit + NVIDIA GeForce RTX 2080 Super Max-Q
Cinebench R15 - Cinebench R15 OpenGL 64 Bit
min: 114     avg: 140.1     median: 142 (8%)     max: 152.1 fps
Cinebench R15 OpenGL 64 Bit + NVIDIA Titan RTX
min: 99.9     avg: 205.4     median: 173.6 (10%)     max: 371.3 fps
Cinebench R15 OpenGL Ref. Match 64 Bit + NVIDIA GeForce RTX 2080 Super Max-Q
Cinebench R15 - Cinebench R15 OpenGL Ref. Match 64 Bit
99.6 % (100%)
Cinebench R15 OpenGL Ref. Match 64 Bit + NVIDIA Titan RTX
min: 99.6     avg: 99.6     median: 99.6 (100%)     max: 99.8 %
GFXBench - GFXBench Car Chase Offscreen
368.4 fps (35%)
Basemark GPU 1.2 - Basemark GPU 1.2 Vulkan Official Medium Offscreen 1080
104.6 fps (3%)
Basemark GPU 1.2 - Basemark GPU 1.2 Vulkan Official High Offscreen 2160
3.6 fps (1%)
Geekbench 6.5 - Geekbench 6.5 GPU OpenCL
126529 Points (32%)
148703 Points (38%)
Geekbench 6.5 - Geekbench 6.5 GPU Vulkan
131411 Points (33%)
146551 Points (36%)
LuxMark v2.0 64Bit - LuxMark v2.0 Room GPU
3258 Samples/s (12%)
min: 4643     avg: 4673     median: 4673 (17%)     max: 4703 Samples/s
LuxMark v2.0 64Bit - LuxMark v2.0 Sala GPU
8614 Samples/s (15%)
min: 10799     avg: 10898     median: 10897.5 (19%)     max: 10996 Samples/s
ComputeMark v2.1 - ComputeMark v2.1 Result
38363 Points (32%)
16221 Points (13%)
min: 27907     avg: 28802     median: 28670 (24%)     max: 29830 Points
Power Consumption - Furmark Stress Test Power Consumption - external Monitor *
365 Watt (49%)
161 Watt (22%)
419 Watt (56%)
Power Consumption - The Witcher 3 Power Consumption - external Monitor *
384 Watt (54%)
149 Watt (21%)
min: 370.5     avg: 408.1     median: 403 (56%)     max: 463 Watt
Power Consumption - Witcher 3 Power Consumption *
min: 140     avg: 150.1     median: 146.1 (32%)     max: 170 Watt
Power Consumption - Power Efficiency - Witcher 3 ultra
min: 0.4418     avg: 0.6     median: 0.6 (51%)     max: 0.635 fps per Watt
Power Consumption - Power Efficiency - Witcher 3 ultra external Monitor
0.4 fps per Watt (36%)
0.6 fps per Watt (49%)
min: 0.2926     avg: 0.3     median: 0.3 (28%)     max: 0.385 fps per Watt
Power Consumption - Cyberpunk 2077 Power Consumption - external Monitor *
537 Watt (68%)
Emissions Witcher 3 Fan Noise + AMD Radeon RX 7700 XT
Emissions - Witcher 3 Fan Noise
42.1 dB(A) (60%)
Witcher 3 Fan Noise + NVIDIA GeForce RTX 2080 Super Max-Q
min: 41     avg: 48.1     median: 48 (69%)     max: 54 dB(A)
Clock Speed - GPU Clock Witcher 3 ultra
min: 1215     avg: 1371     median: 1387.5 (54%)     max: 1506 MHz
Clock Speed - GPU Clock Speed Furmark
819 MHz (32%)

Average Benchmarks AMD Radeon RX 7700 XT → 100% n=22

Average Benchmarks NVIDIA GeForce RTX 2080 Super Max-Q → 44% n=22

Average Benchmarks NVIDIA Titan RTX → 78% n=22

- Bereich der Benchmarkergebnisse für diese Grafikkarte
red legend - Durchschnittliche Benchmarkergebnisse für diese Grafikkarte
* Smaller numbers mean a higher performance
1 This benchmark is not used for the average calculation

Spiele-Benchmarks

Die folgenden Benchmarks basieren auf unseren Spieletests mit Testnotebooks. Die Performance dieser Grafikkarte bei den gelisteten Spielen ist abhängig von der verwendeten CPU, Speicherausstattung, Treiber und auch Betriebssystem. Dadurch müssen die untenstehenden Werte nicht repräsentativ sein. Detaillierte Informationen über das verwendete System sehen Sie nach einem Klick auf den fps-Wert.

low 1920x1080
Titan RTX:
99  fps
med. 1920x1080
Titan RTX:
75  fps
high 1920x1080
Titan RTX:
58  fps
ultra 1920x1080
Titan RTX:
32  fps
QHD 2560x1440
Titan RTX:
25  fps
4K 3840x2160
Titan RTX:
15  fps
4K DLSS 3840x2160
Titan RTX:
25  fps
QHD DLSS 2560x1440
Titan RTX:
35  fps
low 1920x1080
Titan RTX:
240  fps
med. 1920x1080
Titan RTX:
178.4  fps
high 1920x1080
Titan RTX:
152.7  fps
ultra 1920x1080
Titan RTX:
137.1  fps
QHD 2560x1440
Titan RTX:
93.2  fps
4K 3840x2160
Titan RTX:
49  fps
low 1920x1080
Titan RTX:
211  fps
med. 1920x1080
Titan RTX:
128.9  fps
high 1920x1080
Titan RTX:
106.5  fps
ultra 1920x1080
Titan RTX:
89.4  fps
QHD 2560x1440
Titan RTX:
60.8  fps
4K 3840x2160
Titan RTX:
34.2  fps
4K DLSS 3840x2160
Titan RTX:
33.9  fps
F1 24

F1 24

2024
low 1920x1080
Titan RTX:
385  fps
med. 1920x1080
Titan RTX:
325  fps
high 1920x1080
Titan RTX:
244  fps
ultra 1920x1080
Titan RTX:
80.8  fps
QHD 2560x1440
Titan RTX:
53.6  fps
4K 3840x2160
Titan RTX:
26.6  fps
4K DLSS 3840x2160
Titan RTX:
47.1  fps
QHD DLSS 2560x1440
Titan RTX:
84.1  fps
low 1920x1080
Titan RTX:
77.3  fps
med. 1920x1080
Titan RTX:
65.3  fps
high 1920x1080
Titan RTX:
49.7  fps
QHD 2560x1440
Titan RTX:
34.9  fps
4K 3840x2160
Titan RTX:
19.9  fps
4K DLSS 3840x2160
Titan RTX:
34.1  fps
QHD DLSS 2560x1440
Titan RTX:
52.7  fps
low 1920x1080
Titan RTX:
130.4  fps
med. 1920x1080
Titan RTX:
107.9  fps
high 1920x1080
Titan RTX:
99.6  fps
ultra 1920x1080
Titan RTX:
80  fps
QHD 2560x1440
Titan RTX:
62.3  fps
4K 3840x2160
Titan RTX:
39.4  fps
4K DLSS 3840x2160
Titan RTX:
58.2  fps
QHD DLSS 2560x1440
Titan RTX:
83.4  fps
low 1920x1080
Titan RTX:
145.3  fps
med. 1920x1080
Titan RTX:
131.4  fps
high 1920x1080
Titan RTX:
91.3  fps
ultra 1920x1080
Titan RTX:
90.4  fps
QHD 2560x1440
Titan RTX:
68.8  fps
4K 3840x2160
Titan RTX:
41.9  fps
4K DLSS 3840x2160
Titan RTX:
56.4  fps
4K FSR 3840x2160
Titan RTX:
54.4  fps
low 1920x1080
Titan RTX:
313  fps
med. 1920x1080
Titan RTX:
272  fps
high 1920x1080
Titan RTX:
233  fps
ultra 1920x1080
Titan RTX:
137.9  fps
QHD 2560x1440
Titan RTX:
84.2  fps
4K 3840x2160
Titan RTX:
22.3  fps
4K DLSS 3840x2160
Titan RTX:
66.6  fps
4K FSR 3840x2160
Titan RTX:
79.1  fps
low 1920x1080
Titan RTX:
89.2  fps
high 1920x1080
Titan RTX:
72.3  fps
QHD 2560x1440
Titan RTX:
59.3  fps
4K 3840x2160
Titan RTX:
41.3  fps
4K DLSS 3840x2160
Titan RTX:
45.8  fps
4K FSR 3840x2160
Titan RTX:
44.6  fps
low 1920x1080
Titan RTX:
293  fps
med. 1920x1080
Titan RTX:
294  fps
high 1920x1080
Titan RTX:
267  fps
ultra 1920x1080
Titan RTX:
222  fps
QHD 2560x1440
Titan RTX:
147.8  fps
4K 3840x2160
Titan RTX:
74.3  fps
low 1920x1080
Titan RTX:
141  fps
med. 1920x1080
Titan RTX:
132  fps
high 1920x1080
Titan RTX:
109  fps
ultra 1920x1080
Titan RTX:
84  fps
QHD 2560x1440
Titan RTX:
68  fps
4K 3840x2160
Titan RTX:
42  fps
4K DLSS 3840x2160
Titan RTX:
61  fps
4K FSR 3840x2160
Titan RTX:
59  fps
low 1920x1080
Titan RTX:
188.3  fps
med. 1920x1080
Titan RTX:
143.6  fps
high 1920x1080
Titan RTX:
127.9  fps
ultra 1920x1080
Titan RTX:
125.3  fps
QHD 2560x1440
Titan RTX:
90.9  fps
4K 3840x2160
Titan RTX:
51.3  fps
low 1920x1080
Titan RTX:
105.7  fps
med. 1920x1080
Titan RTX:
92.9  fps
high 1920x1080
Titan RTX:
79.8  fps
ultra 1920x1080
Titan RTX:
67.4  fps
QHD 2560x1440
Titan RTX:
53.2  fps
4K 3840x2160
Titan RTX:
33  fps
4K DLSS 3840x2160
Titan RTX:
47.2  fps
4K FSR 3840x2160
Titan RTX:
40  fps
Palworld

Palworld

2024
low 1920x1080
Titan RTX:
146.6  fps
med. 1920x1080
Titan RTX:
123.8  fps
high 1920x1080
Titan RTX:
98.7  fps
ultra 1920x1080
Titan RTX:
91.4  fps
QHD 2560x1440
Titan RTX:
65.8  fps
4K 3840x2160
Titan RTX:
36.3  fps
4K DLSS 3840x2160
Titan RTX:
70.9  fps
med. 1920x1080
Titan RTX:
359  fps
high 1920x1080
Titan RTX:
359  fps
ultra 1920x1080
Titan RTX:
359  fps
QHD 2560x1440
Titan RTX:
359  fps
4K 3840x2160
Titan RTX:
277  fps
low 1920x1080
100%
Radeon RX 7700 XT:
281  fps
103%
Titan RTX:
289  fps
med. 1920x1080
100%
Radeon RX 7700 XT:
277  fps
102%
Titan RTX:
283  fps
high 1920x1080
100%
Radeon RX 7700 XT:
269  fps
95%
Titan RTX:
256  fps
ultra 1920x1080
100%
Radeon RX 7700 XT:
183.6  fps
100%
Titan RTX:
183.8  fps
QHD 2560x1440
100%
Radeon RX 7700 XT:
109.9  fps
99%
Titan RTX:
109.2  fps
4K 3840x2160
100%
Radeon RX 7700 XT:
48.4  fps
96%
Titan RTX:
46.4  fps
4K DLSS 3840x2160
Titan RTX:
101.7  fps
low 1920x1080
100%
Radeon RX 7700 XT:
347  fps
93%
Titan RTX:
324  fps
med. 1920x1080
100%
Radeon RX 7700 XT:
286  fps
87%
Titan RTX:
250  fps
high 1920x1080
100%
Radeon RX 7700 XT:
253  fps
89%
Titan RTX:
225  fps
ultra 1920x1080
100%
Radeon RX 7700 XT:
189.3  fps
91%
Titan RTX:
171.5  fps
QHD 2560x1440
100%
Radeon RX 7700 XT:
118.9  fps
94%
Titan RTX:
111.6  fps
4K 3840x2160
100%
Radeon RX 7700 XT:
54.7  fps
101%
Titan RTX:
55.1  fps
low 1920x1080
100%
Radeon RX 7700 XT:
114  fps
85%
Titan RTX:
97  fps
med. 1920x1080
100%
Radeon RX 7700 XT:
103  fps
88%
Titan RTX:
91  fps
high 1920x1080
100%
Radeon RX 7700 XT:
87  fps
92%
Titan RTX:
80  fps
ultra 1920x1080
100%
Radeon RX 7700 XT:
68  fps
94%
Titan RTX:
64  fps
QHD 2560x1440
100%
Radeon RX 7700 XT:
46  fps
96%
Titan RTX:
44  fps
4K 3840x2160
100%
Radeon RX 7700 XT:
23  fps
100%
Titan RTX:
23  fps
4K DLSS 3840x2160
Titan RTX:
39  fps
low 1920x1080
100%
Radeon RX 7700 XT:
234  fps
65%
Titan RTX:
153  fps
med. 1920x1080
100%
Radeon RX 7700 XT:
212  fps
66%
Titan RTX:
139  fps
high 1920x1080
100%
Radeon RX 7700 XT:
171  fps
64%
Titan RTX:
110  fps
ultra 1920x1080
100%
Radeon RX 7700 XT:
158  fps
65%
Titan RTX:
103  fps
QHD 2560x1440
100%
Radeon RX 7700 XT:
109  fps
68%
Titan RTX:
74  fps
4K 3840x2160
100%
Radeon RX 7700 XT:
64  fps
70%
Titan RTX:
45  fps
low 1920x1080
100%
Radeon RX 7700 XT:
240  fps
73%
Titan RTX:
175.3  fps
med. 1920x1080
100%
Radeon RX 7700 XT:
155.8  fps
85%
Titan RTX:
133.1  fps
high 1920x1080
100%
Radeon RX 7700 XT:
140.4  fps
87%
Titan RTX:
122.3  fps
ultra 1920x1080
100%
Radeon RX 7700 XT:
125.5  fps
89%
Titan RTX:
111.5  fps
QHD 2560x1440
100%
Radeon RX 7700 XT:
92.8  fps
90%
Titan RTX:
83.3  fps
4K 3840x2160
100%
Radeon RX 7700 XT:
51.8  fps
96%
Titan RTX:
49.5  fps
4K DLSS 3840x2160
Titan RTX:
70.6  fps
low 1920x1080
100%
Radeon RX 7700 XT:
119.7  fps
77%
Titan RTX:
91.7  fps
med. 1920x1080
100%
Radeon RX 7700 XT:
108  fps
76%
Titan RTX:
82.5  fps
high 1920x1080
100%
Radeon RX 7700 XT:
93.2  fps
84%
Titan RTX:
78  fps
QHD 2560x1440
100%
Radeon RX 7700 XT:
62.7  fps
86%
Titan RTX:
54.1  fps
4K 3840x2160
100%
Radeon RX 7700 XT:
30.8  fps
92%
Titan RTX:
28.3  fps
low 1920x1080
100%
Radeon RX 7700 XT:
135  fps
82%
Titan RTX:
110.7  fps
med. 1920x1080
100%
Radeon RX 7700 XT:
113.8  fps
87%
Titan RTX:
98.7  fps
high 1920x1080
100%
Radeon RX 7700 XT:
79.4  fps
90%
Titan RTX:
71.8  fps
ultra 1920x1080
100%
Radeon RX 7700 XT:
56  fps
91%
Titan RTX:
51.1  fps
QHD 2560x1440
100%
Radeon RX 7700 XT:
37.1  fps
95%
Titan RTX:
35.3  fps
4K 3840x2160
100%
Radeon RX 7700 XT:
19.2  fps
98%
Titan RTX:
18.9  fps
4K DLSS 3840x2160
Titan RTX:
35.5  fps
low 1920x1080
100%
Radeon RX 7700 XT:
519.1  fps
95%
Titan RTX:
493  fps
med. 1920x1080
100%
Radeon RX 7700 XT:
333.2  fps
96%
Titan RTX:
319.6  fps
high 1920x1080
100%
Radeon RX 7700 XT:
209.7  fps
96%
Titan RTX:
200.9  fps
ultra 1920x1080
100%
Radeon RX 7700 XT:
169.6  fps
94%
Titan RTX:
159.9  fps
QHD 2560x1440
100%
Radeon RX 7700 XT:
122.8  fps
94%
Titan RTX:
116  fps
4K 3840x2160
100%
Radeon RX 7700 XT:
60.5  fps
100%
Titan RTX:
60.8  fps
low 1920x1080
100%
Radeon RX 7700 XT:
186  fps
72%
Titan RTX:
134  fps
med. 1920x1080
100%
Radeon RX 7700 XT:
168  fps
74%
Titan RTX:
125  fps
high 1920x1080
100%
Radeon RX 7700 XT:
154  fps
77%
Titan RTX:
119  fps
ultra 1920x1080
100%
Radeon RX 7700 XT:
120  fps
82%
Titan RTX:
98  fps
QHD 2560x1440
100%
Radeon RX 7700 XT:
91  fps
87%
Titan RTX:
79  fps
4K 3840x2160
100%
Radeon RX 7700 XT:
54  fps
94%
Titan RTX:
51  fps
4K DLSS 3840x2160
Titan RTX:
70  fps
low 1920x1080
100%
Radeon RX 7700 XT:
395  fps
86%
Titan RTX:
338  fps
med. 1920x1080
100%
Radeon RX 7700 XT:
345  fps
85%
Titan RTX:
292  fps
high 1920x1080
100%
Radeon RX 7700 XT:
274  fps
90%
Titan RTX:
247  fps
ultra 1920x1080
100%
Radeon RX 7700 XT:
246  fps
93%
Titan RTX:
228  fps
QHD 2560x1440
100%
Radeon RX 7700 XT:
199.1  fps
90%
Titan RTX:
178.7  fps
4K 3840x2160
100%
Radeon RX 7700 XT:
127.2  fps
86%
Titan RTX:
109.5  fps
low 1920x1080
100%
Radeon RX 7700 XT:
351  fps
101%
Titan RTX:
353  fps
med. 1920x1080
100%
Radeon RX 7700 XT:
344  fps
99%
Titan RTX:
342  fps
high 1920x1080
100%
Radeon RX 7700 XT:
283  fps
102%
Titan RTX:
289  fps
ultra 1920x1080
100%
Radeon RX 7700 XT:
202  fps
124%
Titan RTX:
251  fps
QHD 2560x1440
100%
Radeon RX 7700 XT:
127.2  fps
124%
Titan RTX:
157.1  fps
4K 3840x2160
100%
Radeon RX 7700 XT:
62  fps
145%
Titan RTX:
89.6  fps
low 1920x1080
100%
Radeon RX 7700 XT:
175.9  fps
94%
Titan RTX:
164.6 166.6 ~ 166 fps
med. 1920x1080
100%
Radeon RX 7700 XT:
145.1  fps
106%
Titan RTX:
135.2 140.8 185.8 ~ 154 fps
high 1920x1080
100%
Radeon RX 7700 XT:
120.8  fps
99%
Titan RTX:
118.9 122 ~ 120 fps
ultra 1920x1080
100%
Radeon RX 7700 XT:
110.2  fps
100%
Titan RTX:
109.2 111.4 ~ 110 fps
QHD 2560x1440
100%
Radeon RX 7700 XT:
73.1  fps
101%
Titan RTX:
73.2 74.5 ~ 74 fps
4K 3840x2160
100%
Radeon RX 7700 XT:
31.6  fps
117%
Titan RTX:
36.1 37.1 ~ 37 fps
low 1920x1080
100%
Radeon RX 7700 XT:
203  fps
87%
Titan RTX:
175.8  fps
med. 1920x1080
100%
Radeon RX 7700 XT:
166.3  fps
87%
Titan RTX:
144.7  fps
high 1920x1080
100%
Radeon RX 7700 XT:
136.2  fps
89%
Titan RTX:
121.8  fps
ultra 1920x1080
100%
Radeon RX 7700 XT:
133  fps
92%
Titan RTX:
122.2  fps
QHD 2560x1440
100%
Radeon RX 7700 XT:
95.7  fps
88%
Titan RTX:
83.9  fps
4K 3840x2160
100%
Radeon RX 7700 XT:
50.2  fps
89%
Titan RTX:
44.7  fps
Lies of P

Lies of P

2023
low 1920x1080
100%
Radeon RX 7700 XT:
268  fps
93%
Titan RTX:
248  fps
med. 1920x1080
100%
Radeon RX 7700 XT:
232  fps
95%
Titan RTX:
221  fps
high 1920x1080
100%
Radeon RX 7700 XT:
196.8  fps
98%
Titan RTX:
193.6  fps
ultra 1920x1080
100%
Radeon RX 7700 XT:
173.6  fps
102%
Titan RTX:
177.1  fps
QHD 2560x1440
100%
Radeon RX 7700 XT:
122.7  fps
97%
Titan RTX:
119  fps
4K 3840x2160
100%
Radeon RX 7700 XT:
63.9  fps
96%
Titan RTX:
61.2  fps
4K DLSS 3840x2160
Titan RTX:
96.3  fps
Starfield

Starfield

2023
low 1920x1080
100%
Radeon RX 7700 XT:
100.5  fps
70%
Titan RTX:
70.6  fps
med. 1920x1080
100%
Radeon RX 7700 XT:
90.4  fps
68%
Titan RTX:
61.5  fps
high 1920x1080
100%
Radeon RX 7700 XT:
73.6  fps
73%
Titan RTX:
54  fps
ultra 1920x1080
100%
Radeon RX 7700 XT:
68  fps
75%
Titan RTX:
50.7  fps
QHD 2560x1440
100%
Radeon RX 7700 XT:
55.1  fps
74%
Titan RTX:
41  fps
4K 3840x2160
100%
Radeon RX 7700 XT:
36  fps
78%
Titan RTX:
28.2  fps
low 1920x1080
100%
Radeon RX 7700 XT:
119.5  fps
100%
Titan RTX:
119.7  fps
med. 1920x1080
100%
Radeon RX 7700 XT:
118.9  fps
101%
Titan RTX:
119.6  fps
high 1920x1080
100%
Radeon RX 7700 XT:
116.8  fps
102%
Titan RTX:
119.5  fps
ultra 1920x1080
100%
Radeon RX 7700 XT:
106.4  fps
112%
Titan RTX:
119.1  fps
QHD 2560x1440
100%
Radeon RX 7700 XT:
84.3  fps
119%
Titan RTX:
100.7  fps
4K 3840x2160
100%
Radeon RX 7700 XT:
51.5  fps
117%
Titan RTX:
60.5  fps
low 1920x1080
100%
Radeon RX 7700 XT:
120.2  fps
64%
Titan RTX:
76.5  fps
high 1920x1080
100%
Radeon RX 7700 XT:
102.6  fps
64%
Titan RTX:
66.1  fps
ultra 1920x1080
100%
Radeon RX 7700 XT:
82.2  fps
65%
Titan RTX:
53.3  fps
QHD 2560x1440
100%
Radeon RX 7700 XT:
56.1  fps
67%
Titan RTX:
37.8  fps
4K 3840x2160
100%
Radeon RX 7700 XT:
29.9  fps
70%
Titan RTX:
20.9  fps
low 1920x1080
100%
Radeon RX 7700 XT:
191.6  fps
100%
Titan RTX:
190.8  fps
med. 1920x1080
100%
Radeon RX 7700 XT:
186.6  fps
99%
Titan RTX:
184.9  fps
high 1920x1080
100%
Radeon RX 7700 XT:
179  fps
98%
Titan RTX:
175.8  fps
ultra 1920x1080
100%
Radeon RX 7700 XT:
165.6  fps
95%
Titan RTX:
157.1  fps
QHD 2560x1440
100%
Radeon RX 7700 XT:
117.6  fps
92%
Titan RTX:
108.3  fps
4K 3840x2160
100%
Radeon RX 7700 XT:
63.3  fps
94%
Titan RTX:
59.6  fps
low 1920x1080
100%
Radeon RX 7700 XT:
151.3  fps
101%
Titan RTX:
152.2  fps
med. 1920x1080
100%
Radeon RX 7700 XT:
121.9  fps
108%
Titan RTX:
131.9  fps
high 1920x1080
100%
Radeon RX 7700 XT:
102.1  fps
104%
Titan RTX:
106.4  fps
ultra 1920x1080
100%
Radeon RX 7700 XT:
90  fps
104%
Titan RTX:
93.2  fps
QHD 2560x1440
100%
Radeon RX 7700 XT:
72  fps
105%
Titan RTX:
75.3  fps
4K 3840x2160
100%
Radeon RX 7700 XT:
42.5  fps
111%
Titan RTX:
47.1  fps
F1 23

F1 23

2023
low 1920x1080
100%
Radeon RX 7700 XT:
464  fps
91%
Titan RTX:
421  fps
med. 1920x1080
100%
Radeon RX 7700 XT:
418  fps
88%
Titan RTX:
368  fps
high 1920x1080
100%
Radeon RX 7700 XT:
310  fps
85%
Titan RTX:
264  fps
ultra 1920x1080
100%
Radeon RX 7700 XT:
76.5  fps
107%
Titan RTX:
81.6  fps
QHD 2560x1440
100%
Radeon RX 7700 XT:
48.7  fps
109%
Titan RTX:
52.9  fps
4K 3840x2160
100%
Radeon RX 7700 XT:
23.5  fps
112%
Titan RTX:
26.3  fps
4K DLSS 3840x2160
Titan RTX:
46.6  fps
Diablo 4

Diablo 4

2023
low 1920x1080
100%
Radeon RX 7700 XT:
363  fps
101%
Titan RTX:
368  fps
med. 1920x1080
100%
Radeon RX 7700 XT:
316  fps
101%
Titan RTX:
320  fps
high 1920x1080
100%
Radeon RX 7700 XT:
286  fps
99%
Titan RTX:
282  fps
ultra 1920x1080
100%
Radeon RX 7700 XT:
243  fps
98%
Titan RTX:
238  fps
QHD 2560x1440
100%
Radeon RX 7700 XT:
158  fps
103%
Titan RTX:
162  fps
4K 3840x2160
100%
Radeon RX 7700 XT:
71  fps
120%
Titan RTX:
85.4  fps
low 1920x1080
100%
Radeon RX 7700 XT:
129.9  fps
96%
Titan RTX:
124.1  fps
med. 1920x1080
100%
Radeon RX 7700 XT:
115.6  fps
94%
Titan RTX:
108.8  fps
high 1920x1080
100%
Radeon RX 7700 XT:
107.5  fps
94%
Titan RTX:
100.6  fps
ultra 1920x1080
100%
Radeon RX 7700 XT:
101  fps
94%
Titan RTX:
95.3  fps
QHD 2560x1440
100%
Radeon RX 7700 XT:
62.3  fps
96%
Titan RTX:
60  fps
4K 3840x2160
100%
Radeon RX 7700 XT:
30.3  fps
101%
Titan RTX:
30.6  fps
low 1920x1080
100%
Radeon RX 7700 XT:
353  fps
89%
Titan RTX:
314  fps
med. 1920x1080
100%
Radeon RX 7700 XT:
318  fps
94%
Titan RTX:
299  fps
high 1920x1080
100%
Radeon RX 7700 XT:
238  fps
94%
Titan RTX:
224  fps
ultra 1920x1080
100%
Radeon RX 7700 XT:
166.2  fps
99%
Titan RTX:
164.5  fps
QHD 2560x1440
100%
Radeon RX 7700 XT:
119.9  fps
97%
Titan RTX:
116.1  fps
4K 3840x2160
100%
Radeon RX 7700 XT:
62.7  fps
94%
Titan RTX:
58.7  fps
low 1920x1080
100%
Radeon RX 7700 XT:
154.6  fps
82%
Titan RTX:
126.3  fps
med. 1920x1080
100%
Radeon RX 7700 XT:
132.5  fps
82%
Titan RTX:
108.4  fps
high 1920x1080
100%
Radeon RX 7700 XT:
122  fps
83%
Titan RTX:
101  fps
ultra 1920x1080
100%
Radeon RX 7700 XT:
105  fps
80%
Titan RTX:
83.5  fps
QHD 2560x1440
100%
Radeon RX 7700 XT:
68  fps
86%
Titan RTX:
58.3  fps
4K 3840x2160
100%
Radeon RX 7700 XT:
29.6  fps
97%
Titan RTX:
28.7  fps
4K DLSS 3840x2160
Titan RTX:
46.2  fps
low 1920x1080
100%
Radeon RX 7700 XT:
229  fps
88%
Titan RTX:
202  fps
med. 1920x1080
100%
Radeon RX 7700 XT:
180.4  fps
78%
Titan RTX:
139.9  fps
high 1920x1080
100%
Radeon RX 7700 XT:
156.1  fps
83%
Titan RTX:
129.1  fps
ultra 1920x1080
100%
Radeon RX 7700 XT:
107.1  fps
91%
Titan RTX:
97.5  fps
QHD 2560x1440
100%
Radeon RX 7700 XT:
84.2  fps
87%
Titan RTX:
73.4  fps
4K 3840x2160
100%
Radeon RX 7700 XT:
49.2  fps
91%
Titan RTX:
44.7  fps
low 1920x1080
100%
Radeon RX 7700 XT:
300.6  fps
83%
Titan RTX:
248.7  fps
med. 1920x1080
100%
Radeon RX 7700 XT:
254  fps
84%
Titan RTX:
212.1  fps
high 1920x1080
100%
Radeon RX 7700 XT:
195.7  fps
84%
Titan RTX:
164.1  fps
ultra 1920x1080
100%
Radeon RX 7700 XT:
194.3  fps
84%
Titan RTX:
162.8  fps
QHD 2560x1440
100%
Radeon RX 7700 XT:
143.4  fps
85%
Titan RTX:
122.2  fps
4K 3840x2160
100%
Radeon RX 7700 XT:
81.3  fps
89%
Titan RTX:
72.2  fps
low 1920x1080
100%
Radeon RX 7700 XT:
118.7  fps
110%
Titan RTX:
130.8  fps
med. 1920x1080
100%
Radeon RX 7700 XT:
115.6  fps
102%
Titan RTX:
118.4  fps
high 1920x1080
100%
Radeon RX 7700 XT:
112.4  fps
101%
Titan RTX:
113  fps
ultra 1920x1080
100%
Radeon RX 7700 XT:
112.2  fps
100%
Titan RTX:
112.2  fps
QHD 2560x1440
100%
Radeon RX 7700 XT:
99.1  fps
88%
Titan RTX:
87.4  fps
4K 3840x2160
100%
Radeon RX 7700 XT:
59  fps
94%
Titan RTX:
55.7  fps
low 1920x1080
100%
Radeon RX 7700 XT:
265  fps
100%
Titan RTX:
264  fps
med. 1920x1080
100%
Radeon RX 7700 XT:
199.4  fps
99%
Titan RTX:
197.6  fps
high 1920x1080
100%
Radeon RX 7700 XT:
118.8  fps
99%
Titan RTX:
117.7  fps
ultra 1920x1080
100%
Radeon RX 7700 XT:
93.6  fps
104%
Titan RTX:
96.9  fps
QHD 2560x1440
100%
Radeon RX 7700 XT:
73.9  fps
101%
Titan RTX:
74.9  fps
4K 3840x2160
100%
Radeon RX 7700 XT:
43.8  fps
103%
Titan RTX:
45  fps
Returnal

Returnal

2023
low 1920x1080
100%
Radeon RX 7700 XT:
163  fps
87%
Titan RTX:
142  fps
med. 1920x1080
100%
Radeon RX 7700 XT:
153  fps
88%
Titan RTX:
134  fps
high 1920x1080
100%
Radeon RX 7700 XT:
137  fps
89%
Titan RTX:
122  fps
ultra 1920x1080
100%
Radeon RX 7700 XT:
115  fps
93%
Titan RTX:
107  fps
QHD 2560x1440
100%
Radeon RX 7700 XT:
87  fps
93%
Titan RTX:
81  fps
4K 3840x2160
100%
Radeon RX 7700 XT:
50  fps
100%
Titan RTX:
50  fps
low 1920x1080
100%
Radeon RX 7700 XT:
195.6  fps
85%
Titan RTX:
166.9  fps
med. 1920x1080
100%
Radeon RX 7700 XT:
161.1  fps
90%
Titan RTX:
145.2  fps
high 1920x1080
100%
Radeon RX 7700 XT:
119.3  fps
98%
Titan RTX:
116.7  fps
ultra 1920x1080
100%
Radeon RX 7700 XT:
91.4  fps
103%
Titan RTX:
94.1  fps
QHD 2560x1440
100%
Radeon RX 7700 XT:
66.9  fps
103%
Titan RTX:
69.1  fps
4K 3840x2160
100%
Radeon RX 7700 XT:
35.5  fps
106%
Titan RTX:
37.7  fps
low 1920x1080
100%
Radeon RX 7700 XT:
133.4  fps
med. 1920x1080
100%
Radeon RX 7700 XT:
129.4  fps
98%
Titan RTX:
126.8  fps
high 1920x1080
100%
Radeon RX 7700 XT:
110.9  fps
112%
Titan RTX:
111.3 136.2 ~ 124 fps
ultra 1920x1080
100%
Radeon RX 7700 XT:
111.8  fps
100%
Titan RTX:
111.3  fps
QHD 2560x1440
100%
Radeon RX 7700 XT:
75  fps
100%
Titan RTX:
74.7  fps
4K 3840x2160
100%
Radeon RX 7700 XT:
36.2  fps
109%
Titan RTX:
39.3  fps
low 1920x1080
100%
Radeon RX 7700 XT:
307  fps
97%
Titan RTX:
298  fps
med. 1920x1080
100%
Radeon RX 7700 XT:
264  fps
93%
Titan RTX:
245  fps
high 1920x1080
100%
Radeon RX 7700 XT:
233  fps
89%
Titan RTX:
208  fps
ultra 1920x1080
100%
Radeon RX 7700 XT:
198  fps
89%
Titan RTX:
175.3  fps
QHD 2560x1440
100%
Radeon RX 7700 XT:
122.6  fps
102%
Titan RTX:
125.2  fps
4K 3840x2160
100%
Radeon RX 7700 XT:
59.3  fps
122%
Titan RTX:
72.6  fps
low 1920x1080
100%
Radeon RX 7700 XT:
350  fps
97%
Titan RTX:
339  fps
med. 1920x1080
100%
Radeon RX 7700 XT:
263  fps
89%
Titan RTX:
235  fps
high 1920x1080
100%
Radeon RX 7700 XT:
194.1  fps
89%
Titan RTX:
172.6  fps
ultra 1920x1080
100%
Radeon RX 7700 XT:
150.3  fps
91%
Titan RTX:
136.6  fps
QHD 2560x1440
100%
Radeon RX 7700 XT:
89.6  fps
97%
Titan RTX:
87.1  fps
4K 3840x2160
100%
Radeon RX 7700 XT:
38  fps
104%
Titan RTX:
39.6  fps
low 1920x1080
100%
Radeon RX 7700 XT:
239.8  fps
81%
Titan RTX:
193.3  fps
med. 1920x1080
100%
Radeon RX 7700 XT:
194.1  fps
79%
Titan RTX:
153.9  fps
high 1920x1080
100%
Radeon RX 7700 XT:
177.1  fps
57%
Titan RTX:
101.5  fps
ultra 1920x1080
100%
Radeon RX 7700 XT:
115.3  fps
88%
Titan RTX:
101.2  fps
QHD 2560x1440
100%
Radeon RX 7700 XT:
90.1  fps
83%
Titan RTX:
74.7  fps
4K 3840x2160
100%
Radeon RX 7700 XT:
57.8  fps
79%
Titan RTX:
45.7  fps
low 1920x1080
100%
Radeon RX 7700 XT:
205  fps
89%
Titan RTX:
182.1  fps
med. 1920x1080
100%
Radeon RX 7700 XT:
183.3  fps
93%
Titan RTX:
170.1  fps
high 1920x1080
100%
Radeon RX 7700 XT:
144.3  fps
100%
Titan RTX:
143.8  fps
ultra 1920x1080
100%
Radeon RX 7700 XT:
144.1  fps
88%
Titan RTX:
126.6  fps
QHD 2560x1440
100%
Radeon RX 7700 XT:
111.7  fps
88%
Titan RTX:
98  fps
4K 3840x2160
100%
Radeon RX 7700 XT:
64.2  fps
90%
Titan RTX:
57.5  fps
low 1920x1080
100%
Radeon RX 7700 XT:
154.5  fps
102%
Titan RTX:
157.5  fps
med. 1920x1080
100%
Radeon RX 7700 XT:
144.8  fps
99%
Titan RTX:
143.6  fps
high 1920x1080
100%
Radeon RX 7700 XT:
130.2  fps
107%
Titan RTX:
139.7  fps
ultra 1920x1080
100%
Radeon RX 7700 XT:
121.1  fps
112%
Titan RTX:
136.1  fps
QHD 2560x1440
100%
Radeon RX 7700 XT:
100.6  fps
102%
Titan RTX:
102.5  fps
4K 3840x2160
100%
Radeon RX 7700 XT:
58.1  fps
105%
Titan RTX:
61  fps
low 1920x1080
Titan RTX:
166  fps
med. 1920x1080
Titan RTX:
134  fps
high 1920x1080
Titan RTX:
106  fps
ultra 1920x1080
Titan RTX:
105  fps
QHD 2560x1440
Titan RTX:
77  fps
4K 3840x2160
Titan RTX:
47  fps
4K DLSS 3840x2160
Titan RTX:
66  fps
low 1920x1080
100%
Radeon RX 7700 XT:
102.2  fps
101%
Titan RTX:
102.8  fps
med. 1920x1080
100%
Radeon RX 7700 XT:
98.8  fps
100%
Titan RTX:
98.7  fps
high 1920x1080
100%
Radeon RX 7700 XT:
92.6  fps
105%
Titan RTX:
96.8  fps
ultra 1920x1080
100%
Radeon RX 7700 XT:
87  fps
105%
Titan RTX:
91.3  fps
QHD 2560x1440
100%
Radeon RX 7700 XT:
70.1  fps
106%
Titan RTX:
74  fps
4K 3840x2160
100%
Radeon RX 7700 XT:
42.1  fps
110%
Titan RTX:
46.2  fps
low 1920x1080
100%
Radeon RX 7700 XT:
160.3  fps
98%
Titan RTX:
157  fps
med. 1920x1080
100%
Radeon RX 7700 XT:
121.9  fps
100%
Titan RTX:
122  fps
high 1920x1080
100%
Radeon RX 7700 XT:
92.8  fps
99%
Titan RTX:
92.1  fps
ultra 1920x1080
100%
Radeon RX 7700 XT:
70.1  fps
100%
Titan RTX:
70  fps
QHD 2560x1440
100%
Radeon RX 7700 XT:
52.6  fps
97%
Titan RTX:
51.1  fps
4K 3840x2160
100%
Radeon RX 7700 XT:
30.3  fps
98%
Titan RTX:
29.6  fps
FIFA 23

FIFA 23

2022
low 1920x1080
Titan RTX:
217  fps
med. 1920x1080
Titan RTX:
221  fps
high 1920x1080
Titan RTX:
215  fps
ultra 1920x1080
Titan RTX:
218  fps
QHD 2560x1440
Titan RTX:
183.5  fps
4K 3840x2160
Titan RTX:
111.6  fps
low 1920x1080
100%
Radeon RX 7700 XT:
234  fps
94%
Titan RTX:
217 221 ~ 219 fps
med. 1920x1080
100%
Radeon RX 7700 XT:
172.9  fps
98%
Titan RTX:
168.2 169.9 ~ 169 fps
high 1920x1080
100%
Radeon RX 7700 XT:
136.9  fps
102%
Titan RTX:
138.4 140 ~ 139 fps
ultra 1920x1080
100%
Radeon RX 7700 XT:
106.3  fps
103%
Titan RTX:
109.4 109.4 ~ 109 fps
QHD 2560x1440
100%
Radeon RX 7700 XT:
73.6  fps
103%
Titan RTX:
75.3 75.7 ~ 76 fps
4K 3840x2160
100%
Radeon RX 7700 XT:
37.8  fps
108%
Titan RTX:
40.6 41 ~ 41 fps
F1 22

F1 22

2022
low 1920x1080
100%
Radeon RX 7700 XT:
426  fps
86%
Titan RTX:
332 398 ~ 365 fps
med. 1920x1080
100%
Radeon RX 7700 XT:
400  fps
87%
Titan RTX:
326 369 ~ 348 fps
high 1920x1080
100%
Radeon RX 7700 XT:
315  fps
86%
Titan RTX:
256 285 ~ 271 fps
ultra 1920x1080
100%
Radeon RX 7700 XT:
92.3  fps
96%
Titan RTX:
86 91.5 ~ 89 fps
QHD 2560x1440
100%
Radeon RX 7700 XT:
59.9  fps
97%
Titan RTX:
56.3 58.9 ~ 58 fps
4K 3840x2160
100%
Radeon RX 7700 XT:
29.8  fps
97%
Titan RTX:
28.2 29.3 ~ 29 fps
low 1920x1080
Titan RTX:
391  fps
med. 1920x1080
Titan RTX:
267  fps
high 1920x1080
Titan RTX:
252  fps
ultra 1920x1080
Titan RTX:
244  fps
QHD 2560x1440
Titan RTX:
173.2  fps
4K 3840x2160
Titan RTX:
93.6  fps
low 1920x1080
100%
Radeon RX 7700 XT:
244  fps
89%
Titan RTX:
205 228 ~ 217 fps
med. 1920x1080
100%
Radeon RX 7700 XT:
235  fps
86%
Titan RTX:
196.8 210 ~ 203 fps
high 1920x1080
100%
Radeon RX 7700 XT:
233  fps
88%
Titan RTX:
203 207 ~ 205 fps
ultra 1920x1080
100%
Radeon RX 7700 XT:
225  fps
91%
Titan RTX:
202 205 ~ 204 fps
QHD 2560x1440
100%
Radeon RX 7700 XT:
139.9  fps
99%
Titan RTX:
135.9 141 ~ 138 fps
4K 3840x2160
100%
Radeon RX 7700 XT:
65.7  fps
107%
Titan RTX:
67.6 73.3 ~ 70 fps
low 1920x1080
100%
Radeon RX 7700 XT:
366  fps
69%
Titan RTX:
245 249 269 ~ 254 fps
med. 1920x1080
100%
Radeon RX 7700 XT:
281  fps
74%
Titan RTX:
201 208 217 ~ 209 fps
high 1920x1080
100%
Radeon RX 7700 XT:
170.6  fps
89%
Titan RTX:
150.8 151.3 152.5 ~ 152 fps
ultra 1920x1080
100%
Radeon RX 7700 XT:
133.2  fps
92%
Titan RTX:
121.7 122.9 124.3 ~ 123 fps
QHD 2560x1440
100%
Radeon RX 7700 XT:
89.2  fps
100%
Titan RTX:
86.5 86.7 92.4 ~ 89 fps
4K 3840x2160
100%
Radeon RX 7700 XT:
46  fps
104%
Titan RTX:
46.8 48.1 50.4 ~ 48 fps
low 1920x1080
100%
Radeon RX 7700 XT:
193  fps
41%
Titan RTX:
78.9  fps
med. 1920x1080
100%
Radeon RX 7700 XT:
158.2  fps
50%
Titan RTX:
78.7  fps
high 1920x1080
100%
Radeon RX 7700 XT:
132  fps
60%
Titan RTX:
78.6  fps
ultra 1920x1080
100%
Radeon RX 7700 XT:
122.1  fps
64%
Titan RTX:
78.3  fps
QHD 2560x1440
100%
Radeon RX 7700 XT:
80.2  fps
83%
Titan RTX:
66.2  fps
4K 3840x2160
100%
Radeon RX 7700 XT:
36  fps
91%
Titan RTX:
32.8  fps
Elex 2

Elex 2

2022
low 1920x1080
Titan RTX:
111  fps
med. 1920x1080
Titan RTX:
105  fps
high 1920x1080
Titan RTX:
98  fps
ultra 1920x1080
Titan RTX:
95.4  fps
QHD 2560x1440
Titan RTX:
81.2  fps
4K 3840x2160
Titan RTX:
47.7  fps
low 1920x1080
100%
Radeon RX 7700 XT:
263  fps
106%
Titan RTX:
215.9 260.1 360 ~ 279 fps
med. 1920x1080
100%
Radeon RX 7700 XT:
226  fps
106%
Titan RTX:
195.2 217.9 304 ~ 239 fps
high 1920x1080
100%
Radeon RX 7700 XT:
194.9  fps
103%
Titan RTX:
172.8 184.8 243 ~ 200 fps
ultra 1920x1080
100%
Radeon RX 7700 XT:
173.1  fps
88%
Titan RTX:
132.5 142.7 181.7 ~ 152 fps
QHD 2560x1440
100%
Radeon RX 7700 XT:
153.8  fps
83%
Titan RTX:
112.2 122.6 147.7 ~ 128 fps
4K 3840x2160
100%
Radeon RX 7700 XT:
104.2  fps
83%
Titan RTX:
78.6 86.5 96.8 ~ 87 fps
low 1920x1080
Titan RTX:
59.9  fps
med. 1920x1080
Titan RTX:
59.9  fps
high 1920x1080
Titan RTX:
59.7  fps
ultra 1920x1080
Titan RTX:
59.9  fps
QHD 2560x1440
Titan RTX:
59.9  fps
4K 3840x2160
Titan RTX:
59.6  fps
low 1920x1080
Titan RTX:
169  fps
med. 1920x1080
Titan RTX:
110  fps
high 1920x1080
Titan RTX:
93.6  fps
QHD 2560x1440
Titan RTX:
66.5  fps
4K 3840x2160
Titan RTX:
37.1  fps
low 1920x1080
Titan RTX:
264  fps
med. 1920x1080
Titan RTX:
225  fps
high 1920x1080
Titan RTX:
223  fps
ultra 1920x1080
Titan RTX:
179  fps
QHD 2560x1440
Titan RTX:
130  fps
4K 3840x2160
Titan RTX:
70  fps
low 1920x1080
100%
Radeon RX 7700 XT:
191.9  fps
94%
Titan RTX:
174 182.2 185.8 ~ 181 fps
med. 1920x1080
100%
Radeon RX 7700 XT:
188.1  fps
82%
Titan RTX:
149 155 159.6 ~ 155 fps
high 1920x1080
100%
Radeon RX 7700 XT:
148.7  fps
87%
Titan RTX:
124 129 132.8 ~ 129 fps
ultra 1920x1080
100%
Radeon RX 7700 XT:
102  fps
94%
Titan RTX:
89 95.7 101.9 ~ 96 fps
QHD 2560x1440
100%
Radeon RX 7700 XT:
85.3  fps
94%
Titan RTX:
72.8 82.7 85.9 ~ 80 fps
4K 3840x2160
100%
Radeon RX 7700 XT:
54.2  fps
100%
Titan RTX:
48.9 55.2 56.5 ~ 54 fps
med. 1920x1080
Titan RTX:
144  fps
high 1920x1080
Titan RTX:
125  fps
ultra 1920x1080
Titan RTX:
119  fps
QHD 2560x1440
Titan RTX:
95.5  fps
4K 3840x2160
Titan RTX:
68.8  fps
low 1280x720
Titan RTX:
279  fps
med. 1920x1080
Titan RTX:
221  fps
high 1920x1080
Titan RTX:
186  fps
ultra 1920x1080
Titan RTX:
164  fps
QHD 2560x1440
Titan RTX:
163  fps
4K 3840x2160
Titan RTX:
122  fps
low 1280x720
Titan RTX:
99.3  fps
med. 1920x1080
Titan RTX:
139  fps
high 1920x1080
Titan RTX:
129  fps
ultra 1920x1080
Titan RTX:
117  fps
QHD 2560x1440
Titan RTX:
93.6  fps
4K 3840x2160
Titan RTX:
60.2  fps
low 1280x720
Titan RTX:
237 298 ~ 268 fps
med. 1920x1080
Titan RTX:
161 175 ~ 168 fps
high 1920x1080
Titan RTX:
148 157 ~ 153 fps
ultra 1920x1080
Titan RTX:
96 100 ~ 98 fps
QHD 2560x1440
Titan RTX:
84 87 ~ 86 fps
4K 3840x2160
Titan RTX:
62 65 ~ 64 fps
low 1280x720
Titan RTX:
113  fps
med. 1920x1080
Titan RTX:
153  fps
high 1920x1080
Titan RTX:
144  fps
ultra 1920x1080
Titan RTX:
133  fps
QHD 2560x1440
Titan RTX:
100  fps
4K 3840x2160
Titan RTX:
59.6  fps
low 1280x720
Titan RTX:
221  fps
med. 1920x1080
Titan RTX:
179  fps
high 1920x1080
Titan RTX:
152  fps
ultra 1920x1080
Titan RTX:
143  fps
QHD 2560x1440
Titan RTX:
109  fps
4K 3840x2160
Titan RTX:
65  fps
low 1280x720
100%
Radeon RX 7700 XT:
180  fps
96%
Titan RTX:
135 210 ~ 173 fps
med. 1920x1080
100%
Radeon RX 7700 XT:
177  fps
97%
Titan RTX:
134 208 ~ 171 fps
high 1920x1080
100%
Radeon RX 7700 XT:
175  fps
98%
Titan RTX:
134 207 ~ 171 fps
ultra 1920x1080
100%
Radeon RX 7700 XT:
164  fps
102%
Titan RTX:
133 203 ~ 168 fps
QHD 2560x1440
100%
Radeon RX 7700 XT:
125  fps
112%
Titan RTX:
131 149 ~ 140 fps
4K 3840x2160
100%
Radeon RX 7700 XT:
72  fps
114%
Titan RTX:
82 82 ~ 82 fps
med. 1920x1080
Titan RTX:
294  fps
high 1920x1080
Titan RTX:
270  fps
ultra 1920x1080
Titan RTX:
255  fps
QHD 2560x1440
Titan RTX:
182  fps
4K 3840x2160
Titan RTX:
101  fps
Far Cry 6

Far Cry 6

2021
low 1280x720
100%
Radeon RX 7700 XT:
227  fps
81%
Titan RTX:
143 164 173 185 211 227 ~ 184 fps
med. 1920x1080
100%
Radeon RX 7700 XT:
196.9  fps
77%
Titan RTX:
106 136 150 157 178.9 179.4 ~ 151 fps
high 1920x1080
100%
Radeon RX 7700 XT:
178.5  fps
76%
Titan RTX:
95.8 129 133 142 155.9 156.5 ~ 135 fps
ultra 1920x1080
100%
Radeon RX 7700 XT:
161.8  fps
78%
Titan RTX:
94.7 124 129 134 136.8 138.9 ~ 126 fps
QHD 2560x1440
100%
Radeon RX 7700 XT:
121.9  fps
84%
Titan RTX:
80.9 105 105.3 106.6 107 109 ~ 102 fps
4K 3840x2160
100%
Radeon RX 7700 XT:
63.1  fps
98%
Titan RTX:
52.8 62.4 63.6 64 64 64.2 ~ 62 fps
med. 1920x1080
Titan RTX:
93.1  fps
high 1920x1080
Titan RTX:
88.3  fps
QHD 2560x1440
Titan RTX:
88.4  fps
4K 3840x2160
Titan RTX:
88.5  fps
New World

New World

2021
low 1280x720
Titan RTX:
180  fps
med. 1920x1080
Titan RTX:
139  fps
high 1920x1080
Titan RTX:
131  fps
ultra 1920x1080
Titan RTX:
123  fps
QHD 2560x1440
Titan RTX:
101  fps
4K 3840x2160
Titan RTX:
54.5  fps
Deathloop

Deathloop

2021
low 1280x720
Titan RTX:
128  fps
med. 1920x1080
Titan RTX:
125  fps
high 1920x1080
Titan RTX:
124  fps
ultra 1920x1080
Titan RTX:
119  fps
QHD 2560x1440
Titan RTX:
91.6  fps
4K 3840x2160
Titan RTX:
51.8  fps
F1 2021

F1 2021

2021
low 1280x720
100%
Radeon RX 7700 XT:
645  fps
81%
Titan RTX:
407 451 466 491 638 681 ~ 522 fps
med. 1920x1080
100%
Radeon RX 7700 XT:
537  fps
75%
Titan RTX:
367 383 388 409 425 443 ~ 403 fps
high 1920x1080
100%
Radeon RX 7700 XT:
397  fps
83%
Titan RTX:
302 307 331 337 343 361 ~ 330 fps
ultra 1920x1080
100%
Radeon RX 7700 XT:
172.6  fps
96%
Titan RTX:
160 160 165 168.7 171.1 172 ~ 166 fps
QHD 2560x1440
100%
Radeon RX 7700 XT:
129.5  fps
97%
Titan RTX:
121 122 126 126.6 127.5 129 ~ 125 fps
4K 3840x2160
100%
Radeon RX 7700 XT:
72.6  fps
101%
Titan RTX:
71.9 72.6 73 73.2 74.3 74.5 ~ 73 fps
low 1280x720
Titan RTX:
144  fps
med. 1920x1080
Titan RTX:
144  fps
high 1920x1080
Titan RTX:
144  fps
QHD 2560x1440
Titan RTX:
144  fps
4K 3840x2160
Titan RTX:
144  fps
Days Gone

Days Gone

2021
low 1280x720
Titan RTX:
190  fps
med. 1920x1080
Titan RTX:
181  fps
high 1920x1080
Titan RTX:
174  fps
ultra 1920x1080
Titan RTX:
141  fps
QHD 2560x1440
Titan RTX:
108  fps
4K 3840x2160
Titan RTX:
64.9  fps
low 1280x720
Titan RTX:
106  fps
ultra 1920x1080
Titan RTX:
113  fps
QHD 2560x1440
Titan RTX:
107  fps
4K 3840x2160
Titan RTX:
106  fps
low 1280x720
Titan RTX:
304  fps
med. 1920x1080
Titan RTX:
264  fps
high 1920x1080
Titan RTX:
241  fps
ultra 1920x1080
Titan RTX:
212  fps
QHD 2560x1440
Titan RTX:
142  fps
4K 3840x2160
Titan RTX:
74.2  fps
Outriders

Outriders

2021
low 1280x720
Titan RTX:
136  fps
med. 1920x1080
Titan RTX:
162  fps
high 1920x1080
Titan RTX:
158  fps
ultra 1920x1080
Titan RTX:
156  fps
QHD 2560x1440
Titan RTX:
119  fps
4K 3840x2160
Titan RTX:
64  fps
Hitman 3

Hitman 3

2021
low 1280x720
Titan RTX:
271  fps
med. 1920x1080
Titan RTX:
222  fps
high 1920x1080
Titan RTX:
210  fps
ultra 1920x1080
Titan RTX:
202  fps
QHD 2560x1440
Titan RTX:
145  fps
4K 3840x2160
Titan RTX:
82  fps
low 1280x720
Titan RTX:
109  fps
med. 1920x1080
Titan RTX:
103  fps
high 1920x1080
Titan RTX:
93.2  fps
ultra 1920x1080
Titan RTX:
82.3  fps
QHD 2560x1440
Titan RTX:
58.4  fps
4K 3840x2160
Titan RTX:
30.9  fps
low 1280x720
Titan RTX:
136  fps
med. 1920x1080
Titan RTX:
106  fps
high 1920x1080
Titan RTX:
93  fps
ultra 1920x1080
Titan RTX:
71  fps
QHD 2560x1440
Titan RTX:
64  fps
4K 3840x2160
Titan RTX:
48  fps
low 1280x720
Titan RTX:
119  fps
med. 1920x1080
Titan RTX:
117  fps
high 1920x1080
Titan RTX:
116  fps
ultra 1920x1080
Titan RTX:
111  fps
QHD 2560x1440
Titan RTX:
100  fps
4K 3840x2160
Titan RTX:
55.2  fps
low 1280x720
Titan RTX:
254  fps
med. 1920x1080
Titan RTX:
238  fps
high 1920x1080
Titan RTX:
162  fps
ultra 1920x1080
Titan RTX:
144  fps
QHD 2560x1440
Titan RTX:
87.6  fps
4K 3840x2160
Titan RTX:
52.9  fps
low 1280x720
100%
Radeon RX 7700 XT:
250  fps
55%
Titan RTX:
137  fps
med. 1920x1080
100%
Radeon RX 7700 XT:
180  fps
58%
Titan RTX:
104  fps
high 1920x1080
100%
Radeon RX 7700 XT:
149  fps
59%
Titan RTX:
88  fps
ultra 1920x1080
100%
Radeon RX 7700 XT:
132  fps
61%
Titan RTX:
80  fps
QHD 2560x1440
100%
Radeon RX 7700 XT:
101  fps
65%
Titan RTX:
66  fps
4K 3840x2160
100%
Radeon RX 7700 XT:
59  fps
73%
Titan RTX:
43  fps
Dirt 5

Dirt 5

2020
low 1280x720
100%
Radeon RX 7700 XT:
167.9  fps
111%
Titan RTX:
187  fps
med. 1920x1080
100%
Radeon RX 7700 XT:
125.7  fps
102%
Titan RTX:
128  fps
high 1920x1080
100%
Radeon RX 7700 XT:
98.6  fps
108%
Titan RTX:
106  fps
ultra 1920x1080
100%
Radeon RX 7700 XT:
85.9  fps
112%
Titan RTX:
95.9  fps
QHD 2560x1440
100%
Radeon RX 7700 XT:
83.2  fps
96%
Titan RTX:
79.5  fps
4K 3840x2160
100%
Radeon RX 7700 XT:
81.6  fps
70%
Titan RTX:
57  fps
low 1280x720
Titan RTX:
113  fps
med. 1920x1080
Titan RTX:
112  fps
high 1920x1080
Titan RTX:
97.4  fps
ultra 1920x1080
Titan RTX:
85.5  fps
QHD 2560x1440
Titan RTX:
69.9  fps
4K 3840x2160
Titan RTX:
43.4  fps
FIFA 21

FIFA 21

2020
low 1280x720
Titan RTX:
215  fps
med. 1920x1080
Titan RTX:
215  fps
high 1920x1080
Titan RTX:
204  fps
ultra 1920x1080
Titan RTX:
203  fps
QHD 2560x1440
Titan RTX:
205  fps
4K 3840x2160
Titan RTX:
203  fps
low 1280x720
Titan RTX:
440  fps
med. 1920x1080
Titan RTX:
367  fps
high 1920x1080
Titan RTX:
334  fps
ultra 1920x1080
Titan RTX:
315  fps
QHD 2560x1440
Titan RTX:
232  fps
4K 3840x2160
Titan RTX:
144  fps
low 1280x720
Titan RTX:
149.8  fps
med. 1920x1080
Titan RTX:
133  fps
high 1920x1080
Titan RTX:
123.7  fps
QHD 2560x1440
Titan RTX:
109  fps
4K 3840x2160
Titan RTX:
63.4  fps
low 1280x720
Titan RTX:
138.2  fps
med. 1920x1080
Titan RTX:
108.1  fps
high 1920x1080
Titan RTX:
106.4  fps
ultra 1920x1080
Titan RTX:
99.1  fps
QHD 2560x1440
Titan RTX:
92.4  fps
4K 3840x2160
Titan RTX:
71.2  fps
low 1280x720
Titan RTX:
273  fps
med. 1920x1080
Titan RTX:
74.5  fps
high 1920x1080
Titan RTX:
212  fps
ultra 1920x1080
Titan RTX:
115  fps
QHD 2560x1440
Titan RTX:
90.9  fps
4K 3840x2160
Titan RTX:
48.9  fps
low 1280x720
Titan RTX:
85  fps
med. 1920x1080
Titan RTX:
75  fps
high 1920x1080
Titan RTX:
62  fps
ultra 1920x1080
Titan RTX:
51  fps
QHD 2560x1440
Titan RTX:
48  fps
4K 3840x2160
Titan RTX:
32  fps
low 1280x720
GeForce RTX 2080 Super Max-Q:
148  fps
Titan RTX:
158  fps
med. 1920x1080
GeForce RTX 2080 Super Max-Q:
109  fps
Titan RTX:
142  fps
high 1920x1080
GeForce RTX 2080 Super Max-Q:
90  fps
Titan RTX:
126  fps
ultra 1920x1080
GeForce RTX 2080 Super Max-Q:
74 76 ~ 75 fps
Titan RTX:
109  fps
QHD 2560x1440
Titan RTX:
90  fps
4K 3840x2160
Titan RTX:
54  fps
low 1280x720
100%
Radeon RX 7700 XT:
238  fps
64%
GeForce RTX 2080 Super Max-Q:
139.8 166.1 ~ 153 fps
92%
Titan RTX:
196 239 ~ 218 fps
med. 1920x1080
100%
Radeon RX 7700 XT:
217  fps
56%
GeForce RTX 2080 Super Max-Q:
118.7 123.5 ~ 121 fps
92%
Titan RTX:
181 217 ~ 199 fps
high 1920x1080
100%
Radeon RX 7700 XT:
198.9  fps
56%
GeForce RTX 2080 Super Max-Q:
108.6 114.5 ~ 112 fps
94%
Titan RTX:
172 201 ~ 187 fps
ultra 1920x1080
100%
Radeon RX 7700 XT:
191.9  fps
57%
GeForce RTX 2080 Super Max-Q:
104.5 112.8 ~ 109 fps
95%
Titan RTX:
167 196.7 ~ 182 fps
QHD 2560x1440
100%
Radeon RX 7700 XT:
145.6  fps
93%
Titan RTX:
125 146.4 ~ 136 fps
4K 3840x2160
100%
Radeon RX 7700 XT:
81.6  fps
97%
Titan RTX:
73.7 85.1 ~ 79 fps
F1 2020

F1 2020

2020
low 1280x720
100%
Radeon RX 7700 XT:
575  fps
43%
GeForce RTX 2080 Super Max-Q:
219 253 268 ~ 247 fps
73%
Titan RTX:
305 340 405 405 432 498 557 ~ 420 fps
med. 1920x1080
100%
Radeon RX 7700 XT:
391  fps
45%
GeForce RTX 2080 Super Max-Q:
167 174 184 ~ 175 fps
85%
Titan RTX:
255 291 332 332 343 369 406 ~ 333 fps
high 1920x1080
100%
Radeon RX 7700 XT:
322  fps
48%
GeForce RTX 2080 Super Max-Q:
149 150 161 ~ 153 fps
93%
Titan RTX:
251 288 303 307 307 309 331 ~ 299 fps
ultra 1920x1080
100%
Radeon RX 7700 XT:
216  fps
54%
GeForce RTX 2080 Super Max-Q:
102 115 118 119 126 ~ 116 fps
100%
Titan RTX:
194 213 216 218 219 219 231 ~ 216 fps
QHD 2560x1440
100%
Radeon RX 7700 XT:
170.6  fps
52%
GeForce RTX 2080 Super Max-Q:
89  fps
98%
Titan RTX:
153 167 168 168.4 172 175.8 ~ 167 fps
4K 3840x2160
100%
Radeon RX 7700 XT:
102.5  fps
50%
GeForce RTX 2080 Super Max-Q:
51  fps
100%
Titan RTX:
97.4 101 101.3 103 103 103.4 ~ 102 fps
Valorant

Valorant

2020
low 1280x720
Titan RTX:
377  fps
med. 1920x1080
Titan RTX:
348  fps
high 1920x1080
Titan RTX:
336  fps
QHD 2560x1440
Titan RTX:
307  fps
4K 3840x2160
Titan RTX:
300  fps
low 1280x720
GeForce RTX 2080 Super Max-Q:
188.8 210.4 267.4 ~ 222 fps
Titan RTX:
325.9  fps
med. 1920x1080
GeForce RTX 2080 Super Max-Q:
161.2 171.6 184.5 ~ 172 fps
Titan RTX:
197.7  fps
high 1920x1080
GeForce RTX 2080 Super Max-Q:
110.6 114 122.2 126.2 ~ 118 fps
Titan RTX:
146.9  fps
ultra 1920x1080
GeForce RTX 2080 Super Max-Q:
78.4 82.9 84.3 89.7 92.7 ~ 86 fps
Titan RTX:
141.2  fps
QHD 2560x1440
GeForce RTX 2080 Super Max-Q:
54 57.9 ~ 56 fps
Titan RTX:
105.3  fps
4K 3840x2160
GeForce RTX 2080 Super Max-Q:
28.1 30.3 ~ 29 fps
Titan RTX:
56.3  fps
low 1280x720
GeForce RTX 2080 Super Max-Q:
205 212.2 249 256 ~ 231 fps
Titan RTX:
242  fps
med. 1920x1080
GeForce RTX 2080 Super Max-Q:
164 165.1 167.6 168.3 176.6 ~ 168 fps
Titan RTX:
246  fps
high 1920x1080
GeForce RTX 2080 Super Max-Q:
147.1 147.9 150 154 156.7 ~ 151 fps
Titan RTX:
239  fps
ultra 1920x1080
GeForce RTX 2080 Super Max-Q:
140 144.4 147 152.1 155.1 163.7 165.2 177.7 ~ 156 fps
Titan RTX:
236  fps
QHD 2560x1440
GeForce RTX 2080 Super Max-Q:
108 116.7 131.2 ~ 119 fps
Titan RTX:
192  fps
4K 3840x2160
GeForce RTX 2080 Super Max-Q:
58 64 73.3 ~ 65 fps
Titan RTX:
105  fps
low 1280x720
GeForce RTX 2080 Super Max-Q:
207.4  fps
Titan RTX:
235  fps
med. 1920x1080
GeForce RTX 2080 Super Max-Q:
119 121.4 ~ 120 fps
Titan RTX:
194  fps
high 1920x1080
GeForce RTX 2080 Super Max-Q:
101 102 ~ 102 fps
Titan RTX:
171  fps
QHD 2560x1440
GeForce RTX 2080 Super Max-Q:
68.8  fps
Titan RTX:
124  fps
4K 3840x2160
GeForce RTX 2080 Super Max-Q:
32.4  fps
Titan RTX:
61.8  fps
low 1280x720
GeForce RTX 2080 Super Max-Q:
121  fps
Titan RTX:
121  fps
med. 1920x1080
GeForce RTX 2080 Super Max-Q:
121 121 ~ 121 fps
Titan RTX:
121  fps
high 1920x1080
GeForce RTX 2080 Super Max-Q:
120 121 ~ 121 fps
Titan RTX:
120  fps
ultra 1920x1080
GeForce RTX 2080 Super Max-Q:
119 120 ~ 120 fps
Titan RTX:
119  fps
QHD 2560x1440
GeForce RTX 2080 Super Max-Q:
83.1  fps
Titan RTX:
117  fps
4K 3840x2160
GeForce RTX 2080 Super Max-Q:
39.7  fps
Titan RTX:
81.7  fps
low 1280x720
GeForce RTX 2080 Super Max-Q:
113.3 131.4 138.4 ~ 128 fps
Titan RTX:
142  fps
med. 1920x1080
GeForce RTX 2080 Super Max-Q:
96.5 98 99.7 101.5 ~ 99 fps
Titan RTX:
133  fps
high 1920x1080
GeForce RTX 2080 Super Max-Q:
62.4 62.7 67.4 68.3 69 ~ 66 fps
Titan RTX:
110  fps
ultra 1920x1080
GeForce RTX 2080 Super Max-Q:
40.6 41 43.7 44.9 45 ~ 43 fps
Titan RTX:
76  fps
QHD 2560x1440
GeForce RTX 2080 Super Max-Q:
35 36.2 37 ~ 36 fps
Titan RTX:
63  fps
4K 3840x2160
GeForce RTX 2080 Super Max-Q:
21.5 23.5 23.8 ~ 23 fps
Titan RTX:
41  fps
med. 1920x1080
GeForce RTX 2080 Super Max-Q:
95.7 99.5 113.7 ~ 103 fps
Titan RTX:
126 127 ~ 127 fps
high 1920x1080
GeForce RTX 2080 Super Max-Q:
93.1 94.1 102 103.7 ~ 98 fps
Titan RTX:
124 127 ~ 126 fps
ultra 1920x1080
GeForce RTX 2080 Super Max-Q:
88.7 89.9 95.2 97.5 ~ 93 fps
Titan RTX:
122 123 ~ 123 fps
QHD 2560x1440
GeForce RTX 2080 Super Max-Q:
72.2 76.2 ~ 74 fps
Titan RTX:
118 119 ~ 119 fps
4K 3840x2160
GeForce RTX 2080 Super Max-Q:
36.8 42.7 ~ 40 fps
Titan RTX:
73 74 ~ 74 fps
low 1280x720
GeForce RTX 2080 Super Max-Q:
101.9  fps
Titan RTX:
114 133 ~ 124 fps
med. 1920x1080
GeForce RTX 2080 Super Max-Q:
92 93 ~ 93 fps
Titan RTX:
109 128 ~ 119 fps
high 1920x1080
GeForce RTX 2080 Super Max-Q:
84 86.6 ~ 85 fps
Titan RTX:
102 118 ~ 110 fps
ultra 1920x1080
GeForce RTX 2080 Super Max-Q:
76.9 83.3 ~ 80 fps
Titan RTX:
93 107 ~ 100 fps
QHD 2560x1440
GeForce RTX 2080 Super Max-Q:
66.9  fps
Titan RTX:
91 105 ~ 98 fps
4K 3840x2160
GeForce RTX 2080 Super Max-Q:
40.9  fps
Titan RTX:
68 68 ~ 68 fps
low 1280x720
GeForce RTX 2080 Super Max-Q:
165.5 172.3 ~ 169 fps
Titan RTX:
207 241 ~ 224 fps
med. 1920x1080
GeForce RTX 2080 Super Max-Q:
114.1 123.6 134 ~ 124 fps
Titan RTX:
205 220 ~ 213 fps
high 1920x1080
GeForce RTX 2080 Super Max-Q:
96.4 104.3 114 129 ~ 111 fps
Titan RTX:
189 190 ~ 190 fps
ultra 1920x1080
GeForce RTX 2080 Super Max-Q:
91.2 91.8 93.8 107 ~ 96 fps
Titan RTX:
169 170 ~ 170 fps
QHD 2560x1440
GeForce RTX 2080 Super Max-Q:
64.7 67.3 78.9 ~ 70 fps
Titan RTX:
129 132 ~ 131 fps
4K 3840x2160
GeForce RTX 2080 Super Max-Q:
36.3 36.8 44.5 ~ 39 fps
Titan RTX:
78 80 ~ 79 fps
GRID 2019

GRID 2019

2019
low 1280x720
GeForce RTX 2080 Super Max-Q:
174.8  fps
Titan RTX:
227  fps
med. 1920x1080
GeForce RTX 2080 Super Max-Q:
85.9 125 ~ 105 fps
Titan RTX:
189  fps
high 1920x1080
GeForce RTX 2080 Super Max-Q:
77.7 111 ~ 94 fps
Titan RTX:
167  fps
ultra 1920x1080
GeForce RTX 2080 Super Max-Q:
72 74 ~ 73 fps
Titan RTX:
147  fps
QHD 2560x1440
GeForce RTX 2080 Super Max-Q:
66.4  fps
Titan RTX:
122  fps
4K 3840x2160
GeForce RTX 2080 Super Max-Q:
46.9  fps
Titan RTX:
79  fps
low 1280x720
GeForce RTX 2080 Super Max-Q:
117 128 130 ~ 125 fps
Titan RTX:
160 170 ~ 165 fps
med. 1920x1080
GeForce RTX 2080 Super Max-Q:
93 95 96 102 ~ 97 fps
Titan RTX:
140 146 ~ 143 fps
high 1920x1080
GeForce RTX 2080 Super Max-Q:
86 87 88 92 ~ 88 fps
Titan RTX:
127 135 ~ 131 fps
ultra 1920x1080
GeForce RTX 2080 Super Max-Q:
65 65 66 70 ~ 67 fps
Titan RTX:
99 104 ~ 102 fps
QHD 2560x1440
GeForce RTX 2080 Super Max-Q:
49 53 ~ 51 fps
Titan RTX:
78 80 ~ 79 fps
4K 3840x2160
GeForce RTX 2080 Super Max-Q:
29 31 ~ 30 fps
Titan RTX:
49 50 ~ 50 fps
FIFA 20

FIFA 20

2019
low 1280x720
Titan RTX:
266  fps
med. 1920x1080
GeForce RTX 2080 Super Max-Q:
251  fps
Titan RTX:
263  fps
high 1920x1080
GeForce RTX 2080 Super Max-Q:
217 241 ~ 229 fps
Titan RTX:
247  fps
ultra 1920x1080
GeForce RTX 2080 Super Max-Q:
213 240 ~ 227 fps
Titan RTX:
245  fps
QHD 2560x1440
GeForce RTX 2080 Super Max-Q:
189 239 ~ 214 fps
Titan RTX:
245  fps
4K 3840x2160
GeForce RTX 2080 Super Max-Q:
114 190 ~ 152 fps
Titan RTX:
242  fps
low 1280x720
100%
Radeon RX 7700 XT:
244  fps
53%
GeForce RTX 2080 Super Max-Q:
128.3 132.5 ~ 130 fps
73%
Titan RTX:
102.4 116 120.9 136 143 147 150 151 155 159 164 164 166 168 175 183 186 188 191.1 198 200 202 214 217 221 221 229 237 250 ~ 178 fps
med. 1920x1080
100%
Radeon RX 7700 XT:
210  fps
50%
GeForce RTX 2080 Super Max-Q:
101.6 105.7 107 ~ 105 fps
73%
Titan RTX:
88.1 107 109.9 120 127 132 132 136 138 140 143 146 148 149 155 160 161 165 166.7 172 174 175 177 182 183 183 187 201 209 ~ 154 fps
high 1920x1080
100%
Radeon RX 7700 XT:
158.2  fps
51%
GeForce RTX 2080 Super Max-Q:
78.2 79.8 81.1 84.3 ~ 81 fps
83%
Titan RTX:
81.2 100 102.4 112 116 119 122 122 124 125 129 130 130 132 136 137 138 138 138 139 141 141 141 141 144 144 147 157 160.3 ~ 131 fps
ultra 1920x1080
100%
Radeon RX 7700 XT:
126.4  fps
52%
GeForce RTX 2080 Super Max-Q:
62.5 63.5 68.1 71.6 ~ 66 fps
89%
Titan RTX:
77.2 92 94.7 102 103 104 107 109 109 111 112 112 114 114 115 116 116 116 117 117 117 117 118 118 119 122 124 127.4 128.7 ~ 112 fps
QHD 2560x1440
100%
Radeon RX 7700 XT:
89.4  fps
56%
GeForce RTX 2080 Super Max-Q:
49.1 51.7 ~ 50 fps
95%
Titan RTX:
74 79 80 82 82 82 82.1 83 83.2 83.2 83.8 83.8 83.9 84 84.4 84.7 84.8 85 85 85 85.1 86 86.1 88.4 89.9 90.4 90.9 91.6 93.1 ~ 85 fps
4K 3840x2160
100%
Radeon RX 7700 XT:
48  fps
56%
GeForce RTX 2080 Super Max-Q:
26.6 26.9 ~ 27 fps
98%
Titan RTX:
46 46 46 46 46 46.3 46.3 46.3 46.4 46.5 46.5 46.6 46.7 46.8 46.9 47 47 47 47.1 47.2 47.2 47.9 48 48.1 49.2 49.6 49.7 49.8 52.8 ~ 47 fps
Control

Control

2019
low 1280x720
100%
Radeon RX 7700 XT:
240  fps
92%
GeForce RTX 2080 Super Max-Q:
221.7  fps
96%
Titan RTX:
211 240 240 ~ 230 fps
med. 1920x1080
100%
Radeon RX 7700 XT:
214  fps
48%
GeForce RTX 2080 Super Max-Q:
96.6 107 ~ 102 fps
83%
Titan RTX:
170 176 186.1 ~ 177 fps
high 1920x1080
100%
Radeon RX 7700 XT:
156.1  fps
47%
GeForce RTX 2080 Super Max-Q:
71 71.1 79.8 ~ 74 fps
88%
Titan RTX:
135 135 141.9 ~ 137 fps
QHD 2560x1440
100%
Radeon RX 7700 XT:
96.1  fps
49%
GeForce RTX 2080 Super Max-Q:
46.1 48.4 ~ 47 fps
96%
Titan RTX:
89 92 93.6 ~ 92 fps
4K 3840x2160
100%
Radeon RX 7700 XT:
46.4  fps
50%
GeForce RTX 2080 Super Max-Q:
22 24.9 ~ 23 fps
101%
Titan RTX:
45.2 47 47.3 ~ 47 fps
F1 2019

F1 2019

2019
low 1280x720
GeForce RTX 2080 Super Max-Q:
205  fps
Titan RTX:
174  fps
med. 1920x1080
GeForce RTX 2080 Super Max-Q:
168 174 ~ 171 fps
Titan RTX:
163  fps
high 1920x1080
GeForce RTX 2080 Super Max-Q:
141 147 ~ 144 fps
Titan RTX:
147  fps
ultra 1920x1080
GeForce RTX 2080 Super Max-Q:
138 142 ~ 140 fps
Titan RTX:
134  fps
QHD 2560x1440
GeForce RTX 2080 Super Max-Q:
122  fps
Titan RTX:
134  fps
4K 3840x2160
GeForce RTX 2080 Super Max-Q:
74  fps
Titan RTX:
98  fps
low 1280x720
GeForce RTX 2080 Super Max-Q:
227.8 233 245.5 273.1 ~ 245 fps
Titan RTX:
234.7  fps
med. 1920x1080
GeForce RTX 2080 Super Max-Q:
123.8 127.8 136.4 142.4 ~ 133 fps
Titan RTX:
151.3  fps
high 1920x1080
GeForce RTX 2080 Super Max-Q:
83.8 86.5 88.5 95.4 ~ 89 fps
Titan RTX:
123.8  fps
ultra 1920x1080
GeForce RTX 2080 Super Max-Q:
61 62.5 64.1 69 ~ 64 fps
Titan RTX:
106.1  fps
QHD 2560x1440
GeForce RTX 2080 Super Max-Q:
39.9  fps
Titan RTX:
75.5  fps
4K 3840x2160
GeForce RTX 2080 Super Max-Q:
19.6  fps
Titan RTX:
38.4  fps
Rage 2

Rage 2

2019
low 1280x720
Titan RTX:
282  fps
med. 1920x1080
GeForce RTX 2080 Super Max-Q:
126  fps
Titan RTX:
175  fps
high 1920x1080
GeForce RTX 2080 Super Max-Q:
102 106 ~ 104 fps
Titan RTX:
158  fps
ultra 1920x1080
GeForce RTX 2080 Super Max-Q:
101 103 ~ 102 fps
Titan RTX:
157  fps
QHD 2560x1440
GeForce RTX 2080 Super Max-Q:
63.8 68.4 ~ 66 fps
Titan RTX:
106  fps
4K 3840x2160
GeForce RTX 2080 Super Max-Q:
30.9 34.1 ~ 33 fps
Titan RTX:
54.6  fps
Anno 1800

Anno 1800

2019
low 1280x720
100%
Radeon RX 7700 XT:
201  fps
79%
GeForce RTX 2080 Super Max-Q:
159  fps
50%
Titan RTX:
70 131 ~ 101 fps
med. 1920x1080
100%
Radeon RX 7700 XT:
197.1  fps
49%
GeForce RTX 2080 Super Max-Q:
94 98.2 ~ 96 fps
49%
Titan RTX:
69 125 ~ 97 fps
high 1920x1080
100%
Radeon RX 7700 XT:
143.5  fps
53%
GeForce RTX 2080 Super Max-Q:
74.4 76.7 ~ 76 fps
53%
Titan RTX:
56.9 96 ~ 76 fps
ultra 1920x1080
100%
Radeon RX 7700 XT:
68.5  fps
66%
GeForce RTX 2080 Super Max-Q:
44.4 44.9 ~ 45 fps
64%
Titan RTX:
33.9 54.5 ~ 44 fps
QHD 2560x1440
100%
Radeon RX 7700 XT:
58.1  fps
67%
GeForce RTX 2080 Super Max-Q:
38.8  fps
72%
Titan RTX:
33.4 50.9 ~ 42 fps
4K 3840x2160
100%
Radeon RX 7700 XT:
33.7  fps
69%
GeForce RTX 2080 Super Max-Q:
23.2  fps
110%
Titan RTX:
33 40.4 ~ 37 fps
low 1280x720
GeForce RTX 2080 Super Max-Q:
165  fps
Titan RTX:
157  fps
med. 1920x1080
GeForce RTX 2080 Super Max-Q:
117 129 ~ 123 fps
Titan RTX:
147  fps
high 1920x1080
GeForce RTX 2080 Super Max-Q:
96 112 ~ 104 fps
Titan RTX:
128  fps
ultra 1920x1080
GeForce RTX 2080 Super Max-Q:
73 80 ~ 77 fps
Titan RTX:
113  fps
QHD 2560x1440
GeForce RTX 2080 Super Max-Q:
59  fps
Titan RTX:
102  fps
4K 3840x2160
GeForce RTX 2080 Super Max-Q:
31  fps
Titan RTX:
62  fps
low 1280x720
GeForce RTX 2080 Super Max-Q:
252  fps
Titan RTX:
200  fps
med. 1920x1080
GeForce RTX 2080 Super Max-Q:
166 168.4 ~ 167 fps
Titan RTX:
166  fps
high 1920x1080
GeForce RTX 2080 Super Max-Q:
158.5 162 ~ 160 fps
Titan RTX:
162  fps
ultra 1920x1080
GeForce RTX 2080 Super Max-Q:
90 98.8 ~ 94 fps
Titan RTX:
148  fps
QHD 2560x1440
GeForce RTX 2080 Super Max-Q:
76.4  fps
Titan RTX:
132  fps
4K 3840x2160
Titan RTX:
83  fps
Anthem

Anthem

2019
low 1280x720
Titan RTX:
101  fps
med. 1920x1080
Titan RTX:
97  fps
high 1920x1080
Titan RTX:
93  fps
ultra 1920x1080
Titan RTX:
92  fps
QHD 2560x1440
Titan RTX:
90  fps
4K 3840x2160
Titan RTX:
76  fps
low 1280x720
100%
Radeon RX 7700 XT:
176  fps
85%
Titan RTX:
88 97 99 102 104 122 122 130 132 135 143 147 147 151 152 164 164 165 166 168 171 176 178 178 179 188 188 203 ~ 149 fps
med. 1920x1080
100%
Radeon RX 7700 XT:
157  fps
66%
GeForce RTX 2080 Super Max-Q:
103  fps
82%
Titan RTX:
80 86 86 92 92 105 107 108 115 115 120 124 125 134 135 142 144 145 146 147 148 152 155 155 156 162 167 178 ~ 129 fps
high 1920x1080
100%
Radeon RX 7700 XT:
151  fps
65%
GeForce RTX 2080 Super Max-Q:
97 98 ~ 98 fps
82%
Titan RTX:
78 83 83 88 89 101 103 104 111 111 113 120 120 129 129 136 139 140 141 143 147 148 149 151 154 162 168 ~ 124 fps
ultra 1920x1080
100%
Radeon RX 7700 XT:
136  fps
66%
GeForce RTX 2080 Super Max-Q:
87 92 ~ 90 fps
82%
Titan RTX:
72 76 76 81 88 92 94 95 98 101 101 108 109 116 117 123 123 124 126 126 129 131 132 135 136 140 145 151 ~ 112 fps
QHD 2560x1440
100%
Radeon RX 7700 XT:
134  fps
56%
GeForce RTX 2080 Super Max-Q:
71 78 ~ 75 fps
80%
Titan RTX:
71 73 75 81 85 87 95 97 97 97 99 103 103 113 115 115 116 117 120 121 121 122 124 126 128 129 133 135 ~ 107 fps
4K 3840x2160
100%
Radeon RX 7700 XT:
89  fps
52%
GeForce RTX 2080 Super Max-Q:
43 48 ~ 46 fps
90%
Titan RTX:
68 69 72 74 75 76 78 79 79 80 81 81 81 82 82 82 82 83 83 83 83 84 84 84 84 84 85 85 ~ 80 fps
low 1280x720
100%
Radeon RX 7700 XT:
289  fps
47%
GeForce RTX 2080 Super Max-Q:
131 143.3 ~ 137 fps
66%
Titan RTX:
1 97.1 119 120 131 151 156 159 159 169 177 180.9 192 192 210 210 212 220 227 228 232 236 239 239 241 251 291 304 ~ 191 fps
med. 1920x1080
100%
Radeon RX 7700 XT:
194  fps
50%
GeForce RTX 2080 Super Max-Q:
93.2 96.2 101 ~ 97 fps
77%
Titan RTX:
1 90.4 106 107 113 129 134 135 138 142 150.2 153 158 161 164 167 172 172 172 172 173 173 174 175 176.9 178 186 187 ~ 149 fps
high 1920x1080
100%
Radeon RX 7700 XT:
148.4  fps
50%
GeForce RTX 2080 Super Max-Q:
70.3 74.4 77.8 ~ 74 fps
84%
Titan RTX:
80.9 94 96 100 113 117 117 120 120.8 121 129 129 132 133 133 133 133 133 133 135 135 136 137 137 137 144.6 146 ~ 125 fps
ultra 1920x1080
100%
Radeon RX 7700 XT:
113.9  fps
53%
GeForce RTX 2080 Super Max-Q:
57.2 59 63.4 ~ 60 fps
90%
Titan RTX:
73 80 84 85 97.1 98.8 99.3 100 101 101.8 104 105 106 106 106 106 107 107 107 108 108.9 109 109 110 111 114.7 116 ~ 102 fps
QHD 2560x1440
100%
Radeon RX 7700 XT:
89.6  fps
57%
GeForce RTX 2080 Super Max-Q:
51.2  fps
94%
Titan RTX:
69 77 79 79.9 80 80.2 80.3 81.5 82 84.1 84.6 84.7 84.9 85.4 85.4 85.8 86.1 86.3 86.4 86.7 87.3 87.7 88 88.7 90.5 92.9 ~ 84 fps
4K 3840x2160
100%
Radeon RX 7700 XT:
57  fps
55%
GeForce RTX 2080 Super Max-Q:
31.6  fps
96%
Titan RTX:
51.3 52.3 52.5 52.5 53 53.6 53.7 53.9 54 54.6 54.7 54.7 54.9 54.9 55 55.1 55.2 55.3 56 56 56.3 56.3 56.4 56.6 56.8 57.7 57.9 ~ 55 fps
low 1280x720
GeForce RTX 2080 Super Max-Q:
299  fps
Titan RTX:
144  fps
med. 1920x1080
GeForce RTX 2080 Super Max-Q:
194 196 ~ 195 fps
Titan RTX:
144  fps
high 1920x1080
GeForce RTX 2080 Super Max-Q:
148.8 165 ~ 157 fps
Titan RTX:
144  fps
ultra 1920x1080
GeForce RTX 2080 Super Max-Q:
147.6 163 ~ 155 fps
Titan RTX:
144  fps
QHD 2560x1440
GeForce RTX 2080 Super Max-Q:
118  fps
Titan RTX:
143.8  fps
4K 3840x2160
GeForce RTX 2080 Super Max-Q:
65  fps
Titan RTX:
121.4  fps
low 1280x720
Titan RTX:
208  fps
med. 1920x1080
GeForce RTX 2080 Super Max-Q:
152  fps
Titan RTX:
201  fps
high 1920x1080
GeForce RTX 2080 Super Max-Q:
113  fps
Titan RTX:
156  fps
ultra 1920x1080
GeForce RTX 2080 Super Max-Q:
105  fps
Titan RTX:
151  fps
QHD 2560x1440
GeForce RTX 2080 Super Max-Q:
73.9  fps
4K 3840x2160
GeForce RTX 2080 Super Max-Q:
41.3  fps
Titan RTX:
67  fps
low 1280x720
Titan RTX:
214  fps
med. 1920x1080
GeForce RTX 2080 Super Max-Q:
112  fps
Titan RTX:
145  fps
high 1920x1080
GeForce RTX 2080 Super Max-Q:
109  fps
Titan RTX:
138  fps
ultra 1920x1080
GeForce RTX 2080 Super Max-Q:
103  fps
Titan RTX:
131  fps
QHD 2560x1440
GeForce RTX 2080 Super Max-Q:
82.1  fps
4K 3840x2160
GeForce RTX 2080 Super Max-Q:
43.2  fps
Titan RTX:
74  fps
low 1280x720
GeForce RTX 2080 Super Max-Q:
154.3 173 ~ 164 fps
Titan RTX:
169.5  fps
med. 1920x1080
GeForce RTX 2080 Super Max-Q:
124.7 139 148 ~ 137 fps
Titan RTX:
163.2  fps
high 1920x1080
GeForce RTX 2080 Super Max-Q:
116.2 127 127 135 ~ 126 fps
Titan RTX:
163.8  fps
ultra 1920x1080
GeForce RTX 2080 Super Max-Q:
109.7 118 119 125 ~ 118 fps
Titan RTX:
160.4  fps
QHD 2560x1440
GeForce RTX 2080 Super Max-Q:
95.4 96.1 ~ 96 fps
4K 3840x2160
GeForce RTX 2080 Super Max-Q:
52.6 58.7 ~ 56 fps
Titan RTX:
97.3  fps
low 1280x720
Titan RTX:
198  fps
med. 1920x1080
Titan RTX:
157  fps
high 1920x1080
Titan RTX:
131  fps
ultra 1920x1080
Titan RTX:
125  fps
4K 3840x2160
Titan RTX:
112  fps
low 1280x720
Titan RTX:
60  fps
med. 1920x1080
Titan RTX:
60  fps
high 1920x1080
Titan RTX:
60  fps
ultra 1920x1080
Titan RTX:
60  fps
4K 3840x2160
Titan RTX:
60  fps
Hitman 2

Hitman 2

2018
low 1280x720
Titan RTX:
87  fps
med. 1920x1080
GeForce RTX 2080 Super Max-Q:
86.7  fps
Titan RTX:
85  fps
high 1920x1080
GeForce RTX 2080 Super Max-Q:
78.6  fps
Titan RTX:
78  fps
ultra 1920x1080
GeForce RTX 2080 Super Max-Q:
77  fps
Titan RTX:
75  fps
QHD 2560x1440
GeForce RTX 2080 Super Max-Q:
76  fps
4K 3840x2160
GeForce RTX 2080 Super Max-Q:
46.1  fps
Titan RTX:
75  fps
low 1280x720
Titan RTX:
225  fps
med. 1920x1080
Titan RTX:
209  fps
high 1920x1080
Titan RTX:
205  fps
ultra 1920x1080
Titan RTX:
200  fps
4K 3840x2160
Titan RTX:
88  fps
low 1280x720
100%
Radeon RX 7700 XT:
181  fps
56%
GeForce RTX 2080 Super Max-Q:
102  fps
63%
Titan RTX:
114  fps
med. 1920x1080
100%
Radeon RX 7700 XT:
165  fps
55%
GeForce RTX 2080 Super Max-Q:
87 92 ~ 90 fps
63%
Titan RTX:
104  fps
high 1920x1080
100%
Radeon RX 7700 XT:
148  fps
52%
GeForce RTX 2080 Super Max-Q:
75 78 ~ 77 fps
64%
Titan RTX:
95  fps
ultra 1920x1080
100%
Radeon RX 7700 XT:
121  fps
46%
GeForce RTX 2080 Super Max-Q:
54 58 ~ 56 fps
65%
Titan RTX:
79  fps
QHD 2560x1440
100%
Radeon RX 7700 XT:
98  fps
54%
GeForce RTX 2080 Super Max-Q:
53  fps
4K 3840x2160
100%
Radeon RX 7700 XT:
58  fps
55%
GeForce RTX 2080 Super Max-Q:
32  fps
90%
Titan RTX:
52  fps
low 1280x720
100%
Radeon RX 7700 XT:
334  fps
64%
Titan RTX:
150 157 173 181 190 194 206 209 210 222 232 236 246 249 251 263 293 ~ 215 fps
med. 1920x1080
100%
Radeon RX 7700 XT:
278  fps
68%
Titan RTX:
132 139 153 160 167 175 185 185 187 200 204 209 218 218 218 221 227 ~ 188 fps
high 1920x1080
100%
Radeon RX 7700 XT:
272  fps
68%
Titan RTX:
131 135 152 158 163 173 184 184 186 200 204 207 212 216 216 216 218 ~ 186 fps
ultra 1920x1080
100%
Radeon RX 7700 XT:
231  fps
74%
Titan RTX:
129 132 134 151 158 164 173 173 175 178 178 185 187 189 192 193 196 ~ 170 fps
QHD 2560x1440
100%
Radeon RX 7700 XT:
197  fps
79%
Titan RTX:
127 132 144 150 153 154 154 157 157 160 162 162 164 164 165 171 ~ 155 fps
4K 3840x2160
100%
Radeon RX 7700 XT:
134  fps
84%
Titan RTX:
90 110 110 111 111 112 112 112 114 114 115 117 117 117 118 118 121 ~ 113 fps
FIFA 19

FIFA 19

2018
low 1280x720
Titan RTX:
286  fps
med. 1920x1080
Titan RTX:
281  fps
high 1920x1080
Titan RTX:
254  fps
ultra 1920x1080
Titan RTX:
251  fps
4K 3840x2160
Titan RTX:
213  fps
low 1280x720
100%
Radeon RX 7700 XT:
355  fps
36%
GeForce RTX 2080 Super Max-Q:
103 117 138 139 150 ~ 129 fps
54%
Titan RTX:
115 116 126 135 139 148 154 156 157 172 178 188 195 203 204 217 221 224 225 225.1 230 231 314 350 ~ 193 fps
med. 1920x1080
100%
Radeon RX 7700 XT:
242  fps
45%
GeForce RTX 2080 Super Max-Q:
95 104 109 111 116 120 ~ 109 fps
68%
Titan RTX:
107 109 109 122 123 131 142 145 145 160 161 171 176 180 183 184.2 185 186 192 193 195 202 216 218 ~ 164 fps
high 1920x1080
100%
Radeon RX 7700 XT:
223  fps
47%
GeForce RTX 2080 Super Max-Q:
93 100 104 105 105 110 116 ~ 105 fps
71%
Titan RTX:
107 108 109 121 123 129 138 142 143 156 156 168 172 173 177 177.9 178 178 183 183 187 189 195.8 197 ~ 158 fps
ultra 1920x1080
100%
Radeon RX 7700 XT:
194.1  fps
49%
GeForce RTX 2080 Super Max-Q:
89 91 92 92 93 96 97 99 103 106 ~ 96 fps
77%
Titan RTX:
106 106 107 116 120 127 133 137 138 149 150 158 163 165 165 166 166.1 168 169 170 176 176 176.9 178.8 ~ 149 fps
QHD 2560x1440
100%
Radeon RX 7700 XT:
131.9  fps
52%
GeForce RTX 2080 Super Max-Q:
63 67 72 75 ~ 69 fps
89%
Titan RTX:
98 99 99 108 108 112 115 118 120 120.1 121 121 122 122 122 124 124 124 124.5 126.1 127 127 128 ~ 118 fps
4K 3840x2160
100%
Radeon RX 7700 XT:
65.5  fps
56%
GeForce RTX 2080 Super Max-Q:
32 36 39 41 ~ 37 fps
102%
Titan RTX:
59 63 65 65 65 65 66 66 66 66.3 66.3 66.4 66.5 66.8 67 68.2 68.5 69 69.3 69.9 70.1 70.2 70.4 71.1 ~ 67 fps
Strange Brigade

Strange Brigade

2018
low 1280x720
100%
Radeon RX 7700 XT:
730  fps
67%
Titan RTX:
283 289 300 338 376 435 438 457 473 489 540 593 604 607 620 643 662 711 ~ 492 fps
med. 1920x1080
100%
Radeon RX 7700 XT:
398  fps
83%
Titan RTX:
231 239 257 291 316 332 336 338 350 351 352 352 352 354 355 370 371 389 ~ 330 fps
high 1920x1080
100%
Radeon RX 7700 XT:
334  fps
84%
Titan RTX:
227 231 252 264 274 275 284 284 286 286 287 287 288 301 302 306 308 317 ~ 281 fps
ultra 1920x1080
100%
Radeon RX 7700 XT:
287  fps
85%
Titan RTX:
211 212 229 231 234 235 240 241 242 242 243 243 244 262 263 266 266 274 ~ 243 fps
QHD 2560x1440
100%
Radeon RX 7700 XT:
193  fps
95%
Titan RTX:
169 170 176 178 178 179 180 181 183 183 183 184 184 194 196 197 197 201 ~ 184 fps
4K 3840x2160
100%
Radeon RX 7700 XT:
97.4  fps
112%
Titan RTX:
101 103 103 106 107 107 107 107 108 110 110 110 110 113.2 114 115 115 115 ~ 109 fps
F1 2018

F1 2018

2018
low 1280x720
Titan RTX:
234  fps
med. 1920x1080
Titan RTX:
206  fps
high 1920x1080
Titan RTX:
160  fps
ultra 1920x1080
Titan RTX:
143  fps
4K 3840x2160
Titan RTX:
99  fps
low 1280x720
Titan RTX:
148  fps
med. 1920x1080
GeForce RTX 2080 Super Max-Q:
105  fps
Titan RTX:
142  fps
high 1920x1080
GeForce RTX 2080 Super Max-Q:
97.7  fps
Titan RTX:
141  fps
ultra 1920x1080
GeForce RTX 2080 Super Max-Q:
90  fps
Titan RTX:
136  fps
QHD 2560x1440
GeForce RTX 2080 Super Max-Q:
63.3  fps
4K 3840x2160
GeForce RTX 2080 Super Max-Q:
31.9  fps
Titan RTX:
54  fps
low 1280x720
Titan RTX:
60  fps
med. 1920x1080
Titan RTX:
60  fps
high 1920x1080
Titan RTX:
60  fps
ultra 1920x1080
Titan RTX:
60  fps
4K 3840x2160
Titan RTX:
60  fps
Far Cry 5

Far Cry 5

2018
low 1280x720
100%
Radeon RX 7700 XT:
212  fps
64%
GeForce RTX 2080 Super Max-Q:
111 143 154 ~ 136 fps
83%
Titan RTX:
102 114 117 129 137 138 141 148 151 154 157 166 183 184 193 193 199 200 200 201 204 207 212 212 213 220 230 249 ~ 177 fps
med. 1920x1080
100%
Radeon RX 7700 XT:
188  fps
60%
GeForce RTX 2080 Super Max-Q:
100 115 122 ~ 112 fps
82%
Titan RTX:
98 100 103 115 122 124 126 129 133 135 139 148 157 160 169 171 171 174 174 177 177 177 183 184 187 191 201 207 ~ 155 fps
high 1920x1080
100%
Radeon RX 7700 XT:
181  fps
59%
GeForce RTX 2080 Super Max-Q:
96 108 116 ~ 107 fps
81%
Titan RTX:
93 96 98 109 116 118 120 122 128 128 132 140 147 152 159 161 165 166 166 167 168 169 173 175 177 178 190 195 ~ 147 fps
ultra 1920x1080
100%
Radeon RX 7700 XT:
167  fps
60%
GeForce RTX 2080 Super Max-Q:
91 101 102 110 ~ 101 fps
83%
Titan RTX:
89 90 92 103 109 112 113 115 120 120 126 131 136 143 149 152 153 154 154 157 158 158 161 164 165 167 180 184 ~ 138 fps
QHD 2560x1440
100%
Radeon RX 7700 XT:
157  fps
49%
GeForce RTX 2080 Super Max-Q:
77  fps
80%
Titan RTX:
87 88 90 104 107 110 110 113 116 120 121 127 130 134 135 136 136 137 137 138 140 140 141 145 145 146 148 ~ 125 fps
4K 3840x2160
100%
Radeon RX 7700 XT:
82  fps
51%
GeForce RTX 2080 Super Max-Q:
42  fps
96%
Titan RTX:
72 75 76 76 77 78 78 78 78 78 78 78 79 80 80 80 80 80 80 81 81 81 82 82 83 83 83 84 ~ 79 fps
low 1280x720
100%
Radeon RX 7700 XT:
162.8  fps
68%
GeForce RTX 2080 Super Max-Q:
102 107 109 113 114 114 ~ 110 fps
87%
Titan RTX:
70.9 71.8 91.1 94.8 95 98.2 107 113 123 125 125 127 131 133 139 141 148 149 152 157 168 170 172 172 177 178 186 200 227 230 ~ 142 fps
med. 1920x1080
100%
Radeon RX 7700 XT:
129.7  fps
75%
GeForce RTX 2080 Super Max-Q:
90.9 93.4 95.8 97.6 99.8 104 ~ 97 fps
99%
Titan RTX:
67.2 68.6 83.6 86.1 87.8 90.6 96.8 102 108 110 113 113 118 118 125 127 130 133 137 138 152 153 153 156 158 158 164 176 198.9 204 ~ 128 fps
high 1920x1080
100%
Radeon RX 7700 XT:
100.2  fps
82%
GeForce RTX 2080 Super Max-Q:
76.8 79.5 80.8 82.8 84.3 87.6 ~ 82 fps
104%
Titan RTX:
58.5 63.2 69.9 71.7 75.6 76.3 83.3 84.6 89.3 91.2 92.8 93.2 96 96.8 102 105 106 109 111 112 117 119 123 125 128 128 130 137 156.8 157.5 ~ 104 fps
4K 3840x2160
100%
Radeon RX 7700 XT:
69.3  fps
97%
GeForce RTX 2080 Super Max-Q:
67  fps
130%
Titan RTX:
52.9 56.5 61 62.2 65.9 67.7 73.9 74.4 77.1 79.1 80.2 80.6 82.8 83.7 88.9 90.9 91.9 94 94.9 99.3 101 104 105 109 109 110 111 117 130.4 131.4 ~ 90 fps
low 1280x720
Titan RTX:
140  fps
med. 1920x1080
GeForce RTX 2080 Super Max-Q:
119  fps
Titan RTX:
127  fps
high 1920x1080
GeForce RTX 2080 Super Max-Q:
100  fps
Titan RTX:
101  fps
ultra 1920x1080
GeForce RTX 2080 Super Max-Q:
72  fps
Titan RTX:
79  fps
QHD 2560x1440
GeForce RTX 2080 Super Max-Q:
56.1  fps
4K 3840x2160
GeForce RTX 2080 Super Max-Q:
31.9  fps
Titan RTX:
49  fps
low 1280x720
100%
Radeon RX 7700 XT:
235  fps
81%
Titan RTX:
109 117 128 137 142 145 155 158 177 179 185 187 189 189 196 201 201 213 216 218 219 219 221 222 225 225 225 225 227 235 235 ~ 191 fps
med. 1920x1080
100%
Radeon RX 7700 XT:
203  fps
51%
GeForce RTX 2080 Super Max-Q:
103  fps
82%
Titan RTX:
101 109 120 131 134 137 144 148 149 153 158 161 162 166 169 172 176 176 176 179 182 182 183 184 186 187 192 193 195 195 202 202 ~ 166 fps
high 1920x1080
100%
Radeon RX 7700 XT:
139.5  fps
53%
GeForce RTX 2080 Super Max-Q:
67 80.8 ~ 74 fps
91%
Titan RTX:
84.7 87.9 97 99.3 99.7 109 112 117 118 118 120 120 122 124 127 133 134 136 138 139 140 140 141 141 141 142 143 144 144 148 150.4 150.5 ~ 127 fps
QHD 2560x1440
100%
Radeon RX 7700 XT:
103.1  fps
101%
Titan RTX:
80.6 82.7 101 103 103 104 104 105 105 105 106 107 107 107 108 108 109 111 111.2 113.3 ~ 104 fps
4K 3840x2160
100%
Radeon RX 7700 XT:
57.4  fps
66%
GeForce RTX 2080 Super Max-Q:
37.6  fps
108%
Titan RTX:
57.4 57.8 58 59 59.1 59.3 59.3 59.8 59.9 59.9 59.9 61.2 61.6 62.3 62.9 63.1 63.2 63.2 63.3 63.4 63.6 63.6 64.1 64.5 64.6 64.9 65.2 65.4 65.5 65.5 65.5 66.7 ~ 62 fps
Fortnite

Fortnite

2018
low 1280x720
Titan RTX:
274  fps
med. 1920x1080
GeForce RTX 2080 Super Max-Q:
121  fps
Titan RTX:
169  fps
high 1920x1080
GeForce RTX 2080 Super Max-Q:
114  fps
Titan RTX:
176  fps
ultra 1920x1080
GeForce RTX 2080 Super Max-Q:
99.5  fps
Titan RTX:
134  fps
QHD 2560x1440
GeForce RTX 2080 Super Max-Q:
80.3  fps
4K 3840x2160
GeForce RTX 2080 Super Max-Q:
44.5  fps
Titan RTX:
74  fps
low 1280x720
Titan RTX:
138  fps
med. 1920x1080
Titan RTX:
128  fps
high 1920x1080
Titan RTX:
123  fps
ultra 1920x1080
Titan RTX:
121  fps
4K 3840x2160
Titan RTX:
90  fps
low 1280x720
Titan RTX:
255  fps
med. 1920x1080
Titan RTX:
255  fps
high 1920x1080
Titan RTX:
185  fps
ultra 1920x1080
Titan RTX:
179  fps
4K 3840x2160
Titan RTX:
127  fps
low 1280x720
100%
Radeon RX 7700 XT:
182  fps
63%
Titan RTX:
115  fps
med. 1920x1080
100%
Radeon RX 7700 XT:
144  fps
72%
Titan RTX:
104  fps
high 1920x1080
100%
Radeon RX 7700 XT:
134  fps
76%
Titan RTX:
102  fps
ultra 1920x1080
100%
Radeon RX 7700 XT:
114  fps
76%
Titan RTX:
87  fps
QHD 2560x1440
100%
Radeon RX 7700 XT:
90  fps
4K 3840x2160
100%
Radeon RX 7700 XT:
58  fps
112%
Titan RTX:
65  fps
Destiny 2

Destiny 2

2017
low 1280x720
Titan RTX:
149  fps
med. 1920x1080
Titan RTX:
154  fps
high 1920x1080
Titan RTX:
150  fps
ultra 1920x1080
Titan RTX:
154  fps
4K 3840x2160
Titan RTX:
94  fps
FIFA 18

FIFA 18

2017
low 1280x720
Titan RTX:
361  fps
med. 1920x1080
Titan RTX:
356  fps
high 1920x1080
Titan RTX:
327  fps
ultra 1920x1080
Titan RTX:
325  fps
4K 3840x2160
Titan RTX:
302  fps
F1 2017

F1 2017

2017
low 1280x720
Titan RTX:
232  fps
med. 1920x1080
Titan RTX:
188  fps
high 1920x1080
Titan RTX:
156  fps
ultra 1920x1080
Titan RTX:
141  fps
4K 3840x2160
Titan RTX:
101  fps
low 1280x720
Titan RTX:
206  fps
med. 1920x1080
Titan RTX:
202  fps
high 1920x1080
Titan RTX:
163  fps
ultra 1920x1080
Titan RTX:
136  fps
4K 3840x2160
Titan RTX:
96  fps
Dirt 4

Dirt 4

2017
low 1280x720
Titan RTX:
323  fps
med. 1920x1080
Titan RTX:
254  fps
high 1920x1080
Titan RTX:
220  fps
ultra 1920x1080
Titan RTX:
192  fps
4K 3840x2160
Titan RTX:
124  fps
low 1280x720
Titan RTX:
248  fps
med. 1920x1080
Titan RTX:
248  fps
high 1920x1080
Titan RTX:
248  fps
4K 3840x2160
Titan RTX:
197  fps
low 1280x720
Titan RTX:
140  fps
med. 1920x1080
Titan RTX:
114  fps
high 1920x1080
Titan RTX:
112  fps
ultra 1920x1080
Titan RTX:
86  fps
4K 3840x2160
Titan RTX:
67  fps
For Honor

For Honor

2017
low 1280x720
Titan RTX:
268  fps
med. 1920x1080
Titan RTX:
245  fps
high 1920x1080
Titan RTX:
243  fps
ultra 1920x1080
Titan RTX:
213  fps
4K 3840x2160
Titan RTX:
101  fps
low 1280x720
Titan RTX:
141  fps
med. 1366x768
Titan RTX:
125  fps
high 1920x1080
Titan RTX:
112  fps
ultra 1920x1080
Titan RTX:
100  fps
4K 3840x2160
Titan RTX:
70  fps
low 1280x720
Titan RTX:
120  fps
med. 1366x768
Titan RTX:
119  fps
high 1920x1080
Titan RTX:
119  fps
ultra 1920x1080
Titan RTX:
115  fps
4K 3840x2160
Titan RTX:
104  fps
low 1280x720
Titan RTX:
193.7  fps
med. 1366x768
Titan RTX:
179.9  fps
high 1920x1080
Titan RTX:
166.2  fps
ultra 1920x1080
Titan RTX:
154.2  fps
4K 3840x2160
Titan RTX:
111.8  fps
FIFA 17

FIFA 17

2016
low 1280x720
Titan RTX:
420  fps
med. 1366x768
Titan RTX:
411  fps
high 1920x1080
Titan RTX:
390  fps
ultra 1920x1080
Titan RTX:
386  fps
4K 3840x2160
Titan RTX:
355  fps
low 1280x720
Titan RTX:
157.8  fps
med. 1366x768
Titan RTX:
148.1  fps
high 1920x1080
Titan RTX:
128.7  fps
ultra 1920x1080
Titan RTX:
120.7  fps
4K 3840x2160
Titan RTX:
71.6  fps
Overwatch

Overwatch

2016
low 1280x720
Titan RTX:
300  fps
med. 1366x768
Titan RTX:
300  fps
high 1920x1080
Titan RTX:
300  fps
ultra 1920x1080
Titan RTX:
298  fps
4K 3840x2160
Titan RTX:
267  fps
Doom

Doom

2016
low 1280x720
Titan RTX:
147  fps
med. 1366x768
Titan RTX:
139  fps
high 1920x1080
Titan RTX:
139  fps
ultra 1920x1080
Titan RTX:
144  fps
4K 3840x2160
Titan RTX:
140  fps
low 1280x720
100%
Radeon RX 7700 XT:
213  fps
130%
Titan RTX:
277  fps
med. 1366x768
100%
Radeon RX 7700 XT:
216  fps
112%
Titan RTX:
241  fps
high 1920x1080
100%
Radeon RX 7700 XT:
195  fps
96%
Titan RTX:
188  fps
ultra 1920x1080
100%
Radeon RX 7700 XT:
162  fps
101%
Titan RTX:
163  fps
4K 3840x2160
100%
Radeon RX 7700 XT:
81  fps
112%
Titan RTX:
91  fps
low 1280x720
Titan RTX:
116  fps
med. 1920x1080
Titan RTX:
104  fps
high 1920x1080
Titan RTX:
95  fps
ultra 1920x1080
Titan RTX:
88  fps
4K 3840x2160
Titan RTX:
88  fps
low 1024x768
100%
Radeon RX 7700 XT:
347  fps
78%
Titan RTX:
272  fps
med. 1366x768
100%
Radeon RX 7700 XT:
253  fps
77%
Titan RTX:
196  fps
high 1920x1080
100%
Radeon RX 7700 XT:
170.4  fps
111%
Titan RTX:
189  fps
ultra 1920x1080
100%
Radeon RX 7700 XT:
148.6  fps
127%
Titan RTX:
188  fps
4K 3840x2160
100%
Radeon RX 7700 XT:
75.5  fps
131%
Titan RTX:
99  fps
low 1024x768
Titan RTX:
327  fps
med. 1366x768
Titan RTX:
281  fps
high 1920x1080
Titan RTX:
275  fps
ultra 1920x1080
Titan RTX:
274  fps
4K 3840x2160
Titan RTX:
177  fps
low 1280x720
100%
Radeon RX 7700 XT:
278.7  fps
53%
GeForce RTX 2080 Super Max-Q:
134.3 146 146.6 147 155 156 ~ 147 fps
64%
Titan RTX:
112.8 117.2 118.3 119.9 127.4 130.9 133.2 148.5 153.8 157.3 160.5 162.1 163.3 168.8 169.8 171.6 178.1 183 183.7 184.8 186.9 195.1 198.8 203.5 214.5 216.8 228.9 232.6 242.5 290.9 303.6 ~ 179 fps
med. 1366x768
100%
Radeon RX 7700 XT:
206.3  fps
65%
GeForce RTX 2080 Super Max-Q:
128.7 132 134 135.8 141 141 ~ 135 fps
80%
Titan RTX:
101.2 107.7 109 111.7 112.9 120 121.3 132.8 137.3 144.7 145.3 147.2 151.6 155.6 156.4 160.6 167.8 169.9 170.7 180.2 181 187.6 188 192.3 198 200.7 208.7 208.7 213.8 258.7 273.2 ~ 165 fps
high 1920x1080
100%
Radeon RX 7700 XT:
186.3  fps
68%
GeForce RTX 2080 Super Max-Q:
117.4 122 123 124.2 134 139 ~ 127 fps
85%
Titan RTX:
97.8 100.3 103.3 107.9 108.8 115.8 117.7 128.9 132 139.6 141.7 144.2 151 151.2 151.2 155.2 163 164.7 164.8 173.2 174.2 181.1 183 189.8 191 193.3 199.4 201.7 204 241.2 254.8 ~ 159 fps
ultra 1920x1080
100%
Radeon RX 7700 XT:
169.3  fps
71%
GeForce RTX 2080 Super Max-Q:
115 116 117.7 118 125 128 ~ 120 fps
89%
Titan RTX:
92.1 93.1 98 103.8 104.1 110.8 111.8 124.4 124.9 130.8 134.5 136 139.7 144.1 146.8 148.1 154.5 157.3 162.9 165.3 172.2 172.2 174.9 179.2 180 180.3 180.6 186.8 189.7 222.8 237.6 ~ 150 fps
4K 3840x2160
100%
Radeon RX 7700 XT:
123.5  fps
83%
GeForce RTX 2080 Super Max-Q:
102  fps
117%
Titan RTX:
90.4 96.7 100.4 101.9 108.2 110.5 118.9 120.7 122.1 131.5 132.7 138.1 139.1 139.2 143.7 146.1 151.4 153.1 158.9 159.1 161.6 161.8 165.8 167.4 168.3 172.1 174.1 175.6 178.9 187.4 194.6 ~ 144 fps
low 1024x768
100%
Radeon RX 7700 XT:
732  fps
45%
GeForce RTX 2080 Super Max-Q:
308.4 310.3 330.5 345 348.2 ~ 328 fps
63%
Titan RTX:
252 279 280 300 329 338 344 354 388 388 408 412 413 426 466 468 500 514 518 558 560 570 589 594 602 617 650 710 ~ 458 fps
med. 1366x768
100%
Radeon RX 7700 XT:
516  fps
47%
GeForce RTX 2080 Super Max-Q:
236 237 239.5 239.9 245 251.3 ~ 241 fps
72%
Titan RTX:
233 252 252 270 297 302 317 330 348 357 358 362 362 371 396 400 403 406 413 420 422 431 436 437 438 446 447 471 ~ 371 fps
high 1920x1080
100%
Radeon RX 7700 XT:
295  fps
51%
GeForce RTX 2080 Super Max-Q:
138 142.7 143 143.4 153.2 159.8 160 ~ 149 fps
86%
Titan RTX:
190 205 215 220 221 229 241 242 249 250 252 253 258 265 268 270 270 271 271 272 274 275 276 276 277 277 283 293 ~ 255 fps
ultra 1920x1080
100%
Radeon RX 7700 XT:
168.3  fps
51%
GeForce RTX 2080 Super Max-Q:
74.3 75.1 75.8 82.6 83.4 87.7 88.6 88.8 90.2 95.8 96 ~ 85 fps
82%
Titan RTX:
124 125 125 126 128 128 130 133 138 139 139 139 139 139 139.9 140 140 141 141 141 142 142 143 144 144 147 149 150 ~ 138 fps
QHD 2560x1440
100%
Radeon RX 7700 XT:
119.6  fps
4K 3840x2160
100%
Radeon RX 7700 XT:
88.7  fps
61%
GeForce RTX 2080 Super Max-Q:
49.8 53.5 54.3 58.2 ~ 54 fps
115%
Titan RTX:
94 95.8 98 98.1 100 101 101 101 102 102 102 102 102 103 103 103 103 104 104 104 104.1 105 105 105 106 106 107 107.1 ~ 102 fps
GTA V

GTA V

2015
low 1024x768
100%
Radeon RX 7700 XT:
188  fps
96%
GeForce RTX 2080 Super Max-Q:
179 180 ~ 180 fps
98%
Titan RTX:
171.1 179 183 184 186 186 187 187 187 187 187 187 187 187.5 ~ 185 fps
med. 1366x768
100%
Radeon RX 7700 XT:
187.4  fps
92%
GeForce RTX 2080 Super Max-Q:
172 174 ~ 173 fps
98%
Titan RTX:
166.9 173 179 180 184 184 185 186 186 186 187 187 187.2 187.5 ~ 183 fps
high 1920x1080
100%
Radeon RX 7700 XT:
186.5  fps
83%
GeForce RTX 2080 Super Max-Q:
153 157 ~ 155 fps
95%
Titan RTX:
146.6 157 170 172 179 181 181 181 182 184 184 185 186.6 187.3 ~ 177 fps
ultra 1920x1080
100%
Radeon RX 7700 XT:
146  fps
59%
GeForce RTX 2080 Super Max-Q:
85.3 85.8 ~ 86 fps
84%
Titan RTX:
92.4 104 105 117 118 121 123 124 125.1 126 128 135 153.7 156.6 ~ 123 fps
QHD 2560x1440
100%
Radeon RX 7700 XT:
105.4  fps
107%
Titan RTX:
87.5 99.5 101 109 112 113 115 115 116 123 133.8 136.4 ~ 113 fps
4K 3840x2160
100%
Radeon RX 7700 XT:
112.4  fps
64%
GeForce RTX 2080 Super Max-Q:
71.5  fps
119%
Titan RTX:
125 125 127 132 133 134 134 136 138 139 140.2 140.6 140.8 ~ 134 fps
low 1024x768
Titan RTX:
200  fps
med. 1366x768
Titan RTX:
200  fps
high 1366x768
Titan RTX:
200  fps
ultra 1920x1080
Titan RTX:
200  fps
4K 3840x2160
Titan RTX:
159  fps
low 1280x720
GeForce RTX 2080 Super Max-Q:
347.4 400 425.1 426.3 ~ 400 fps
Titan RTX:
311.5  fps
med. 1366x768
GeForce RTX 2080 Super Max-Q:
330.2 344.4 349.2 364.5 ~ 347 fps
Titan RTX:
287.3  fps
high 1366x768
GeForce RTX 2080 Super Max-Q:
300.5 319.9 323.7 324.2 ~ 317 fps
Titan RTX:
262.2  fps
ultra 1920x1080
GeForce RTX 2080 Super Max-Q:
170.2 173 173.1 181.1 ~ 174 fps
Titan RTX:
212.8  fps

Average Gaming AMD Radeon RX 7700 XT → 100%

Average Gaming 30-70 fps → 100%

Average Gaming NVIDIA GeForce RTX 2080 Super Max-Q → 58%

Average Gaming 30-70 fps → 58%

Average Gaming NVIDIA Titan RTX → 91%

Average Gaming 30-70 fps → 93%

AMD Radeon RX 7700 XTNVIDIA GeForce RTX 2080 Super Max-QNVIDIA Titan RTX
lowmed.highultraQHD4Klowmed.highultraQHD4Klowmed.highultraQHD4K
Black Myth: Wukong997558322515
Once Human240178.4152.7137.193.249
The First Descendant211128.9106.589.460.834.2
F1 2438532524480.853.626.6
Senua's Saga Hellblade 277.365.349.734.919.9
Ghost of Tsushima130.4107.999.68062.339.4
Horizon Forbidden West145.3131.491.390.468.841.9
Alone in the Dark313272233137.984.222.3
Dragon's Dogma 289.272.359.341.3
Last Epoch293294267222147.874.3
Skull & Bones141132109846842
Helldivers 2188.3143.6127.9125.390.951.3
Enshrouded105.792.979.867.453.233
Palworld146.6123.898.791.465.836.3
Prince of Persia The Lost Crown359359359359277
Ready or Not281277269183.6109.948.4289283256183.8109.246.4
The Finals347286253189.3118.954.7324250225171.5111.655.1
Avatar Frontiers of Pandora11410387684623979180644423
Call of Duty Modern Warfare 3 2023234212171158109641531391101037445
EA Sports WRC240155.8140.4125.592.851.8175.3133.1122.3111.583.349.5
Alan Wake 2119.710893.262.730.891.782.57854.128.3
Lords of the Fallen135113.879.45637.119.2110.798.771.851.135.318.9
Total War Pharaoh519.1333.2209.7169.6122.860.5493319.6200.9159.911660.8
Assassin's Creed Mirage1861681541209154134125119987951
EA Sports FC 24395345274246199.1127.2338292247228178.7109.5
Counter-Strike 2351344283202127.262353342289251157.189.6
Cyberpunk 2077175.9145.1120.8110.273.131.61661541201107437
Baldur's Gate 3203166.3136.213395.750.2175.8144.7121.8122.283.944.7
Lies of P268232196.8173.6122.763.9248221193.6177.111961.2
Starfield100.590.473.66855.13670.661.55450.74128.2
Armored Core 6119.5118.9116.8106.484.351.5119.7119.6119.5119.1100.760.5
Immortals of Aveum120.2102.682.256.129.976.566.153.337.820.9
Atlas Fallen191.6186.6179165.6117.663.3190.8184.9175.8157.1108.359.6
Ratchet & Clank Rift Apart151.3121.9102.1907242.5152.2131.9106.493.275.347.1
F1 2346441831076.548.723.542136826481.652.926.3
Diablo 43633162862431587136832028223816285.4
Star Wars Jedi Survivor129.9115.6107.510162.330.3124.1108.8100.695.36030.6
Dead Island 2353318238166.2119.962.7314299224164.5116.158.7
The Last of Us154.6132.51221056829.6126.3108.410183.558.328.7
Resident Evil 4 Remake229180.4156.1107.184.249.2202139.9129.197.573.444.7
Company of Heroes 3300.6254195.7194.3143.481.3248.7212.1164.1162.8122.272.2
Sons of the Forest118.7115.6112.4112.299.159130.8118.4113112.287.455.7
Atomic Heart265199.4118.893.673.943.8264197.6117.796.974.945
Returnal16315313711587501421341221078150
Hogwarts Legacy195.6161.1119.391.466.935.5166.9145.2116.794.169.137.7
Dead Space Remake133.4129.4110.9111.87536.2126.8124111.374.739.3
The Witcher 3 v4307264233198122.659.3298245208175.3125.272.6
High On Life350263194.1150.389.638339235172.6136.687.139.6
The Callisto Protocol239.8194.1177.1115.390.157.8193.3153.9101.5101.274.745.7
Need for Speed Unbound205183.3144.3144.1111.764.2182.1170.1143.8126.69857.5
Spider-Man Miles Morales154.5144.8130.2121.1100.658.1157.5143.6139.7136.1102.561
Call of Duty Modern Warfare 2 20221661341061057747
Uncharted Legacy of Thieves Collection102.298.892.68770.142.1102.898.796.891.37446.2
A Plague Tale Requiem160.3121.992.870.152.630.315712292.17051.129.6
FIFA 23217221215218183.5111.6
The Quarry234172.9136.9106.373.637.82191691391097641
F1 2242640031592.359.929.8365348271895829
Vampire Bloodhunt391267252244173.293.6
Ghostwire Tokyo244235233225139.965.721720320520413870
Tiny Tina's Wonderlands366281170.6133.289.2462542091521238948
Cyberpunk 2077 1.6193158.2132122.180.23678.978.778.678.366.232.8
Elex 21111059895.481.247.7
GRID Legends263226194.9173.1153.8104.227923920015212887
Elden Ring59.959.959.759.959.959.6
Dying Light 216911093.666.537.1
Rainbow Six Extraction26422522317913070
God of War191.9188.1148.710285.354.2181155129968054
Halo Infinite14412511995.568.8
Farming Simulator 22279221186164163122
Battlefield 204299.313912911793.660.2
Forza Horizon 5268168153988664
Call of Duty Vanguard11315314413310059.6
Riders Republic22117915214310965
Guardians of the Galaxy1801771751641257217317117116814082
Back 4 Blood294270255182101
Far Cry 6227196.9178.5161.8121.963.118415113512610262
Alan Wake Remastered93.188.388.488.5
New World18013913112310154.5
Deathloop12812512411991.651.8
F1 2021645537397172.6129.572.652240333016612573
Monster Hunter Stories 2144144144144144
Days Gone19018117414110864.9
Mass Effect Legendary Edition106113107106
Resident Evil Village30426424121214274.2
Outriders13616215815611964
Hitman 327122221020214582
Cyberpunk 2077 1.010910393.282.358.430.9
Immortals Fenyx Rising13610693716448
Yakuza Like a Dragon11911711611110055.2
Call of Duty Black Ops Cold War25423816214487.652.9
Assassin´s Creed Valhalla2501801491321015913710488806643
Dirt 5167.9125.798.685.983.281.618712810695.979.557
Watch Dogs Legion11311297.485.569.943.4
FIFA 21215215204203205203
Star Wars Squadrons440367334315232144
Mafia Definitive Edition149.8133123.710963.4
Serious Sam 4138.2108.1106.499.192.471.2
Crysis Remastered27374.521211590.948.9
Flight Simulator 2020857562514832
Horizon Zero Dawn14810990751581421261099054
Death Stranding238217198.9191.9145.681.615312111210921819918718213679
F1 2020575391322216170.6102.52471751531168951420333299216167102
Valorant377348336307300
Gears Tactics222172118865629325.9197.7146.9141.2105.356.3
Doom Eternal23116815115611965242246239236192105
Hunt Showdown207.412010268.832.423519417112461.8
Escape from Tarkov12112112112083.139.712112112011911781.7
Red Dead Redemption 21289966433623142133110766341
Star Wars Jedi Fallen Order1039893744012712612311974
Need for Speed Heat101.993858066.940.91241191101009868
Call of Duty Modern Warfare 201916912411196703922421319017013179
GRID 2019174.8105947366.446.922718916714712279
Ghost Recon Breakpoint12597886751301651431311027950
FIFA 20251229227214152266263247245245242
Borderlands 3244210158.2126.489.448130105816650271781541311128547
Control240214156.196.146.4221.71027447232301771379247
F1 20192051711441401227417416314713413498
Total War: Three Kingdoms245133896439.919.6234.7151.3123.8106.175.538.4
Rage 2126104102663328217515815710654.6
Anno 1800201197.1143.568.558.133.715996764538.823.21019776444237
The Division 216512310477593115714712811310262
Dirt Rally 2.02521671609476.420016616214813283
Anthem1019793929076
Far Cry New Dawn176157151136134891039890754614912912411210780
Metro Exodus289194148.4113.989.65713797746051.231.61911491251028455
Apex Legends29919515715511865144144144144143.8121.4
Just Cause 415211310573.941.320820115615167
Darksiders III11210910382.143.221414513813174
Battlefield V1641371261189656169.5163.2163.8160.497.3
Farming Simulator 19198157131125112
Fallout 766060606060
Hitman 286.778.6777646.18785787575
Call of Duty Black Ops 422520920520088
Assassin´s Creed Odyssey18116514812198581029077565332114104957952
Forza Horizon 4334278272231197134215188186170155113
FIFA 19286281254251213
Shadow of the Tomb Raider355242223194.1131.965.512910910596693719316415814911867
Strange Brigade73039833428719397.4492330281243184109
F1 201823420616014399
Monster Hunter World10597.79063.331.914814214113654
The Crew 26060606060
Far Cry 521218818116715782136112107101774217715514713812579
X-Plane 11.11162.8129.7100.269.311097826714212810490
Kingdom Come: Deliverance1191007256.131.91401271017949
Final Fantasy XV Benchmark235203139.5103.157.41037437.619116612710462
Fortnite12111499.580.344.527416917613474
Need for Speed Payback13812812312190
Call of Duty WWII255255185179127
Assassin´s Creed Origins18214413411490581151041028765
Destiny 214915415015494
FIFA 18361356327325302
F1 2017232188156141101
Playerunknown's Battlegrounds (PUBG)20620216313696
Dirt 4323254220192124
Rocket League248248248197
Ghost Recon Wildlands1401141128667
For Honor268245243213101
Watch Dogs 214112511210070
Dishonored 2120119119115104
Battlefield 1193.7179.9166.2154.2111.8
FIFA 17420411390386355
Deus Ex Mankind Divided157.8148.1128.7120.771.6
Overwatch300300300298267
Doom147139139144140
The Division2132161951628127724118816391
Far Cry Primal116104958888
Rise of the Tomb Raider347253170.4148.675.527219618918899
Rainbow Six Siege327281275274177
Dota 2 Reborn278.7206.3186.3169.3123.5147135127120102179165159150144
The Witcher 3732516295168.3119.688.73282411498554458371255138102
GTA V188187.4186.5146105.4112.41801731558671.5185183177123113134
Battlefield 4200200200200159
BioShock Infinite400347317174311.5287.3262.2212.8
AMD Radeon RX 7700 XTNVIDIA GeForce RTX 2080 Super Max-QNVIDIA Titan RTX
lowmed.highultraQHD4Klowmed.highultraQHD4Klowmed.highultraQHD4K
< 30 fps
< 60 fps
< 120 fps
≥ 120 fps


6
64


8
61


16
54

1
25
40

8
39
19
6
35
26
3
< 30 fps
< 60 fps
< 120 fps
≥ 120 fps


3
27


20
21


29
12

3
27
7

11
20
2
6
24
6
1
< 30 fps
< 60 fps
< 120 fps
≥ 120 fps

1
28
138

1
36
133

4
51
117

7
66
87
1
17
79
35
13
63
76
20

Eine Liste mit weiteren Spielen und allen Grafikkarten finden Sie auf unserer Seite: Welches Spiel ist mit welcher Grafikkarte spielbar?

v1.35
log 09. 07:24:40

#0 ran 0s before starting gpusingle class +0s ... 0s

#1 checking url part for id 11617 +0s ... 0s

#2 checking url part for id 10305 +0s ... 0s

#3 checking url part for id 9651 +0s ... 0s

#4 redirected to Ajax server, took 1767939879s time from redirect:0 +0s ... 0s

#5 did not recreate cache, as it is less than 5 days old! Created at Wed, 07 Jan 2026 12:03:58 +0100 +0s ... 0s

#6 composed specs +0.025s ... 0.026s

#7 did output specs +0s ... 0.026s

#8 start showIntegratedCPUs +0s ... 0.026s

#9 getting avg benchmarks for device 11617 +0.017s ... 0.043s

#10 got single benchmarks 11617 +0.001s ... 0.043s

#11 getting avg benchmarks for device 10305 +0s ... 0.043s

#12 got single benchmarks 10305 +0.014s ... 0.057s

#13 getting avg benchmarks for device 9651 +0.004s ... 0.061s

#14 got single benchmarks 9651 +0.036s ... 0.097s

#15 got avg benchmarks for devices +0s ... 0.097s

#16 min, max, avg, median took s +0.075s ... 0.172s

#17 before gaming benchmark output +0s ... 0.172s

#18 Got 3753 rows for game benchmarks. +0.107s ... 0.278s

#19 composed SQL query for gamebenchmarks +0s ... 0.278s

#20 got data and put it in $dataArray +0.018s ... 0.297s

#21 benchmarks composed for output. +0.072s ... 0.369s

#22 calculated avg scores. +0s ... 0.369s

#23 return log +0.005s ... 0.374s

Teilen Sie diesen Artikel, um uns zu unterstützen. Jeder Link hilft!
Mail Logo
> Notebook Test, Laptop Test und News > Benchmarks / Technik > Benchmarks / Technik > Grafikkarten Vergleich - Head 2 Head
Autor: Klaus Hinum,  8.09.2017 (Update:  1.07.2023)