Intel HD Graphics (Skylake) vs Intel HD Graphics 4400 vs Intel HD Graphics 3000
Intel HD Graphics (Skylake) ► remove from comparison
Die Intel HD Graphics (Skylake) (GT1) ist eine Prozessorgrafikkarte der im September 2015 vorgestellten Skylake-Generation. Für die meisten CPU wurden die Namen Intel HD Graphics 510 und Intel HD Graphics 515 genutzt.
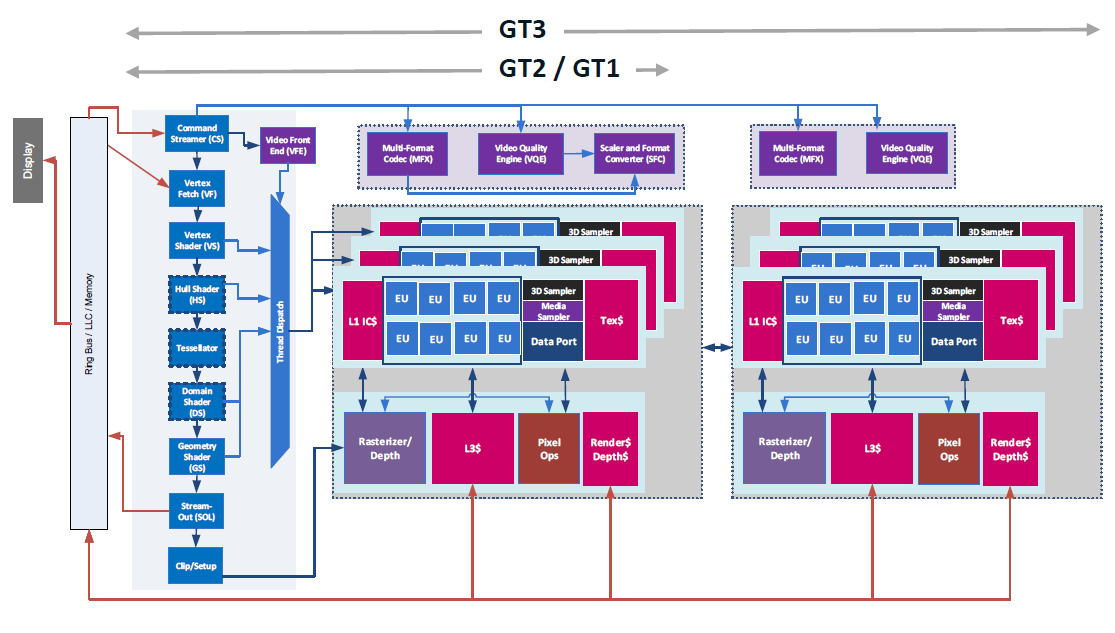
Zwar glänzt die GPU mit einer extrem niedrigen Leistungsaufnahme, allerdings siedelt sich die Performance nur im untersten Low-End-Segment an und ist für neuere Spiele kaum ausreichend. Als sogenannte GT1-Ausbaustufe der Skylake-GPU verfügt die HD Graphics über 12 Execution Units (EUs), die je nach Modell mit bis zu 800 MHz takten.
Mangels eigenem Grafikspeicher oder eDRAM-Cache greift die HD Graphics (Skylake) über das Interface des Prozessors auf den System-RAM zu (2x 64 Bit DDR3L-1600/LPDDR3-1866).
Performance
Die exakte Leistung der HD Graphics hängt stark vom jeweiligen Endgerät und dessen TDP-Einstellung ab. Zum anderen bestimmt auch der eingesetzte Speicher die Performance.
Im Optimalfall dürfte die GPU in etwa mit der älteren HD Graphics 4200 konkurrieren und kann aktuelle Spiele (Stand 2015) nur in wenigen Ausnahmefällen flüssig darstellen.
Features
Der überarbeitete Videodecoder decodiert nun auch H.265-/HEVC-Videos vollständig in Hardware und arbeitet dadurch deutlich effizienter als bislang. Die Bildausgabe erfolgt über DP 1.2/eDP 1.3 (max. 3.840 x 2.160 @ 60 Hz), wohingegen HDMI nur in der älteren Version 1.4a angeboten wird. Ein HDMI-2.0-Anschluss kann aber mittels Konverter von DisplayPort ergänzt werden. Maximal lassen sich drei Displays parallel angesteuern.
Leistungsaufnahme
Die TDP des gesamten Chips liegt standardmäßig bei 6 Watt, sodass viele Ultrabooks oder 2-in-1-Geräte mit einer rein passiven Kühlung auskommen. Teils kann die TDP auch auf 4,5 Watt abgesenkt werden, wodurch allerdings die Performance sinkt.
Intel HD Graphics 4400 ► remove from comparison
Die Intel HD Graphics 4400 (GT2) ist eine Prozessorgrafikkarte in einigen ULV-CPUs der Haswell Generation. Je nach Prozessormodell wird die Intel HD Graphics 4400 unterschiedlich getaktet und kann auf einen unterschiedlich großen Cache zurückgreifen. All dies sowie die Geschwindigkeit des angebundenen Arbeitsspeichers beeinflusst die Performance entscheidend. Im Vergleich zur HD 4600 bietet die HD 4400 gleich viele Shaderkerne, aber geringere Taktraten (siehe Taktratenliste der Modelle weiter unten).
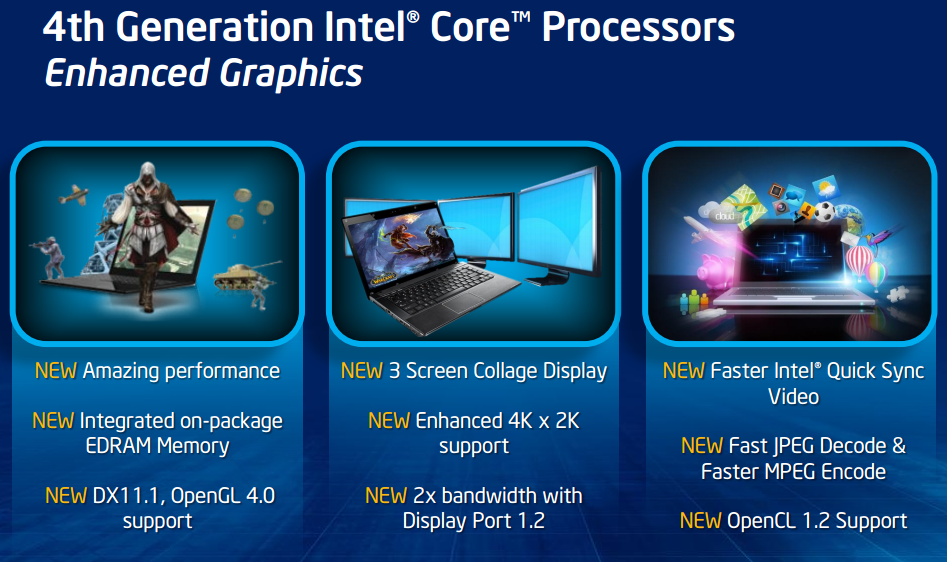
Der Grafikkern wurde im Vergleich zum Intel HD Graphics 4000 der Ivy-Bridge-Generation in verschiedenen Punkten weiterentwickelt. So unterstützt die GPU nun mit DirectX 11.1, OpenCL 1.2 und OpenGL 4.0 alle wichtigen aktuellen Standards. Auch ein verbesserter Decoder für 4K-Videos sowie ein überarbeiteter Quick-Sync-Encoder sind mit an Bord.
Die Performance der HD Graphics 4400 liegt deutlich unter der HD 4600 , da die GPU in ULV-Modellen mit relativ geringer Taktrate eingesetzt wird. Desweiteren limitiert die niedrige TDP dieser Modelle den Turbo Boost, der oftmals nicht vollständig ausgeschöpft werden kann. Gegenüber der HD 4000 in den ULV-Modellen der Ivy-Bridge-Generation ist dennoch ein leichtes Leistungsplus zu verzeichnen. Neben architektonischen Verbesserungen ist dies vor allem auf eine gesteigerte Zahl an Ausführungseinheiten zurückzuführen: Die GT2-Ausbaustufe verfügt nun über 20 der sogenannten EUs (HD 4000: 16). Abhängig von der Taktrate erreicht die HD 4400 in etwa die Leistung einer dedizierten Radeon HD 7550M .
Der Stromverbrauch ist dank des 22-Nanometer-Prozesses mit Tri-Gate-Transistoren relativ gering und wird dynamisch vom TDP-Budget des gesamten Chips abgezweigt. Die HD 4400 kommt in einigen Dual-Core ULV-Prozessoren der 15-Watt-Klasse zum Einsatz.
Weitere Details zur Grafikkartenarchitektur der Haswell Generation, finden Sie in unserem Artikel von der IDF 2012 .
Intel HD Graphics 3000 ► remove from comparison
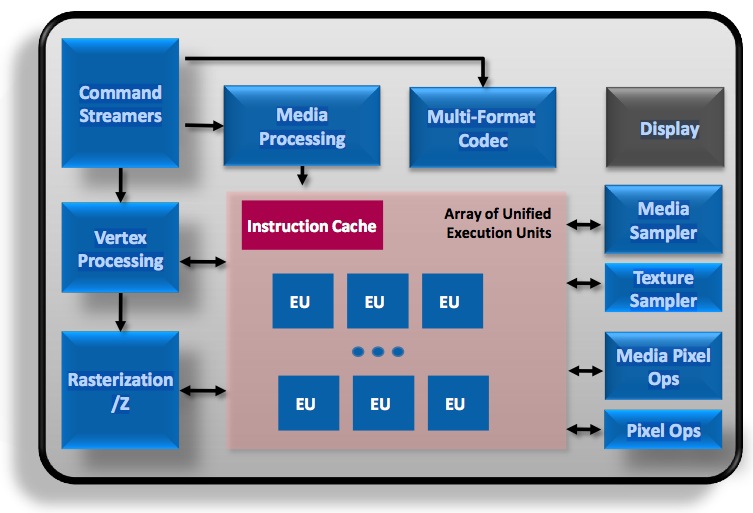
Die Intel HD Graphics 3000 (fälschlich auch Intel Graphics Media Accelerator HD 3000, GMA HD 3000, HD Graphics 200 genannt) ist eine in den Sandy Bridge Prozessoren integrierte Grafikkarte. Sie bietet keinen eigenen dedizierten Speicher, teilt sich jedoch den sehr schnellen Level 3 Cache bzw. LLC Cache mit den Prozessorkernen (3-8 MB je nach CPU). Der restliche Speicher wird vom Hauptspeicher abgezweigt (wie bei der Vorgänger-Grafikkarte Intel HD Graphics ). Je nach Prozessormodell unterscheidet sich der Basistakt und damit auch die Leistung deutlich (350-650 MHz) Dank TurboBoost kann sich die Grafikkarte wie die Prozessorkerne in gewissen Lastsituationen übertakten (bei ausreichend Kühlung und ebenfalls abhängig vom Prozessormodell).
ULV Prozessoren Core ix-2xx7 (Basis 350 MHz, Turbo 900-1000 MHz) LV Prozessoren Core ix-2xx5 (Basis 500 MHz, Turbo 1000 MHz) Standard Dual und Quad-Core Core ix-2xx0 (Basis 650 MHz, Turbo 1100-1300 MHz) Desktop K Prozessoren (Basis 850, Turbo 1100-1350 MHz) Die Intel GMA HD 3000 bietet wie die GMA HD 12 Execution Units (EUs), welche jedoch deutlich überarbeitet wurden und daher eine höhere Performance bieten. Die EUs der GMA HD 3000 können mit DirectX 10.1, OpenGL 3.0 und DirectCompute 4.1 angesteuert werden. OpenCL wird nicht unterstützt (das Media SDK verwendet nur die CPU, Stand März 2013).
Unsere Performancetests mit den schnell getakteten Versionen der HD Graphics 3000 zeigen eine deutlich gesteigerte Leistung im Vergleich zur Vorgängergeneration. Die integrierte shared Memory Grafikkarte positioniert sich je nach Spiel auf dem Niveau älterer Einstiegsgrafikkarten von Nvidia (GeForce 310M ) bzw. AMD (Mobility Radeon HD 5450 ), manchmal auch etwas darüber (Radeon HD 6450M ). Im Vergleich mit AMDs APU-Modellen kann die HD 3000 nur gegen die C- und E-Serie bestehen, nicht aber die schnelleren Llano- und Trinity-Ableger. Die in früheren Jahren oftmals problematische Qualität der Intel-Treiber (Grafikfehler, Spiele starten nicht) hat sich zuletzt deutlich verbessert, sodass die meisten Spiele bei erfüllten Mindestvoraussetzungen fehlerfrei spielbar sind.
Flüssige Frameraten konnten wir unter anderem in Spielen wie Dead Space 3, World of Tanks, Fifa 13, Torchlight 2, Counter-Strike: GO, Diablo 3 sowie vielen älteren Titeln erreichen, wenn auch meist nur bei minimalen Detaileinstellungen. Genaue Performanceanalysen und Spielebenchmarks finden Sie in unserem Schwerpunktartikel zur Intel HD Graphics 3000 bzw. weiter unten in diesem Artikel.
Wie bei den Ivy Bridge basierten Grafikkarten, wird anscheinend auch bei Sandy Bridge 2x Antialiasing per Software aus dem 4x Antialiasing errechnet. Daher ergibt sich kein Geschwindigkeitsunterschied zwischen 2x und 4x AA. Im Unigine Valley Benchmark erreichten wir als Bestätigung bei 2x AA und 4x AA dasselbe Ergebnis (HD Graphics 3000 ULV im i7-2637M).
Neben der GPU ist auch noch eine dedizierte Einheit zum Dekodieren und auch Encodieren von HD Videos in den Sandy Bridge Prozessoren enthalten (Intel Quick Sync). Um ein dreiminütiges 1080p-Video für das iPhone in das Format 640x360 zu wandeln, braucht Sandy Bridge laut Intel etwa 14s (IDF 2010). Eine weitere Besonderheit ist der unterstützte "embedded DisplayPort" eDP um interne Displays anzusteuern.
Aufgrund der Integration in den mit 32nm gefertigten Prozessor, ist der Stromverbrauch relativ gering.
Intel HD Graphics (Skylake) Intel HD Graphics 4400 Intel HD Graphics 3000 HD Graphics Serie Codename Skylake GT1 Haswell GT2 Sandy Bridge Architektur Gen. 9 Skylake Gen. 7.5 Haswell Gen. 6 Sandy Bridge Pipelines 12 - unified 20 - unified 12 - unified Kerntakt 300 - 800 (Boost) MHz 200 - 1100 (Boost) MHz 350 - 1350 (Boost) MHz Speicherbandbreite 64/128 Bit 64/128 Bit 64/128 Bit Speichertyp DDR3L/LPDDR3 Shared Memory ja ja ja API DirectX 12_1, OpenGL 4.4 DirectX 11.1, Shader 5.0, OpenGL 4.0 DirectX 10.1, Shader 4.1, OpenGL 3.0 Herstellungsprozess 14 nm 22 nm 32 nm Features QuickSync QuickSync Erscheinungsdatum 01.09.2015 05.06.2013 01.02.2011
CPU in HD Graphics 4400 GPU Base Speed GPU Boost / Turbo Intel Core i7-4600U 2 x 2100 MHz, 15 W 200 MHz 1100 MHz Intel Core i7-4510U 2 x 2000 MHz, 15 W 200 MHz 1100 MHz Intel Core i7-4500U 2 x 1800 MHz, 15 W 200 MHz 1100 MHz » show 10 more Intel Core i5-4310U 2 x 2000 MHz, 15 W 200 MHz 1100 MHz Intel Core i5-4300U 2 x 1900 MHz, 15 W 200 MHz 1100 MHz Intel Core i5-4210U 2 x 1700 MHz, 15 W 200 MHz 1000 MHz Intel Core i5-4200U 2 x 1600 MHz, 15 W 200 MHz 1000 MHz Intel Core i3-4120U 2 x 2000 MHz, 15 W 200 MHz 1000 MHz Intel Core i3-4030U 2 x 1900 MHz, 15 W 200 MHz 1000 MHz Intel Core i3-4025U 2 x 1900 MHz, 15 W 200 MHz 950 MHz Intel Core i3-4100U 2 x 1800 MHz, 15 W 200 MHz 1000 MHz Intel Core i3-4010U 2 x 1700 MHz, 15 W 200 MHz 1000 MHz Intel Core i3-4005U 2 x 1700 MHz, 15 W 200 MHz 950 MHz min. - max. 200 MHz 950 - 1100 MHz
CPU in HD Graphics 3000 GPU Base Speed GPU Boost / Turbo Intel Core i7-2700K 4 x 3500 MHz, 95 W 850 MHz 1350 MHz Intel Core i7-2600K 4 x 3400 MHz, 95 W 850 MHz 1350 MHz Intel Core i7-2960XM 4 x 2700 MHz, 55 W 650 MHz 1300 MHz » show 41 more Intel Core i7-2860QM 4 x 2500 MHz, 45 W 650 MHz 1300 MHz Intel Core i7-2920XM 4 x 2500 MHz, 55 W 650 MHz 1300 MHz Intel Core i5-2500K 4 x 3300 MHz, 95 W 850 MHz 1100 MHz Intel Core i7-2760QM 4 x 2400 MHz, 45 W 650 MHz 1300 MHz Intel Core i7-2820QM 4 x 2300 MHz, 45 W 650 MHz 1300 MHz Intel Core i7-2720QM 4 x 2200 MHz, 45 W 650 MHz 1300 MHz Intel Core i7-2675QM 4 x 2200 MHz, 45 W 650 MHz 1200 MHz Intel Core i7-2670QM 4 x 2200 MHz, 45 W 650 MHz 1100 MHz Intel Core i7-2635QM 4 x 2000 MHz, 45 W 650 MHz 1200 MHz Intel Core i7-2630QM 4 x 2000 MHz, 45 W 650 MHz 1100 MHz Intel Core i7-2640M 2 x 2800 MHz, 35 W 650 MHz 1300 MHz Intel Core i7-2620M 2 x 2700 MHz, 35 W 650 MHz 1300 MHz Intel Core i5-2540M 2 x 2600 MHz, 35 W 650 MHz 1300 MHz Intel Core i5-2520M 2 x 2500 MHz, 35 W 650 MHz 1300 MHz Intel Core i5-2450M 2 x 2500 MHz, 35 W 650 MHz 1300 MHz Intel Core i5-2435M 2 x 2400 MHz, 35 W 650 MHz 1300 MHz Intel Core i5-2430M 2 x 2400 MHz, 35 W 650 MHz 1200 MHz Intel Core i5-2415M 2 x 2300 MHz, 35 W 650 MHz 1300 MHz Intel Core i5-2410M 2 x 2300 MHz, 35 W 650 MHz 1200 MHz Intel Core i7-2649M 2 x 2300 MHz, 25 W 500 MHz 1100 MHz Intel Core i3-2370M 2 x 2400 MHz, 35 W 650 MHz 1150 MHz Intel Core i3-2350M 2 x 2300 MHz, 35 W 650 MHz 1150 MHz Intel Core i3-2348M 2 x 2300 MHz, 35 W 650 MHz 1150 MHz Intel Core i7-2629M 2 x 2100 MHz, 25 W 500 MHz 1100 MHz Intel Core i7-2677M 2 x 1800 MHz, 17 W 350 MHz 1200 MHz Intel Core i3-2330M 2 x 2200 MHz, 35 W 650 MHz 1100 MHz Intel Core i3-2328M 2 x 2200 MHz, 35 W 650 MHz 1100 MHz Intel Core i7-2637M 2 x 1700 MHz, 17 W 350 MHz 1200 MHz Intel Core i7-2657M 2 x 1600 MHz, 17 W 350 MHz 1000 MHz Intel Core i3-2312M 2 x 2100 MHz, 35 W 350 MHz 1100 MHz Intel Core i3-2310M 2 x 2100 MHz, 35 W 650 MHz 1100 MHz Intel Core i3-2308M 2 x 2100 MHz, 35 W 650 MHz 1100 MHz Intel Core i5-2557M 2 x 1700 MHz, 17 W 350 MHz 1200 MHz Intel Core i7-2617M 2 x 1500 MHz, 17 W 350 MHz 950 MHz Intel Core i5-2467M 2 x 1600 MHz, 17 W 350 MHz 1150 MHz Intel Core i5-2537M 2 x 1400 MHz, 17 W 350 MHz 900 MHz Intel Core i3-2377M 2 x 1500 MHz, 17 W 350 MHz 1000 MHz Intel Core i3-2375M 2 x 1500 MHz, 17 W 350 MHz 1000 MHz Intel Core i3-2367M 2 x 1400 MHz, 17 W 350 MHz 1000 MHz Intel Core i3-2365M 2 x 1400 MHz, 17 W 350 MHz 1000 MHz Intel Core i3-2357M 2 x 1300 MHz, 17 W 350 MHz 950 MHz min. - max. 200 - 850 MHz 900 - 1350 MHz
Benchmarks Performance Rating - 3DMark 11 + Fire Strike + Time Spy - HD Graphics 4400
0.3 pt (1%)
...
...
max:
3DMark - 3DMark Ice Storm Unlimited Graphics
37082 Points (4%)
3DMark - 3DMark Ice Storm Extreme Graphics
min: 19943 avg: 25546 median: 24573 (3%) max: 33095 Points
3DMark - 3DMark Cloud Gate Score
min: 1733 avg: 3980 median: 3940 (4%) max: 4989 Points
min: 2277 avg: 2642 median: 2656.5 (3%) max: 2979 Points
3DMark - 3DMark Cloud Gate Graphics
min: 1946 avg: 5040 median: 4953 (1%) max: 6547 Points
min: 2356 avg: 2593 median: 2502.5 (1%) max: 3011 Points
3DMark - 3DMark Fire Strike Standard Score
min: 352 avg: 543 median: 525 (1%) max: 700 Points
3DMark - 3DMark Fire Strike Standard Graphics
min: 369 avg: 592 median: 569 (1%) max: 778 Points
3DMark - 3DMark Ice Storm Graphics
min: 12866 avg: 38629 median: 38886.5 (5%) max: 58126 Points
min: 25494 avg: 29036 median: 27124 (3%) max: 36403 Points
3DMark 11 - 3DM11 Performance Score
min: 460 avg: 843 median: 828 (1%) max: 1032 Points
3DMark 11 - 3DM11 Performance GPU
min: 399 avg: 755 median: 735.5 (1%) max: 962 Points
3DMark Vantage + Intel HD Graphics 4400 3DMark Vantage - 3DM Vant. Perf. total
min: 2450 avg: 3559 median: 3583 (1%) max: 4820 Points
3DM Vant. Perf. total + Intel HD Graphics 3000
min: 1135 avg: 1560 median: 1568 (0%) max: 2164 Points
3DM Vant. Perf. GPU no PhysX + Intel HD Graphics 4400 3DMark Vantage - 3DM Vant. Perf. GPU no PhysX
min: 2083 avg: 3005 median: 2986.5 (2%) max: 4123 Points
3DM Vant. Perf. GPU no PhysX + Intel HD Graphics 3000
min: 927 avg: 1331 median: 1240 (1%) max: 8858 Points
3DMark 2001SE - 3DMark 2001 - Standard
20486 Points (21%)
min: 7796 avg: 12752 median: 11654 (12%) max: 19742 Points
3DMark 03 - 3DMark 03 - Standard
min: 9129 avg: 12378 median: 13244 (7%) max: 16040 Points
min: 5162 avg: 8577 median: 7751 (4%) max: 12358 Points
3DMark 05 - 3DMark 05 - Standard
min: 6313 avg: 8674 median: 8802 (10%) max: 10495 Points
min: 3498 avg: 6355 median: 5968 (7%) max: 9344 Points
3DMark 06 3DMark 06 - Standard 1280x1024 + Intel HD Graphics 4400
min: 4074 avg: 5110 median: 5164 (7%) max: 6293 Points
3DMark 06 - Standard 1280x1024 + Intel HD Graphics 3000
min: 1392 avg: 3451 median: 3286.5 (4%) max: 5853 Points
3DMark 06 - Score Unknown Settings + Intel HD Graphics 3000
min: 3508 avg: 3847 median: 3617 (5%) max: 5041 Points
3DMark 06 - Standard 1280x800 + Intel HD Graphics 3000
min: 2550 avg: 3176 median: 3224 (4%) max: 3753 Points
3DMark 06 - Standard 1280x768 + Intel HD Graphics 3000
min: 2788 avg: 3293 median: 3308 (4%) max: 3942 Points
Unigine Heaven 3.0 - Unigine Heaven 3.0 DX 11
min: 6.5 avg: 7.7 median: 8.2 (3%) max: 8.4 fps
Unigine Heaven 3.0 - Unigine Heaven 3.0 OpenGL
min: 7 avg: 8.2 median: 8.6 (4%) max: 9.1 fps
Unigine Heaven 2.1 - Heaven 2.1 high
min: 7.9 avg: 10.9 median: 10.9 (2%) max: 15.9 fps
min: 4 avg: 7.7 median: 7.8 (1%) max: 9.3 fps
SPECviewperf 11 + Intel HD Graphics 4400 SPECviewperf 11 - specvp11 snx-01
min: 1.06 avg: 1.6 median: 1.7 (1%) max: 2.09 fps
specvp11 snx-01 + Intel HD Graphics 3000 min: 0.18 avg: 0.3 median: 0.2 (0%) max: 0.75 fps
specvp11 tcvis-02 + Intel HD Graphics 4400 SPECviewperf 11 - specvp11 tcvis-02
min: 1.47 avg: 2.2 median: 2.2 (1%) max: 2.94 fps
specvp11 tcvis-02 + Intel HD Graphics 3000 min: 0.12 avg: 0.3 median: 0.2 (0%) max: 0.86 fps
specvp11 sw-02 + Intel HD Graphics 4400 SPECviewperf 11 - specvp11 sw-02
min: 6.04 avg: 9.7 median: 9.6 (7%) max: 12.19 fps
specvp11 sw-02 + Intel HD Graphics 3000
min: 2.55 avg: 3.6 median: 3.6 (3%) max: 4.61 fps
specvp11 proe-05 + Intel HD Graphics 4400 SPECviewperf 11 - specvp11 proe-05
min: 1.39 avg: 1.8 median: 1.9 (2%) max: 2.28 fps
specvp11 proe-05 + Intel HD Graphics 3000
min: 0.26 avg: 0.5 median: 0.5 (1%) max: 0.65 fps
specvp11 maya-03 + Intel HD Graphics 4400 SPECviewperf 11 - specvp11 maya-03
min: 7.81 avg: 12.6 median: 12.2 (9%) max: 16.81 fps
specvp11 maya-03 + Intel HD Graphics 3000
min: 1.07 avg: 4.6 median: 5 (4%) max: 7.63 fps
specvp11 lightwave-01 + Intel HD Graphics 4400 SPECviewperf 11 - specvp11 lightwave-01
min: 9.88 avg: 13.6 median: 13.2 (14%) max: 17.4 fps
specvp11 lightwave-01 + Intel HD Graphics 3000
min: 3.63 avg: 5.5 median: 5.5 (6%) max: 7.35 fps
specvp11 ensight-04 + Intel HD Graphics 4400 SPECviewperf 11 - specvp11 ensight-04
min: 1.29 avg: 1.9 median: 2 (1%) max: 2.47 fps
specvp11 ensight-04 + Intel HD Graphics 3000
min: 0.1 avg: 0.4 median: 0.1 (0%) max: 1.29 fps
SPECviewperf 12 + Intel HD Graphics 4400 SPECviewperf 12 - specvp12 sw-03
min: 6.92 avg: 9.3 median: 9.3 (2%) max: 11.62 fps
specvp12 snx-02 + Intel HD Graphics 4400 SPECviewperf 12 - specvp12 snx-02
min: 1.99 avg: 2 median: 2 (0%) max: 2.08 fps
specvp12 showcase-01 + Intel HD Graphics 4400 SPECviewperf 12 - specvp12 showcase-01
min: 4.19 avg: 4.3 median: 4.3 (1%) max: 4.48 fps
specvp12 mediacal-01 + Intel HD Graphics 4400 SPECviewperf 12 - specvp12 mediacal-01
min: 1.24 avg: 1.5 median: 1.5 (0%) max: 1.84 fps
specvp12 maya-04 + Intel HD Graphics 4400 SPECviewperf 12 - specvp12 maya-04
min: 2.36 avg: 2.5 median: 2.5 (1%) max: 2.54 fps
specvp12 energy-01 + Intel HD Graphics 4400 SPECviewperf 12 - specvp12 energy-01
min: 0.07 avg: 0.1 median: 0.1 (0%) max: 0.22 fps
specvp12 creo-01 + Intel HD Graphics 4400 SPECviewperf 12 - specvp12 creo-01
min: 6.08 avg: 6.6 median: 6.6 (3%) max: 7.02 fps
specvp12 catia-04 + Intel HD Graphics 4400 SPECviewperf 12 - specvp12 catia-04
min: 7.96 avg: 8.3 median: 8.3 (1%) max: 8.54 fps
Windows 7 Experience Index - Win7 Gaming graphics
min: 5.2 avg: 6.2 median: 6.5 (82%) max: 6.5 Points
min: 5.5 avg: 6.1 median: 6.1 (77%) max: 6.4 Points
Windows 7 Experience Index - Win7 Graphics
min: 5.2 avg: 5.5 median: 5.2 (66%) max: 6.5 Points
min: 4.1 avg: 5.1 median: 4.7 (59%) max: 6.4 Points
Cinebench R10 Cinebench R10 Shading (32bit) + Intel HD Graphics 4400 Cinebench R10 - Cinebench R10 Shading (32bit)
min: 4094 avg: 6063 median: 6130 (4%) max: 8532 Points
Cinebench R10 Shading (32bit) + Intel HD Graphics 3000
min: 1712 avg: 4274 median: 4414 (3%) max: 7038 Points
Cinebench R11.5 Cinebench R11.5 OpenGL 64 Bit + Intel HD Graphics 4400 Cinebench R11.5 - Cinebench R11.5 OpenGL 64 Bit
min: 9.45 avg: 16.8 median: 16.4 (6%) max: 24 fps
Cinebench R11.5 OpenGL 64 Bit + Intel HD Graphics 3000
min: 4.75 avg: 8.7 median: 8.4 (3%) max: 13.02 fps
Cinebench R15 + Intel HD Graphics 4400 Cinebench R15 - Cinebench R15 OpenGL 64 Bit
min: 12.87 avg: 20.3 median: 20.4 (1%) max: 26.49 fps
Cinebench R15 OpenGL 64 Bit + Intel HD Graphics 3000 0 fps (0%)
Cinebench R15 OpenGL Ref. Match 64 Bit + Intel HD Graphics 4400 Cinebench R15 - Cinebench R15 OpenGL Ref. Match 64 Bit
min: 2.87 avg: 88.2 median: 98 (98%) max: 98 %
Cinebench R15 OpenGL Ref. Match 64 Bit + Intel HD Graphics 3000
min: 32.2 avg: 32.6 median: 32.6 (33%) max: 32.9 %
GFXBench 3.0 - GFXBench 3.0 Manhattan Offscreen
16.2 fps (1%)
GFXBench (DX / GLBenchmark) 2.7 + Intel HD Graphics 4400 GFXBench (DX / GLBenchmark) 2.7 - GFXBench T-Rex HD Offscreen C24Z16
min: 57 avg: 60.5 median: 60.5 (0%) max: 64 fps
LuxMark v2.0 64Bit - LuxMark v2.0 Room GPU
min: 117 avg: 154.1 median: 150 (1%) max: 222 Samples/s
LuxMark v2.0 64Bit - LuxMark v2.0 Sala GPU
min: 143 avg: 227.5 median: 234 (0%) max: 293 Samples/s
ComputeMark v2.1 - ComputeMark v2.1 Result
min: 384 avg: 542 median: 575 (1%) max: 613 Points
Average Benchmarks Intel HD Graphics 4400 → 0% n= Average Benchmarks Intel HD Graphics 3000 → 0% n=
- Bereich der Benchmarkergebnisse für diese Grafikkarte
- Durchschnittliche Benchmarkergebnisse für diese Grafikkarte
* Smaller numbers mean a higher performance
1 This benchmark is not used for the average calculation
Spiele-Benchmarks Die folgenden Benchmarks basieren auf unseren Spieletests mit Testnotebooks. Die Performance dieser Grafikkarte bei den gelisteten Spielen ist abhängig von der verwendeten CPU, Speicherausstattung, Treiber und auch Betriebssystem. Dadurch müssen die untenstehenden Werte nicht repräsentativ sein. Detaillierte Informationen über das verwendete System sehen Sie nach einem Klick auf den fps-Wert.
HD Graphics 4400:
9 [X] HP Probook 470 G2 G6W69EA Intel Core i7-4510U 2GHz
HD Graphics 4400
fps
HD Graphics 4400:
8.1 [X] HP Probook 470 G2 G6W69EA Intel Core i7-4510U 2GHz
HD Graphics 4400
fps
HD Graphics 4400:
8.8 [X] HP Probook 470 G2 G6W69EA Intel Core i7-4510U 2GHz
HD Graphics 4400
fps
HD Graphics 4400:
4.1 [X] HP Probook 470 G2 G6W69EA Intel Core i7-4510U 2GHz
HD Graphics 4400
fps
HD Graphics 4400:
7.9 [X] HP Probook 470 G2 G6W69EA Intel Core i7-4510U 2GHz
HD Graphics 4400
fps
HD Graphics 4400:
25.3 [X] HP Probook 470 G2 G6W69EA Intel Core i7-4510U 2GHz
HD Graphics 4400
fps
HD Graphics 4400:
8 [X] HP Probook 470 G2 G6W69EA Intel Core i7-4510U 2GHz
HD Graphics 4400
fps
HD Graphics 4400:
7.4 [X] HP Probook 470 G2 G6W69EA Intel Core i7-4510U 2GHz
HD Graphics 4400
fps
HD Graphics 4400:
11 [X] HP Probook 470 G2 G6W69EA Intel Core i7-4510U 2GHz
HD Graphics 4400
fps
HD Graphics 4400:
10.3 [X] HP Probook 470 G2 G6W69EA Intel Core i7-4510U 2GHz
HD Graphics 4400
min:
9 fps, max:
11 fps
fps
HD Graphics 4400:
8.3 [X] HP Probook 470 G2 G6W69EA Intel Core i7-4510U 2GHz
HD Graphics 4400
fps
HD Graphics 4400:
10 [X] HP Probook 470 G2 G6W69EA Intel Core i7-4510U 2GHz
HD Graphics 4400
fps
HD Graphics 4400:
20 [X] HP Probook 470 G2 G6W69EA Intel Core i7-4510U 2GHz
HD Graphics 4400
fps
HD Graphics 4400:
4 [X] HP Probook 470 G2 G6W69EA Intel Core i7-4510U 2GHz
HD Graphics 4400
fps
HD Graphics 4400:
8 [X] HP Probook 470 G2 G6W69EA Intel Core i7-4510U 2GHz
HD Graphics 4400
fps
HD Graphics 4400:
4 [X] HP Probook 470 G2 G6W69EA Intel Core i7-4510U 2GHz
HD Graphics 4400
fps
HD Graphics 4400:
15 [X] HP Probook 470 G2 G6W69EA Intel Core i7-4510U 2GHz
HD Graphics 4400
fps
HD Graphics 4400:
7.4 [X] HP Probook 470 G2 G6W69EA Intel Core i7-4510U 2GHz
HD Graphics 4400
fps
HD Graphics 4400:
15 [X] HP Probook 470 G2 G6W69EA Intel Core i7-4510U 2GHz
HD Graphics 4400
fps
HD Graphics 4400:
10.4 [X] HP Probook 470 G2 G6W69EA Intel Core i7-4510U 2GHz
HD Graphics 4400
fps
HD Graphics 4400:
28.8 [X] HP Probook 470 G2 G6W69EA Intel Core i7-4510U 2GHz
HD Graphics 4400
fps
HD Graphics 4400:
10.3 [X] HP Probook 470 G2 G6W69EA Intel Core i7-4510U 2GHz
HD Graphics 4400
fps
HD Graphics 4400:
9.2 [X] HP Probook 470 G2 G6W69EA Intel Core i7-4510U 2GHz
HD Graphics 4400
fps
HD Graphics 4400:
7.1 [X] HP Probook 470 G2 G6W69EA Intel Core i7-4510U 2GHz
HD Graphics 4400
fps
HD Graphics 4400:
10.1 [X] HP Probook 470 G2 G6W69EA Intel Core i7-4510U 2GHz
HD Graphics 4400
fps
HD Graphics 4400:
4 [X] HP Probook 470 G2 G6W69EA Intel Core i7-4510U 2GHz
HD Graphics 4400
fps
HD Graphics 4400:
5 [X] HP Probook 470 G2 G6W69EA Intel Core i7-4510U 2GHz
HD Graphics 4400
fps
HD Graphics 4400:
30.4 [X] HP Probook 470 G2 G6W69EA Intel Core i7-4510U 2GHz
HD Graphics 4400
fps
HD Graphics 4400:
7 [X] HP Probook 470 G2 G6W69EA Intel Core i7-4510U 2GHz
HD Graphics 4400
fps
HD Graphics 4400:
12 [X] HP Probook 470 G2 G6W69EA Intel Core i7-4510U 2GHz
HD Graphics 4400
fps
HD Graphics 4400:
7.9 [X] HP Probook 470 G2 G6W69EA Intel Core i7-4510U 2GHz
HD Graphics 4400
fps
HD Graphics 4400:
6.9 [X] HP Probook 470 G2 G6W69EA Intel Core i7-4510U 2GHz
HD Graphics 4400
fps
HD Graphics 4400:
5 [X] HP Probook 470 G2 G6W69EA Intel Core i7-4510U 2GHz
HD Graphics 4400
fps
HD Graphics 4400:
84.2 [X] HP Probook 470 G2 G6W69EA Intel Core i7-4510U 2GHz
HD Graphics 4400
fps
HD Graphics 4400:
9.6 [X] HP Probook 470 G2 G6W69EA Intel Core i7-4510U 2GHz
HD Graphics 4400
fps
HD Graphics 4400:
13.6 [X] HP Probook 470 G2 G6W69EA Intel Core i7-4510U 2GHz
HD Graphics 4400
fps
HD Graphics 4400:
10.8 [X] HP Probook 470 G2 G6W69EA Intel Core i7-4510U 2GHz
HD Graphics 4400
fps
HD Graphics 4400:
9.1 [X] HP Probook 470 G2 G6W69EA Intel Core i7-4510U 2GHz
HD Graphics 4400
fps
HD Graphics 4400:
46.5 [X] HP Probook 470 G2 G6W69EA Intel Core i7-4510U 2GHz
HD Graphics 4400
fps
HD Graphics 4400:
11 [X] HP Probook 470 G2 G6W69EA Intel Core i7-4510U 2GHz
HD Graphics 4400
fps
HD Graphics 4400:
9.6 [X] HP Probook 470 G2 G6W69EA Intel Core i7-4510U 2GHz
HD Graphics 4400
fps
HD Graphics 4400:
11.5 [X] HP Probook 470 G2 G6W69EA Intel Core i7-4510U 2GHz
HD Graphics 4400
fps
HD Graphics 4400:
5 [X] HP Probook 470 G2 G6W69EA Intel Core i7-4510U 2GHz
HD Graphics 4400
fps
HD Graphics 4400:
10 [X] HP Probook 470 G2 G6W69EA Intel Core i7-4510U 2GHz
HD Graphics 4400
fps
HD Graphics 4400:
8 [X] HP Probook 470 G2 G6W69EA Intel Core i7-4510U 2GHz
HD Graphics 4400
fps
HD Graphics 4400:
7 [X] HP Probook 470 G2 G6W69EA Intel Core i7-4510U 2GHz
HD Graphics 4400
fps
HD Graphics 4400:
13 [X] HP Probook 470 G2 G6W69EA Intel Core i7-4510U 2GHz
HD Graphics 4400
fps
HD Graphics 4400:
38.9 [X] HP Probook 470 G2 G6W69EA Intel Core i7-4510U 2GHz
HD Graphics 4400
fps
HD Graphics 4400:
7 [X] HP Probook 470 G2 G6W69EA Intel Core i7-4510U 2GHz
HD Graphics 4400
fps
HD Graphics 4400:
18 [X] HP Probook 470 G2 G6W69EA Intel Core i7-4510U 2GHz
HD Graphics 4400
fps
HD Graphics 4400:
13 [X] HP Probook 470 G2 G6W69EA Intel Core i7-4510U 2GHz
HD Graphics 4400
fps
HD Graphics 4400:
22.6 [X] HP Probook 470 G2 G6W69EA Intel Core i7-4510U 2GHz
HD Graphics 4400
fps
HD Graphics 4400:
45 [X] HP Probook 470 G2 G6W69EA Intel Core i7-4510U 2GHz
HD Graphics 4400
fps
HD Graphics 3000:
48.4 [X] Acer Aspire M3-581TG Intel Core i7-2637M 1.7GHz
HD Graphics 3000
min:
40 fps
fps
HD Graphics 4400:
40 [X] HP Probook 470 G2 G6W69EA Intel Core i7-4510U 2GHz
HD Graphics 4400
fps
HD Graphics 4400:
21.2 [X] HP Probook 470 G2 G6W69EA Intel Core i7-4510U 2GHz
HD Graphics 4400
fps
HD Graphics 4400:
8 [X] HP Probook 470 G2 G6W69EA Intel Core i7-4510U 2GHz
HD Graphics 4400
fps
HD Graphics 4400:
65.3 [X] HP Probook 470 G2 G6W69EA Intel Core i7-4510U 2GHz
HD Graphics 4400
fps
HD Graphics 4400:
19.3 [X] HP Probook 470 G2 G6W69EA Intel Core i7-4510U 2GHz
HD Graphics 4400
fps
HD Graphics 4400:
12.9 [X] HP Probook 470 G2 G6W69EA Intel Core i7-4510U 2GHz
HD Graphics 4400
fps
HD Graphics 4400:
5.6 [X] HP Probook 470 G2 G6W69EA Intel Core i7-4510U 2GHz
HD Graphics 4400
fps
HD Graphics 4400:
13.4 [X] HP Probook 470 G2 G6W69EA Intel Core i7-4510U 2GHz
HD Graphics 4400
fps
HD Graphics 4400:
10 [X] HP Probook 470 G2 G6W69EA Intel Core i7-4510U 2GHz
HD Graphics 4400
fps
HD Graphics 4400:
10.1 [X] HP Probook 470 G2 G6W69EA Intel Core i7-4510U 2GHz
HD Graphics 4400
fps
HD Graphics 4400:
13.1 [X] HP Probook 470 G2 G6W69EA Intel Core i7-4510U 2GHz
HD Graphics 4400
fps
HD Graphics 4400:
22.1 [X] HP Probook 470 G2 G6W69EA Intel Core i7-4510U 2GHz
HD Graphics 4400
fps
HD Graphics 4400:
9.6 [X] HP Probook 470 G2 G6W69EA Intel Core i7-4510U 2GHz
HD Graphics 4400
fps
HD Graphics 4400:
8.4 [X] HP Probook 470 G2 G6W69EA Intel Core i7-4510U 2GHz
HD Graphics 4400
fps
HD Graphics 4400:
19.5 [X] HP Probook 470 G2 G6W69EA Intel Core i7-4510U 2GHz
HD Graphics 4400
fps
HD Graphics 4400:
12.7 [X] HP Probook 470 G2 G6W69EA Intel Core i7-4510U 2GHz
HD Graphics 4400
fps
HD Graphics 4400:
49.3 [X] HP Probook 470 G2 G6W69EA Intel Core i7-4510U 2GHz
HD Graphics 4400
fps
HD Graphics 3000:
22.1 [X] Acer Aspire M3-581TG Intel Core i7-2637M 1.7GHz
HD Graphics 3000
min:
13 fps, max:
27 fps
fps
HD Graphics 4400:
27.1 [X] HP Probook 470 G2 G6W69EA Intel Core i7-4510U 2GHz
HD Graphics 4400
fps
HD Graphics 3000:
13.2 [X] Acer Aspire M3-581TG Intel Core i7-2637M 1.7GHz
HD Graphics 3000
min:
6 fps, max:
17 fps
fps
HD Graphics 4400:
8.2 [X] HP Probook 470 G2 G6W69EA Intel Core i7-4510U 2GHz
HD Graphics 4400
fps
HD Graphics 4400:
14.1 [X] HP Probook 470 G2 G6W69EA Intel Core i7-4510U 2GHz
HD Graphics 4400
fps
HD Graphics 4400:
9 [X] HP Probook 470 G2 G6W69EA Intel Core i7-4510U 2GHz
HD Graphics 4400
fps
HD Graphics 4400:
20.3 [X] HP Probook 470 G2 G6W69EA Intel Core i7-4510U 2GHz
HD Graphics 4400
fps
HD Graphics 4400:
7.5 [X] HP Probook 470 G2 G6W69EA Intel Core i7-4510U 2GHz
HD Graphics 4400
fps
HD Graphics 4400:
3.8 [X] HP Probook 470 G2 G6W69EA Intel Core i7-4510U 2GHz
HD Graphics 4400
fps
HD Graphics 4400:
33.9 [X] HP Probook 470 G2 G6W69EA Intel Core i7-4510U 2GHz
HD Graphics 4400
fps
HD Graphics 4400:
22.3 [X] HP Probook 470 G2 G6W69EA Intel Core i7-4510U 2GHz
HD Graphics 4400
fps
HD Graphics 4400:
12.8 [X] HP Probook 470 G2 G6W69EA Intel Core i7-4510U 2GHz
HD Graphics 4400
fps
HD Graphics 4400:
8.2 [X] HP Probook 470 G2 G6W69EA Intel Core i7-4510U 2GHz
HD Graphics 4400
fps
HD Graphics 4400:
20.7 [X] Lenovo B50-70 MCC2GGE Intel Core i3-4030U 1.9GHz
HD Graphics 4400
fps
HD Graphics 4400:
10.3 [X] Lenovo B50-70 MCC2GGE Intel Core i3-4030U 1.9GHz
HD Graphics 4400
fps
HD Graphics 4400:
31.3 [X] HP Probook 470 G2 G6W69EA Intel Core i7-4510U 2GHz
HD Graphics 4400
fps
HD Graphics 3000:
0 (!) [X] Acer Aspire M3-581TG Intel Core i7-2637M 1.7GHz
HD Graphics 3000
fps
HD Graphics 4400:
20.4 [X] HP Probook 470 G2 G6W69EA Intel Core i7-4510U 2GHz
HD Graphics 4400
fps
HD Graphics 4400:
8.5 [X] Lenovo B50-70 MCC2GGE Intel Core i3-4030U 1.9GHz
HD Graphics 4400
fps
HD Graphics 4400:
5.9 [X] Lenovo B50-70 MCC2GGE Intel Core i3-4030U 1.9GHz
HD Graphics 4400
fps
HD Graphics 4400:
14.2 [X] Lenovo B50-70 MCC2GGE Intel Core i3-4030U 1.9GHz
HD Graphics 4400
fps
HD Graphics 4400:
7.9 [X] Lenovo B50-70 MCC2GGE Intel Core i3-4030U 1.9GHz
HD Graphics 4400
fps
HD Graphics 4400:
12 [X] Lenovo B50-70 MCC2GGE Intel Core i3-4030U 1.9GHz
HD Graphics 4400
fps
HD Graphics 4400:
13.1 [X] Lenovo B50-70 MCC2GGE Intel Core i3-4030U 1.9GHz
HD Graphics 4400
fps
HD Graphics 4400:
13.1 [X] Lenovo B50-70 MCC2GGE Intel Core i3-4030U 1.9GHz
HD Graphics 4400
fps
HD Graphics 4400:
7.6 [X] Lenovo B50-70 MCC2GGE Intel Core i3-4030U 1.9GHz
HD Graphics 4400
fps
HD Graphics 4400:
20.2 [X] Lenovo B50-70 MCC2GGE Intel Core i3-4030U 1.9GHz
HD Graphics 4400
fps
HD Graphics 4400:
12.6 [X] Lenovo B50-70 MCC2GGE Intel Core i3-4030U 1.9GHz
HD Graphics 4400
fps
HD Graphics 4400:
17.6 [X] Lenovo B50-70 MCC2GGE Intel Core i3-4030U 1.9GHz
HD Graphics 4400
fps
HD Graphics 4400:
14.5 [X] Lenovo B50-70 MCC2GGE Intel Core i3-4030U 1.9GHz
HD Graphics 4400
fps
HD Graphics 4400:
24.9 [X] Lenovo B50-70 MCC2GGE Intel Core i3-4030U 1.9GHz
HD Graphics 4400
fps
HD Graphics 4400:
14.3 [X] Lenovo B50-70 MCC2GGE Intel Core i3-4030U 1.9GHz
HD Graphics 4400
fps
HD Graphics 4400:
4.7 [X] HP Probook 470 G2 G6W69EA Intel Core i7-4510U 2GHz
HD Graphics 4400
fps
HD Graphics 4400:
20.3 [X] Lenovo B50-70 MCC2GGE Intel Core i3-4030U 1.9GHz
HD Graphics 4400
fps
HD Graphics 4400:
12.1 [X] Lenovo B50-70 MCC2GGE Intel Core i3-4030U 1.9GHz
HD Graphics 4400
fps
HD Graphics 4400:
21 [X] Lenovo B50-70 MCC2GGE Intel Core i3-4030U 1.9GHz
HD Graphics 4400
fps
HD Graphics 4400:
9.2 [X] Lenovo B50-70 MCC2GGE Intel Core i3-4030U 1.9GHz
HD Graphics 4400
fps
HD Graphics 4400:
49.7 [X] Lenovo B50-70 MCC2GGE Intel Core i3-4030U 1.9GHz
HD Graphics 4400
fps
HD Graphics 3000:
0 (!) [X] Acer Aspire M3-581TG Intel Core i7-2637M 1.7GHz
HD Graphics 3000
fps
HD Graphics 4400:
25.3 [X] Lenovo B50-70 MCC2GGE Intel Core i3-4030U 1.9GHz
HD Graphics 4400
fps
HD Graphics 4400:
43.6 [X] Lenovo B50-70 MCC2GGE Intel Core i3-4030U 1.9GHz
HD Graphics 4400
fps
HD Graphics 3000:
25.1 [X] Acer Aspire M3-581TG Intel Core i7-2637M 1.7GHz
HD Graphics 3000
38 [X] Compal Barebone Intel Core i7-2860QM 2.5GHz
HD Graphics 3000
min:
29 fps, max:
49 fps
~ 32 fps
HD Graphics 4400:
31.2 [X] Lenovo B50-70 MCC2GGE Intel Core i3-4030U 1.9GHz
HD Graphics 4400
fps
HD Graphics 3000:
15.6 [X] Acer Aspire M3-581TG Intel Core i7-2637M 1.7GHz
HD Graphics 3000
min:
11 fps, max:
21 fps
21.7 [X] Compal Barebone Intel Core i7-2860QM 2.5GHz
HD Graphics 3000
min:
14 fps, max:
31 fps
~ 19 fps
HD Graphics 4400:
35.2 [X] Lenovo B50-70 MCC2GGE Intel Core i3-4030U 1.9GHz
HD Graphics 4400
fps
HD Graphics 4400:
23.5 [X] Lenovo B50-70 MCC2GGE Intel Core i3-4030U 1.9GHz
HD Graphics 4400
fps
HD Graphics 4400:
60.3 [X] HP Probook 470 G2 G6W69EA Intel Core i7-4510U 2GHz
HD Graphics 4400
fps
HD Graphics 3000:
48.1 [X] Compal Barebone Intel Core i7-2860QM 2.5GHz
HD Graphics 3000
min:
41.1 fps
50.9 [X] Acer Aspire M3-581TG Intel Core i7-2637M 1.7GHz
HD Graphics 3000
min:
42 fps
~ 50 fps
HD Graphics 4400:
31.5 [X] HP Probook 470 G2 G6W69EA Intel Core i7-4510U 2GHz
HD Graphics 4400
fps
HD Graphics 3000:
19.4 [X] Acer Aspire M3-581TG Intel Core i7-2637M 1.7GHz
HD Graphics 3000
min:
17 fps
21.3 [X] Compal Barebone Intel Core i7-2860QM 2.5GHz
HD Graphics 3000
min:
19.8 fps
~ 20 fps
HD Graphics 4400:
14.5 [X] HP Probook 470 G2 G6W69EA Intel Core i7-4510U 2GHz
HD Graphics 4400
fps
HD Graphics 3000:
8.3 [X] Compal Barebone Intel Core i7-2860QM 2.5GHz
HD Graphics 3000
min:
7.9 fps
fps
HD Graphics 3000:
7.4 [X] Compal Barebone Intel Core i7-2860QM 2.5GHz
HD Graphics 3000
min:
7.1 fps
fps
HD Graphics 4400:
10.7 [X] Lenovo B50-70 MCC2GGE Intel Core i3-4030U 1.9GHz
HD Graphics 4400
fps
HD Graphics 4400:
6.9 [X] Lenovo B50-70 MCC2GGE Intel Core i3-4030U 1.9GHz
HD Graphics 4400
fps
HD Graphics 4400:
77.8 [X] Lenovo B50-70 MCC2GGE Intel Core i3-4030U 1.9GHz
HD Graphics 4400
fps
HD Graphics 3000:
0 (!) [X] Acer Aspire M3-581TG Intel Core i7-2637M 1.7GHz
HD Graphics 3000
fps
HD Graphics 4400:
19.6 [X] Lenovo B50-70 MCC2GGE Intel Core i3-4030U 1.9GHz
HD Graphics 4400
fps
HD Graphics 4400:
22.8 [X] HP Probook 470 G2 G6W69EA Intel Core i7-4510U 2GHz
HD Graphics 4400
fps
HD Graphics 3000:
7.5 [X] Acer Aspire M3-581TG Intel Core i7-2637M 1.7GHz
HD Graphics 3000
min:
4 fps, max:
17 fps
fps
HD Graphics 4400:
17.8 [X] HP Probook 470 G2 G6W69EA Intel Core i7-4510U 2GHz
HD Graphics 4400
fps
HD Graphics 4400:
29.3 [X] Lenovo B50-70 MCC2GGE Intel Core i3-4030U 1.9GHz
HD Graphics 4400
fps
HD Graphics 4400:
20.7 [X] Lenovo B50-70 MCC2GGE Intel Core i3-4030U 1.9GHz
HD Graphics 4400
fps
HD Graphics 4400:
13.8 [X] Lenovo B50-70 MCC2GGE Intel Core i3-4030U 1.9GHz
HD Graphics 4400
fps
HD Graphics 3000:
0 (!) [X] Acer Aspire M3-581TG Intel Core i7-2637M 1.7GHz
HD Graphics 3000
fps
HD Graphics 4400:
10.1 [X] Lenovo B50-70 MCC2GGE Intel Core i3-4030U 1.9GHz
HD Graphics 4400
fps
HD Graphics 4400:
13.4 [X] Acer Travelmate P276-MG-56FU Intel Core i5-4210U 1.7GHz
HD Graphics 4400
14.8 [X] Lenovo ThinkPad T440s 20AQ-0069GE Intel Core i7-4600U 2.1GHz
HD Graphics 4400
~ 14 fps
HD Graphics 4400:
10.2 [X] Acer Travelmate P276-MG-56FU Intel Core i5-4210U 1.7GHz
HD Graphics 4400
11 [X] Lenovo ThinkPad T440s 20AQ-0069GE Intel Core i7-4600U 2.1GHz
HD Graphics 4400
~ 11 fps
HD Graphics 4400:
5.9 [X] Lenovo ThinkPad T440s 20AQ-0069GE Intel Core i7-4600U 2.1GHz
HD Graphics 4400
fps
HD Graphics 4400:
13.1 14.6 16.1 [X] Lenovo ThinkPad T440s 20AQ-0069GE Intel Core i7-4600U 2.1GHz
HD Graphics 4400
19.7 ~ 16 fps
HD Graphics 4400:
6 8.1 10.9 [X] Lenovo ThinkPad T440s 20AQ-0069GE Intel Core i7-4600U 2.1GHz
HD Graphics 4400
12 ~ 9 fps
HD Graphics 4400:
3.4 4.2 [X] Lenovo ThinkPad T440s 20AQ-0069GE Intel Core i7-4600U 2.1GHz
HD Graphics 4400
~ 4 fps
HD Graphics 4400:
13 [X] Acer Travelmate P276-MG-56FU Intel Core i5-4210U 1.7GHz
HD Graphics 4400
14 (!) [X] Lenovo ThinkPad T440s 20AQ-0069GE Intel Core i7-4600U 2.1GHz
HD Graphics 4400
~ 14 fps
HD Graphics 3000:
0 (!) [X] Acer Aspire M3-581TG Intel Core i7-2637M 1.7GHz
HD Graphics 3000
fps
HD Graphics 4400:
9.9 [X] Acer Travelmate P276-MG-56FU Intel Core i5-4210U 1.7GHz
HD Graphics 4400
9.9 (!) [X] Lenovo ThinkPad T440s 20AQ-0069GE Intel Core i7-4600U 2.1GHz
HD Graphics 4400
~ 10 fps
HD Graphics 4400:
6.1 [X] Lenovo ThinkPad T440s 20AQ-0069GE Intel Core i7-4600U 2.1GHz
HD Graphics 4400
6.5 [X] Acer Travelmate P276-MG-56FU Intel Core i5-4210U 1.7GHz
HD Graphics 4400
~ 6 fps
HD Graphics 4400:
3.9 [X] Lenovo ThinkPad T440s 20AQ-0069GE Intel Core i7-4600U 2.1GHz
HD Graphics 4400
fps
HD Graphics 4400:
20.9 [X] Lenovo ThinkPad T440s 20AQ-0069GE Intel Core i7-4600U 2.1GHz
HD Graphics 4400
21.8 [X] Acer Travelmate P276-MG-56FU Intel Core i5-4210U 1.7GHz
HD Graphics 4400
~ 21 fps
HD Graphics 4400:
11.6 [X] Acer Travelmate P276-MG-56FU Intel Core i5-4210U 1.7GHz
HD Graphics 4400
13.1 [X] Lenovo ThinkPad T440s 20AQ-0069GE Intel Core i7-4600U 2.1GHz
HD Graphics 4400
~ 12 fps
HD Graphics 4400:
23.5 [X] Acer Travelmate P276-MG-56FU Intel Core i5-4210U 1.7GHz
HD Graphics 4400
fps
HD Graphics 3000:
9.5 [X] Acer Aspire M3-581TG Intel Core i7-2637M 1.7GHz
HD Graphics 3000
min:
4 fps, max:
15 fps
fps
HD Graphics 4400:
10 [X] Acer Travelmate P276-MG-56FU Intel Core i5-4210U 1.7GHz
HD Graphics 4400
fps
HD Graphics 4400:
40 49 [X] Lenovo ThinkPad T440s 20AQ-0069GE Intel Core i7-4600U 2.1GHz
HD Graphics 4400
~ 45 fps
HD Graphics 4400:
26 31 [X] Lenovo ThinkPad T440s 20AQ-0069GE Intel Core i7-4600U 2.1GHz
HD Graphics 4400
~ 29 fps
HD Graphics 4400:
18 [X] Lenovo ThinkPad T440s 20AQ-0069GE Intel Core i7-4600U 2.1GHz
HD Graphics 4400
fps
HD Graphics 4400:
14 [X] Lenovo ThinkPad T440s 20AQ-0069GE Intel Core i7-4600U 2.1GHz
HD Graphics 4400
fps
HD Graphics 4400:
10.4 [X] Lenovo ThinkPad T440s 20AQ-0069GE Intel Core i7-4600U 2.1GHz
HD Graphics 4400
fps
HD Graphics 4400:
6.2 [X] Lenovo ThinkPad T440s 20AQ-0069GE Intel Core i7-4600U 2.1GHz
HD Graphics 4400
fps
HD Graphics 4400:
12.1 [X] Lenovo ThinkPad T440s 20AQ-0069GE Intel Core i7-4600U 2.1GHz
HD Graphics 4400
15.8 ~ 14 fps
HD Graphics 4400:
8.1 [X] Lenovo ThinkPad T440s 20AQ-0069GE Intel Core i7-4600U 2.1GHz
HD Graphics 4400
9.8 ~ 9 fps
HD Graphics 4400:
20 29.3 [X] Lenovo ThinkPad T440s 20AQ-0069GE Intel Core i7-4600U 2.1GHz
HD Graphics 4400
33.3 ~ 28 fps
HD Graphics 4400:
15.1 [X] Lenovo ThinkPad T440s 20AQ-0069GE Intel Core i7-4600U 2.1GHz
HD Graphics 4400
18.5 20.6 ~ 18 fps
HD Graphics 4400:
10 [X] Lenovo ThinkPad T440s 20AQ-0069GE Intel Core i7-4600U 2.1GHz
HD Graphics 4400
10.8 ~ 10 fps
HD Graphics 4400:
16 16.5 17.1 [X] Lenovo ThinkPad T440s 20AQ-0069GE Intel Core i7-4600U 2.1GHz
HD Graphics 4400
21.4 ~ 18 fps
HD Graphics 4400:
10 10.2 10.8 11.7 [X] Lenovo ThinkPad T440s 20AQ-0069GE Intel Core i7-4600U 2.1GHz
HD Graphics 4400
~ 11 fps
HD Graphics 4400:
6.5 6.5 [X] Lenovo ThinkPad T440s 20AQ-0069GE Intel Core i7-4600U 2.1GHz
HD Graphics 4400
~ 7 fps
HD Graphics 4400:
29.1 [X] Acer Aspire V 15 Nitro VN7-571G-56NX Intel Core i5-4210U 1.7GHz
HD Graphics 4400
30.1 [X] Lenovo ThinkPad T440s 20AQ-0069GE Intel Core i7-4600U 2.1GHz
HD Graphics 4400
32 ~ 30 fps
HD Graphics 4400:
18.1 [X] Acer Aspire V 15 Nitro VN7-571G-56NX Intel Core i5-4210U 1.7GHz
HD Graphics 4400
20.8 23.7 [X] Lenovo ThinkPad T440s 20AQ-0069GE Intel Core i7-4600U 2.1GHz
HD Graphics 4400
~ 21 fps
HD Graphics 4400:
12.5 [X] Acer Aspire V 15 Nitro VN7-571G-56NX Intel Core i5-4210U 1.7GHz
HD Graphics 4400
15.2 [X] Lenovo ThinkPad T440s 20AQ-0069GE Intel Core i7-4600U 2.1GHz
HD Graphics 4400
~ 14 fps
HD Graphics 4400:
121 140.3 152.8 [X] Acer Aspire V 15 Nitro VN7-571G-56NX Intel Core i5-4210U 1.7GHz
HD Graphics 4400
180 [X] Lenovo ThinkPad T440s 20AQ-0069GE Intel Core i7-4600U 2.1GHz
HD Graphics 4400
~ 149 fps
HD Graphics 4400:
26 27 29.9 [X] Acer Aspire V 15 Nitro VN7-571G-56NX Intel Core i5-4210U 1.7GHz
HD Graphics 4400
33 [X] Lenovo ThinkPad T440s 20AQ-0069GE Intel Core i7-4600U 2.1GHz
HD Graphics 4400
~ 29 fps
HD Graphics 4400:
11.6 [X] Acer Aspire V 15 Nitro VN7-571G-56NX Intel Core i5-4210U 1.7GHz
HD Graphics 4400
13.2 [X] Lenovo ThinkPad T440s 20AQ-0069GE Intel Core i7-4600U 2.1GHz
HD Graphics 4400
~ 12 fps
HD Graphics 3000:
17 [X] Acer Aspire M3-581TG Intel Core i7-2637M 1.7GHz
HD Graphics 3000
min:
13 fps, max:
22 fps
fps
HD Graphics 3000:
9.5 [X] Acer Aspire M3-581TG Intel Core i7-2637M 1.7GHz
HD Graphics 3000
min:
6 fps, max:
14 fps
fps
HD Graphics 3000:
4.3 [X] Acer Aspire M3-581TG Intel Core i7-2637M 1.7GHz
HD Graphics 3000
fps
HD Graphics 3000:
3.4 [X] Acer Aspire M3-581TG Intel Core i7-2637M 1.7GHz
HD Graphics 3000
fps
HD Graphics 4400:
56 60.7 65 66.4 97.2 [X] Lenovo ThinkPad T440s 20AQ-0069GE Intel Core i7-4600U 2.1GHz
HD Graphics 4400
98.3 ~ 74 fps
HD Graphics 3000:
50 [X] Acer Aspire M3-581TG Intel Core i7-2637M 1.7GHz
HD Graphics 3000
min:
37 fps, max:
65 fps
82.5 [X] i7-2600K HD Graphics 3000 Intel Core i7-2600K 3.4GHz
HD Graphics 3000
min:
59 fps, max:
109 fps
~ 66 fps
HD Graphics 4400:
21 21 22.1 24.4 27.8 [X] Lenovo ThinkPad T440s 20AQ-0069GE Intel Core i7-4600U 2.1GHz
HD Graphics 4400
34.2 ~ 25 fps
HD Graphics 3000:
17.8 [X] Acer Aspire M3-581TG Intel Core i7-2637M 1.7GHz
HD Graphics 3000
min:
14 fps, max:
25 fps
27.2 [X] i7-2600K HD Graphics 3000 Intel Core i7-2600K 3.4GHz
HD Graphics 3000
min:
22 fps, max:
36 fps
~ 23 fps
HD Graphics 4400:
12.9 13 14 [X] Lenovo ThinkPad T440s 20AQ-0069GE Intel Core i7-4600U 2.1GHz
HD Graphics 4400
15.8 ~ 14 fps
HD Graphics 3000:
12.5 [X] Acer Aspire M3-581TG Intel Core i7-2637M 1.7GHz
HD Graphics 3000
min:
12.5 fps, max:
14 fps
13.2 [X] i7-2600K HD Graphics 3000 Intel Core i7-2600K 3.4GHz
HD Graphics 3000
min:
13 fps, max:
16 fps
~ 13 fps
HD Graphics 4400:
12 12.5 12.5 [X] Lenovo ThinkPad T440s 20AQ-0069GE Intel Core i7-4600U 2.1GHz
HD Graphics 4400
~ 12 fps
HD Graphics 3000:
12.5 [X] Acer Aspire M3-581TG Intel Core i7-2637M 1.7GHz
HD Graphics 3000
min:
12.5 fps, max:
12.5 fps
fps
HD Graphics 4400:
12.2 15.2 15.8 [X] Lenovo ThinkPad T440s 20AQ-0069GE Intel Core i7-4600U 2.1GHz
HD Graphics 4400
~ 14 fps
HD Graphics 3000:
0 (!) [X] Acer Aspire M3-581TG Intel Core i7-2637M 1.7GHz
HD Graphics 3000
fps
HD Graphics 4400:
9.2 9.6 [X] Lenovo ThinkPad T440s 20AQ-0069GE Intel Core i7-4600U 2.1GHz
HD Graphics 4400
12.3 ~ 10 fps
HD Graphics 4400:
1.5 3.2 ~ 2 fps
HD Graphics 3000:
0 (!) [X] Acer Aspire M3-581TG Intel Core i7-2637M 1.7GHz
HD Graphics 3000
fps
HD Graphics 4400:
38.1 fps
HD Graphics 3000:
22.5 [X] Acer Aspire M3-581TG Intel Core i7-2637M 1.7GHz
HD Graphics 3000
min:
17 fps, max:
26 fps
fps
HD Graphics 4400:
20.6 fps
HD Graphics 3000:
14.8 [X] Acer Aspire M3-581TG Intel Core i7-2637M 1.7GHz
HD Graphics 3000
min:
12 fps, max:
19 fps
fps
HD Graphics 4400:
12.4 fps
HD Graphics 4400:
30.1 fps
HD Graphics 3000:
0 (!) [X] Acer Aspire M3-581TG Intel Core i7-2637M 1.7GHz
HD Graphics 3000
fps
HD Graphics 4400:
10.9 fps
HD Graphics 4400:
6 7 7 7.3 7.5 7.6 7.7 [X] Asus B551LA-CF361G Intel Core i5-4210U 1.7GHz
HD Graphics 4400
7.8 7.8 7.9 7.9 8.3 8.3 [X] Dell Vostro 3546 JAN15HSW1601_1K9_Win Intel Core i3-4005U 1.7GHz
HD Graphics 4400
8.5 8.5 8.7 9 9 [X] Lenovo ThinkPad T440s 20AQ-0069GE Intel Core i7-4600U 2.1GHz
HD Graphics 4400
9.3 [X] Lenovo B50-70 59-407828 Intel Core i5-4210U 1.7GHz
HD Graphics 4400
~ 8 fps
HD Graphics 4400:
3.9 4 4.8 5.5 5.9 6 6.2 6.2 6.5 [X] Asus B551LA-CF361G Intel Core i5-4210U 1.7GHz
HD Graphics 4400
6.8 [X] Dell Vostro 3546 JAN15HSW1601_1K9_Win Intel Core i3-4005U 1.7GHz
HD Graphics 4400
7 7.1 7.2 7.2 7.5 [X] Lenovo ThinkPad T440s 20AQ-0069GE Intel Core i7-4600U 2.1GHz
HD Graphics 4400
7.8 [X] Lenovo B50-70 59-407828 Intel Core i5-4210U 1.7GHz
HD Graphics 4400
~ 6 fps
HD Graphics 4400:
1.2 3.1 [X] Asus B551LA-CF361G Intel Core i5-4210U 1.7GHz
HD Graphics 4400
3.2 3.3 3.6 [X] Lenovo B50-70 59-407828 Intel Core i5-4210U 1.7GHz
HD Graphics 4400
3.8 3.9 4.3 ~ 3 fps
HD Graphics 4400:
20.2 [X] HP Pavilion TouchSmart 15-n010sg Intel Core i7-4500U 1.8GHz
HD Graphics 4400
23.4 ~ 22 fps
HD Graphics 3000:
9.2 [X] Acer Aspire M3-581TG Intel Core i7-2637M 1.7GHz
HD Graphics 3000
min:
5 fps, max:
18 fps
fps
HD Graphics 4400:
14.2 [X] HP Pavilion TouchSmart 15-n010sg Intel Core i7-4500U 1.8GHz
HD Graphics 4400
16.3 ~ 15 fps
HD Graphics 4400:
12.8 fps
HD Graphics 4400:
30.2 fps
HD Graphics 3000:
14.6 [X] Acer Aspire M3-581TG Intel Core i7-2637M 1.7GHz
HD Graphics 3000
21.5 [X] Compal Barebone Intel Core i7-2860QM 2.5GHz
HD Graphics 3000
~ 18 fps
HD Graphics 4400:
18.4 fps
HD Graphics 3000:
8 [X] Acer Aspire M3-581TG Intel Core i7-2637M 1.7GHz
HD Graphics 3000
11.3 [X] Compal Barebone Intel Core i7-2860QM 2.5GHz
HD Graphics 3000
~ 10 fps
HD Graphics 3000:
4 [X] Acer Aspire M3-581TG Intel Core i7-2637M 1.7GHz
HD Graphics 3000
5.7 [X] Compal Barebone Intel Core i7-2860QM 2.5GHz
HD Graphics 3000
~ 5 fps
HD Graphics 3000:
2.9 [X] Acer Aspire M3-581TG Intel Core i7-2637M 1.7GHz
HD Graphics 3000
3.9 [X] Compal Barebone Intel Core i7-2860QM 2.5GHz
HD Graphics 3000
~ 3 fps
HD Graphics 4400:
16.7 [X] HP Pavilion TouchSmart 15-n010sg Intel Core i7-4500U 1.8GHz
HD Graphics 4400
fps
HD Graphics 4400:
13.2 [X] HP Pavilion TouchSmart 15-n010sg Intel Core i7-4500U 1.8GHz
HD Graphics 4400
fps
HD Graphics 3000:
0 (!) [X] Acer Aspire M3-581TG Intel Core i7-2637M 1.7GHz
HD Graphics 3000
fps
HD Graphics 3000:
32 [X] Schenker Xesia M501 Intel Core i7-2630QM 2GHz
HD Graphics 3000
fps
HD Graphics 3000:
21 [X] Schenker Xesia M501 Intel Core i7-2630QM 2GHz
HD Graphics 3000
fps
HD Graphics 3000:
26 [X] Acer Aspire M3-581TG Intel Core i7-2637M 1.7GHz
HD Graphics 3000
min:
19 fps
34 [X] Schenker Xesia M501 Intel Core i7-2630QM 2GHz
HD Graphics 3000
~ 30 fps
HD Graphics 3000:
19 [X] Acer Aspire M3-581TG Intel Core i7-2637M 1.7GHz
HD Graphics 3000
min:
14 fps
24 [X] Schenker Xesia M501 Intel Core i7-2630QM 2GHz
HD Graphics 3000
~ 22 fps
HD Graphics 3000:
15 [X] Acer Aspire M3-581TG Intel Core i7-2637M 1.7GHz
HD Graphics 3000
min:
12 fps
17 [X] Schenker Xesia M501 Intel Core i7-2630QM 2GHz
HD Graphics 3000
~ 16 fps
HD Graphics 3000:
12 [X] Schenker Xesia M501 Intel Core i7-2630QM 2GHz
HD Graphics 3000
fps
HD Graphics 3000:
124.9 [X] Schenker Xesia M501 Intel Core i7-2630QM 2GHz
HD Graphics 3000
fps
HD Graphics 3000:
58 [X] Acer Aspire M3-581TG Intel Core i7-2637M 1.7GHz
HD Graphics 3000
min:
46 fps
63.6 [X] Schenker Xesia M501 Intel Core i7-2630QM 2GHz
HD Graphics 3000
~ 61 fps
HD Graphics 3000:
30.5 [X] Acer Aspire M3-581TG Intel Core i7-2637M 1.7GHz
HD Graphics 3000
min:
25 fps
34.2 [X] Schenker Xesia M501 Intel Core i7-2630QM 2GHz
HD Graphics 3000
~ 32 fps
HD Graphics 3000:
17 [X] Schenker Xesia M501 Intel Core i7-2630QM 2GHz
HD Graphics 3000
18 [X] Acer Aspire M3-581TG Intel Core i7-2637M 1.7GHz
HD Graphics 3000
~ 18 fps
HD Graphics 3000:
18.4 [X] Acer Aspire M3-581TG Intel Core i7-2637M 1.7GHz
HD Graphics 3000
min:
15 fps
19.2 [X] Schenker Xesia M501 Intel Core i7-2630QM 2GHz
HD Graphics 3000
~ 19 fps
HD Graphics 4400:
13 20.7 22 22.5 22.7 [X] Dell Vostro 3546 JAN15HSW1601_1K9_Win Intel Core i3-4005U 1.7GHz
HD Graphics 4400
23.3 23.5 [X] Asus B551LA-CF361G Intel Core i5-4210U 1.7GHz
HD Graphics 4400
26 26.1 [X] Asus PU551LA-XO359G Intel Core i3-4030U 1.9GHz
HD Graphics 4400
26.7 27.4 27.5 27.9 28.3 31 ~ 25 fps
HD Graphics 3000:
14 [X] Acer Aspire M3-581TG Intel Core i7-2637M 1.7GHz
HD Graphics 3000
min:
12 fps
14.2 [X] Schenker Xesia M501 Intel Core i7-2630QM 2GHz
HD Graphics 3000
~ 14 fps
HD Graphics 4400:
11 16 16.4 16.5 17 17.1 [X] Dell Vostro 3546 JAN15HSW1601_1K9_Win Intel Core i3-4005U 1.7GHz
HD Graphics 4400
17.3 [X] Asus B551LA-CF361G Intel Core i5-4210U 1.7GHz
HD Graphics 4400
17.5 19.9 19.9 [X] Asus PU551LA-XO359G Intel Core i3-4030U 1.9GHz
HD Graphics 4400
20.1 20.2 20.5 21.1 24 ~ 18 fps
HD Graphics 4400:
4 5.1 [X] Asus B551LA-CF361G Intel Core i5-4210U 1.7GHz
HD Graphics 4400
5.3 6.3 6.8 7 ~ 6 fps
HD Graphics 3000:
11.5 [X] Acer Aspire M3-581TG Intel Core i7-2637M 1.7GHz
HD Graphics 3000
14 [X] Schenker Xesia M501 Intel Core i7-2630QM 2GHz
HD Graphics 3000
~ 13 fps
HD Graphics 3000:
9.5 [X] Schenker Xesia M501 Intel Core i7-2630QM 2GHz
HD Graphics 3000
fps
HD Graphics 3000:
6.5 [X] Schenker Xesia M501 Intel Core i7-2630QM 2GHz
HD Graphics 3000
fps
HD Graphics 3000:
4.1 [X] Schenker Xesia M501 Intel Core i7-2630QM 2GHz
HD Graphics 3000
fps
HD Graphics 4400:
16.4 fps
HD Graphics 3000:
16.8 [X] Acer Aspire M3-581TG Intel Core i7-2637M 1.7GHz
HD Graphics 3000
19.4 [X] Schenker Xesia M501 Intel Core i7-2630QM 2GHz
HD Graphics 3000
~ 18 fps
HD Graphics 4400:
10.8 fps
HD Graphics 4400:
17.6 fps
HD Graphics 3000:
21.9 [X] Schenker Xesia M501 Intel Core i7-2630QM 2GHz
HD Graphics 3000
fps
HD Graphics 3000:
47.8 [X] Acer Aspire M3-581TG Intel Core i7-2637M 1.7GHz
HD Graphics 3000
63.8 [X] Schenker Xesia M501 Intel Core i7-2630QM 2GHz
HD Graphics 3000
~ 56 fps
HD Graphics 3000:
24.9 [X] Acer Aspire M3-581TG Intel Core i7-2637M 1.7GHz
HD Graphics 3000
33.4 [X] Schenker Xesia M501 Intel Core i7-2630QM 2GHz
HD Graphics 3000
~ 29 fps
HD Graphics 3000:
11.2 [X] Acer Aspire M3-581TG Intel Core i7-2637M 1.7GHz
HD Graphics 3000
11.5 [X] Schenker Xesia M501 Intel Core i7-2630QM 2GHz
HD Graphics 3000
~ 11 fps
HD Graphics 3000:
8.9 [X] Schenker Xesia M501 Intel Core i7-2630QM 2GHz
HD Graphics 3000
fps
HD Graphics 3000:
6.6 [X] Schenker Xesia M501 Intel Core i7-2630QM 2GHz
HD Graphics 3000
fps
HD Graphics 4400:
5 6 ~ 6 fps
HD Graphics 3000:
3.9 [X] Schenker Xesia M501 Intel Core i7-2630QM 2GHz
HD Graphics 3000
fps
HD Graphics 4400:
2 3 ~ 3 fps
HD Graphics 3000:
39.9 [X] Schenker Xesia M501 Intel Core i7-2630QM 2GHz
HD Graphics 3000
fps
HD Graphics 3000:
24.4 [X] Schenker Xesia M501 Intel Core i7-2630QM 2GHz
HD Graphics 3000
fps
HD Graphics 3000:
14.9 [X] Schenker Xesia M501 Intel Core i7-2630QM 2GHz
HD Graphics 3000
fps
HD Graphics 4400:
12.5 13 ~ 13 fps
HD Graphics 3000:
10.6 (!) [X] Acer Aspire M3-581TG Intel Core i7-2637M 1.7GHz
HD Graphics 3000
11.2 [X] Schenker Xesia M501 Intel Core i7-2630QM 2GHz
HD Graphics 3000
~ 11 fps
HD Graphics 3000:
7.4 [X] Schenker Xesia M501 Intel Core i7-2630QM 2GHz
HD Graphics 3000
fps
HD Graphics 3000:
22.8 [X] Acer Aspire M3-581TG Intel Core i7-2637M 1.7GHz
HD Graphics 3000
23.3 [X] Schenker Xesia M501 Intel Core i7-2630QM 2GHz
HD Graphics 3000
~ 23 fps
HD Graphics 3000:
10.6 [X] Schenker Xesia M501 Intel Core i7-2630QM 2GHz
HD Graphics 3000
10.7 [X] Acer Aspire M3-581TG Intel Core i7-2637M 1.7GHz
HD Graphics 3000
~ 11 fps
HD Graphics 3000:
9.2 [X] Schenker Xesia M501 Intel Core i7-2630QM 2GHz
HD Graphics 3000
9.3 [X] Acer Aspire M3-581TG Intel Core i7-2637M 1.7GHz
HD Graphics 3000
~ 9 fps
HD Graphics 4400:
3.4 3.6 [X] Toshiba Satellite M50-A-11L (HD Graphics 4400) Intel Core i5-4200U 1.6GHz
HD Graphics 4400
3.9 3.9 4 4.1 4.2 4.3 4.7 4.8 5 5 5.2 7.5 [X] Toshiba Tecra Z40t-A1410 Intel Core i5-4310U 2GHz
HD Graphics 4400
8.1 [X] Lenovo Edge 15-80H10004US Intel Core i5-4210U 1.7GHz
HD Graphics 4400
~ 5 fps
HD Graphics 4400:
93 117.4 118 [X] Asus Q302LA-BHI Intel Core i3-4030U 1.9GHz
HD Graphics 4400
123 [X] Sony Vaio SVF14N13CXB Intel Core i5-4200U 1.6GHz
HD Graphics 4400
~ 113 fps
HD Graphics 3000:
71 107 [X] Acer Aspire M3-581TG Intel Core i7-2637M 1.7GHz
HD Graphics 3000
138 [X] Schenker Xesia M501 Intel Core i7-2630QM 2GHz
HD Graphics 3000
~ 105 fps
HD Graphics 4400:
27 31 [X] Sony Vaio SVF14N13CXB Intel Core i5-4200U 1.6GHz
HD Graphics 4400
32.1 42 [X] Asus Q302LA-BHI Intel Core i3-4030U 1.9GHz
HD Graphics 4400
~ 33 fps
HD Graphics 3000:
19.4 [X] Acer Aspire M3-581TG Intel Core i7-2637M 1.7GHz
HD Graphics 3000
20 27 [X] Schenker Xesia M501 Intel Core i7-2630QM 2GHz
HD Graphics 3000
~ 22 fps
HD Graphics 4400:
6 [X] Sony Vaio SVF14N13CXB Intel Core i5-4200U 1.6GHz
HD Graphics 4400
15 17.1 23 [X] Asus Q302LA-BHI Intel Core i3-4030U 1.9GHz
HD Graphics 4400
~ 15 fps
HD Graphics 3000:
10 12.4 [X] Schenker Xesia M501 Intel Core i7-2630QM 2GHz
HD Graphics 3000
~ 11 fps
HD Graphics 4400:
2 [X] Sony Vaio SVF14N13CXB Intel Core i5-4200U 1.6GHz
HD Graphics 4400
fps
HD Graphics 3000:
4.2 [X] Schenker Xesia M501 Intel Core i7-2630QM 2GHz
HD Graphics 3000
fps
HD Graphics 3000:
15.8 [X] Schenker Xesia M501 Intel Core i7-2630QM 2GHz
HD Graphics 3000
fps
HD Graphics 3000:
8.4 [X] Schenker Xesia M501 Intel Core i7-2630QM 2GHz
HD Graphics 3000
fps
HD Graphics 4400:
8 9 11 ~ 9 fps
HD Graphics 3000:
6.4 [X] Schenker Xesia M501 Intel Core i7-2630QM 2GHz
HD Graphics 3000
fps
HD Graphics 3000:
26 [X] Schenker Xesia M501 Intel Core i7-2630QM 2GHz
HD Graphics 3000
fps
HD Graphics 3000:
13.7 [X] Schenker Xesia M501 Intel Core i7-2630QM 2GHz
HD Graphics 3000
fps
HD Graphics 3000:
9.9 [X] Schenker Xesia M501 Intel Core i7-2630QM 2GHz
HD Graphics 3000
fps
HD Graphics 4400:
5 5 5 5.6 [X] Toshiba Satellite M50-A-11L (HD Graphics 4400) Intel Core i5-4200U 1.6GHz
HD Graphics 4400
5.9 5.9 6 6.2 7.6 [X] Toshiba Satellite Radius P50W-BST2N01 Intel Core i5-4210U 1.7GHz
HD Graphics 4400
7.8 7.9 ~ 6 fps
HD Graphics 4400:
13.4 fps
HD Graphics 3000:
48 [X] Acer Aspire M3-581TG Intel Core i7-2637M 1.7GHz
HD Graphics 3000
54.3 [X] Schenker Xesia M501 Intel Core i7-2630QM 2GHz
HD Graphics 3000
~ 51 fps
HD Graphics 3000:
21 [X] Acer Aspire M3-581TG Intel Core i7-2637M 1.7GHz
HD Graphics 3000
22.7 [X] Schenker Xesia M501 Intel Core i7-2630QM 2GHz
HD Graphics 3000
~ 22 fps
HD Graphics 3000:
16.7 [X] Schenker Xesia M501 Intel Core i7-2630QM 2GHz
HD Graphics 3000
fps
HD Graphics 4400:
11 14 ~ 13 fps
HD Graphics 3000:
9.1 [X] Schenker Xesia M501 Intel Core i7-2630QM 2GHz
HD Graphics 3000
fps
HD Graphics 4400:
20.1 fps
HD Graphics 3000:
20.4 [X] Schenker Xesia M501 Intel Core i7-2630QM 2GHz
HD Graphics 3000
fps
HD Graphics 4400:
14.2 fps
HD Graphics 3000:
12.6 [X] Schenker Xesia M501 Intel Core i7-2630QM 2GHz
HD Graphics 3000
fps
HD Graphics 4400:
11.4 fps
HD Graphics 3000:
10.7 [X] Acer Aspire M3-581TG Intel Core i7-2637M 1.7GHz
HD Graphics 3000
13.9 [X] Schenker Xesia M501 Intel Core i7-2630QM 2GHz
HD Graphics 3000
~ 12 fps
HD Graphics 3000:
12 [X] Schenker Xesia M501 Intel Core i7-2630QM 2GHz
HD Graphics 3000
fps
HD Graphics 3000:
16 [X] Schenker Xesia M501 Intel Core i7-2630QM 2GHz
HD Graphics 3000
fps
HD Graphics 4400:
13.6 fps
HD Graphics 3000:
12.4 [X] Schenker Xesia M501 Intel Core i7-2630QM 2GHz
HD Graphics 3000
fps
HD Graphics 3000:
1.9 [X] Schenker Xesia M501 Intel Core i7-2630QM 2GHz
HD Graphics 3000
fps
HD Graphics 4400:
23.2 38 ~ 31 fps
HD Graphics 3000:
16.4 [X] Acer Aspire M3-581TG Intel Core i7-2637M 1.7GHz
HD Graphics 3000
16.9 [X] Schenker Xesia M501 Intel Core i7-2630QM 2GHz
HD Graphics 3000
~ 17 fps
HD Graphics 4400:
18.6 26 ~ 22 fps
HD Graphics 3000:
12.2 [X] Schenker Xesia M501 Intel Core i7-2630QM 2GHz
HD Graphics 3000
fps
HD Graphics 3000:
4.4 [X] Schenker Xesia M501 Intel Core i7-2630QM 2GHz
HD Graphics 3000
fps
HD Graphics 4400:
21.7 fps
HD Graphics 3000:
16.7 [X] Acer Aspire M3-581TG Intel Core i7-2637M 1.7GHz
HD Graphics 3000
20.6 [X] Schenker Xesia M501 Intel Core i7-2630QM 2GHz
HD Graphics 3000
~ 19 fps
HD Graphics 4400:
15.6 fps
HD Graphics 3000:
12.6 [X] Schenker Xesia M501 Intel Core i7-2630QM 2GHz
HD Graphics 3000
fps
HD Graphics 3000:
7.7 [X] Schenker Xesia M501 Intel Core i7-2630QM 2GHz
HD Graphics 3000
fps
HD Graphics 4400:
21 22 32 ~ 25 fps
HD Graphics 3000:
17.4 [X] Schenker Xesia M501 Intel Core i7-2630QM 2GHz
HD Graphics 3000
fps
HD Graphics 4400:
16 21 ~ 19 fps
HD Graphics 3000:
11 [X] Schenker Xesia M501 Intel Core i7-2630QM 2GHz
HD Graphics 3000
fps
HD Graphics 4400:
13 16.6 ~ 15 fps
HD Graphics 3000:
8.8 [X] Schenker Xesia M501 Intel Core i7-2630QM 2GHz
HD Graphics 3000
fps
HD Graphics 3000:
16.4 24.4 [X] Acer Aspire M3-581TG Intel Core i7-2637M 1.7GHz
HD Graphics 3000
29.7 [X] Schenker Xesia M501 Intel Core i7-2630QM 2GHz
HD Graphics 3000
~ 24 fps
HD Graphics 3000:
19.9 [X] Acer Aspire M3-581TG Intel Core i7-2637M 1.7GHz
HD Graphics 3000
23.5 [X] Schenker Xesia M501 Intel Core i7-2630QM 2GHz
HD Graphics 3000
~ 22 fps
HD Graphics 3000:
18.3 [X] Acer Aspire M3-581TG Intel Core i7-2637M 1.7GHz
HD Graphics 3000
21.1 [X] Schenker Xesia M501 Intel Core i7-2630QM 2GHz
HD Graphics 3000
~ 20 fps
HD Graphics 4400:
15.4 fps
HD Graphics 3000:
11.6 [X] Schenker Xesia M501 Intel Core i7-2630QM 2GHz
HD Graphics 3000
fps
HD Graphics 3000:
51 [X] Acer Aspire M3-581TG Intel Core i7-2637M 1.7GHz
HD Graphics 3000
64.3 [X] Schenker Xesia M501 Intel Core i7-2630QM 2GHz
HD Graphics 3000
~ 58 fps
HD Graphics 3000:
19.2 [X] Acer Aspire M3-581TG Intel Core i7-2637M 1.7GHz
HD Graphics 3000
19.4 [X] Schenker Xesia M501 Intel Core i7-2630QM 2GHz
HD Graphics 3000
~ 19 fps
HD Graphics 3000:
14.6 [X] Schenker Xesia M501 Intel Core i7-2630QM 2GHz
HD Graphics 3000
fps
HD Graphics 3000:
7.6 [X] Schenker Xesia M501 Intel Core i7-2630QM 2GHz
HD Graphics 3000
fps
HD Graphics 4400:
77.6 127 [X] Dell XPS 12-9Q33 Intel Core i5-4200U 1.6GHz
HD Graphics 4400
148 ~ 118 fps
HD Graphics 4400:
58.1 72 87 [X] Dell XPS 12-9Q33 Intel Core i5-4200U 1.6GHz
HD Graphics 4400
97 ~ 79 fps
HD Graphics 4400:
39.2 60 65 [X] Dell XPS 12-9Q33 Intel Core i5-4200U 1.6GHz
HD Graphics 4400
67 ~ 58 fps
HD Graphics 4400:
34 38 [X] Dell XPS 12-9Q33 Intel Core i5-4200U 1.6GHz
HD Graphics 4400
44 ~ 39 fps
HD Graphics 3000:
16.6 [X] Schenker Xesia M501 Intel Core i7-2630QM 2GHz
HD Graphics 3000
16.6 [X] Acer Aspire M3-581TG Intel Core i7-2637M 1.7GHz
HD Graphics 3000
~ 17 fps
HD Graphics 3000:
23 49 [X] Schenker Xesia M501 Intel Core i7-2630QM 2GHz
HD Graphics 3000
~ 36 fps
HD Graphics 3000:
15 27 [X] Schenker Xesia M501 Intel Core i7-2630QM 2GHz
HD Graphics 3000
~ 21 fps
HD Graphics 3000:
12 17 [X] Schenker Xesia M501 Intel Core i7-2630QM 2GHz
HD Graphics 3000
~ 15 fps
HD Graphics 4400:
13 14 16 ~ 14 fps
HD Graphics 3000:
12 [X] Schenker Xesia M501 Intel Core i7-2630QM 2GHz
HD Graphics 3000
fps
HD Graphics 3000:
20.9 [X] Schenker Xesia M501 Intel Core i7-2630QM 2GHz
HD Graphics 3000
27 ~ 24 fps
HD Graphics 3000:
13 17 [X] Schenker Xesia M501 Intel Core i7-2630QM 2GHz
HD Graphics 3000
~ 15 fps
HD Graphics 3000:
12.3 [X] Schenker Xesia M501 Intel Core i7-2630QM 2GHz
HD Graphics 3000
fps
HD Graphics 3000:
6.4 [X] Schenker Xesia M501 Intel Core i7-2630QM 2GHz
HD Graphics 3000
fps
HD Graphics 4400:
75 79 91 ~ 82 fps
HD Graphics 3000:
42 56.5 [X] Acer Aspire M3-581TG Intel Core i7-2637M 1.7GHz
HD Graphics 3000
61.9 [X] Schenker Xesia M501 Intel Core i7-2630QM 2GHz
HD Graphics 3000
~ 53 fps
HD Graphics 4400:
34 40 52 ~ 42 fps
HD Graphics 3000:
19.8 26.6 [X] Acer Aspire M3-581TG Intel Core i7-2637M 1.7GHz
HD Graphics 3000
32.8 [X] Schenker Xesia M501 Intel Core i7-2630QM 2GHz
HD Graphics 3000
~ 26 fps
HD Graphics 4400:
16 17 21 ~ 18 fps
HD Graphics 3000:
15.7 [X] Acer Aspire M3-581TG Intel Core i7-2637M 1.7GHz
HD Graphics 3000
16.8 [X] Schenker Xesia M501 Intel Core i7-2630QM 2GHz
HD Graphics 3000
~ 16 fps
HD Graphics 4400:
17 [X] Sony Vaio SVF14N13CXB Intel Core i5-4200U 1.6GHz
HD Graphics 4400
31 45 [X] Asus Q302LA-BHI Intel Core i3-4030U 1.9GHz
HD Graphics 4400
~ 31 fps
HD Graphics 3000:
20 22 22.6 [X] Acer Aspire M3-581TG Intel Core i7-2637M 1.7GHz
HD Graphics 3000
37.5 [X] Schenker Xesia M501 Intel Core i7-2630QM 2GHz
HD Graphics 3000
~ 26 fps
HD Graphics 4400:
3 [X] Sony Vaio SVF14N13CXB Intel Core i5-4200U 1.6GHz
HD Graphics 4400
9 15 [X] Asus Q302LA-BHI Intel Core i3-4030U 1.9GHz
HD Graphics 4400
~ 9 fps
HD Graphics 3000:
7 8 8.1 [X] Acer Aspire M3-581TG Intel Core i7-2637M 1.7GHz
HD Graphics 3000
9.2 [X] Schenker Xesia M501 Intel Core i7-2630QM 2GHz
HD Graphics 3000
~ 8 fps
HD Graphics 4400:
1 [X] Sony Vaio SVF14N13CXB Intel Core i5-4200U 1.6GHz
HD Graphics 4400
fps
HD Graphics 3000:
3.1 [X] Acer Aspire M3-581TG Intel Core i7-2637M 1.7GHz
HD Graphics 3000
fps
HD Graphics 3000:
50.4 70.8 [X] Schenker Xesia M501 Intel Core i7-2630QM 2GHz
HD Graphics 3000
~ 61 fps
HD Graphics 3000:
33.4 41.4 [X] Schenker Xesia M501 Intel Core i7-2630QM 2GHz
HD Graphics 3000
~ 37 fps
HD Graphics 3000:
13.6 19.7 [X] Schenker Xesia M501 Intel Core i7-2630QM 2GHz
HD Graphics 3000
~ 17 fps
HD Graphics 3000:
10.6 [X] Schenker Xesia M501 Intel Core i7-2630QM 2GHz
HD Graphics 3000
fps
HD Graphics 3000:
18.4 [X] Acer Aspire M3-581TG Intel Core i7-2637M 1.7GHz
HD Graphics 3000
18.6 [X] Schenker Xesia M501 Intel Core i7-2630QM 2GHz
HD Graphics 3000
~ 19 fps
HD Graphics 3000:
10 [X] Schenker Xesia M501 Intel Core i7-2630QM 2GHz
HD Graphics 3000
10 [X] Acer Aspire M3-581TG Intel Core i7-2637M 1.7GHz
HD Graphics 3000
~ 10 fps
HD Graphics 3000:
21 [X] Schenker Xesia M501 Intel Core i7-2630QM 2GHz
HD Graphics 3000
fps
HD Graphics 3000:
15 [X] Schenker Xesia M501 Intel Core i7-2630QM 2GHz
HD Graphics 3000
fps
HD Graphics 3000:
6.8 [X] Schenker Xesia M501 Intel Core i7-2630QM 2GHz
HD Graphics 3000
fps
HD Graphics 3000:
13.7 [X] Schenker Xesia M501 Intel Core i7-2630QM 2GHz
HD Graphics 3000
fps
HD Graphics 3000:
11.3 [X] Schenker Xesia M501 Intel Core i7-2630QM 2GHz
HD Graphics 3000
fps
HD Graphics 4400:
13.5 fps
HD Graphics 3000:
8.7 [X] Acer Aspire M3-581TG Intel Core i7-2637M 1.7GHz
HD Graphics 3000
9.4 [X] Schenker Xesia M501 Intel Core i7-2630QM 2GHz
HD Graphics 3000
~ 9 fps
HD Graphics 4400:
17.6 fps
HD Graphics 3000:
17.6 [X] Schenker Xesia M501 Intel Core i7-2630QM 2GHz
HD Graphics 3000
fps
HD Graphics 4400:
14.5 fps
HD Graphics 3000:
12.7 [X] Schenker Xesia M501 Intel Core i7-2630QM 2GHz
HD Graphics 3000
fps
HD Graphics 4400:
33.1 49 ~ 41 fps
HD Graphics 3000:
24.8 24.8 31.1 33.8 [X] Acer Aspire M3-581TG Intel Core i7-2637M 1.7GHz
HD Graphics 3000
40.6 [X] Schenker XMG A501 Intel Core i7-2630QM 2GHz
HD Graphics 3000
~ 31 fps
HD Graphics 4400:
19.6 30 ~ 25 fps
HD Graphics 3000:
15.1 15.1 17.2 19 [X] Acer Aspire M3-581TG Intel Core i7-2637M 1.7GHz
HD Graphics 3000
25.3 [X] Schenker XMG A501 Intel Core i7-2630QM 2GHz
HD Graphics 3000
~ 18 fps
HD Graphics 3000:
8.6 9.5 9.5 13 [X] Acer Aspire M3-581TG Intel Core i7-2637M 1.7GHz
HD Graphics 3000
13.1 [X] Schenker XMG A501 Intel Core i7-2630QM 2GHz
HD Graphics 3000
~ 11 fps
HD Graphics 3000:
24.6 25.6 27 30.4 31.3 39 41 [X] Acer Aspire M3-581TG Intel Core i7-2637M 1.7GHz
HD Graphics 3000
44 [X] Schenker XMG A501 Intel Core i7-2630QM 2GHz
HD Graphics 3000
56 ~ 35 fps
HD Graphics 3000:
14.8 15 15.7 [X] Schenker XMG A501 Intel Core i7-2630QM 2GHz
HD Graphics 3000
16 [X] Acer Aspire M3-581TG Intel Core i7-2637M 1.7GHz
HD Graphics 3000
18 18.7 19.6 21.2 ~ 17 fps
HD Graphics 3000:
7 8.2 [X] Schenker XMG A501 Intel Core i7-2630QM 2GHz
HD Graphics 3000
8.5 [X] Acer Aspire M3-581TG Intel Core i7-2637M 1.7GHz
HD Graphics 3000
8.5 [X] Acer Aspire M3-581TG Intel Core i7-2637M 1.7GHz
HD Graphics 3000
12.9 13 15.8 18 ~ 11 fps
HD Graphics 3000:
6.3 [X] Schenker XMG A501 Intel Core i7-2630QM 2GHz
HD Graphics 3000
17 ~ 12 fps
HD Graphics 4400:
13.4 fps
HD Graphics 3000:
16.3 [X] Acer Aspire M3-581TG Intel Core i7-2637M 1.7GHz
HD Graphics 3000
17.6 [X] Schenker XMG A501 Intel Core i7-2630QM 2GHz
HD Graphics 3000
~ 17 fps
HD Graphics 3000:
11.3 [X] Acer Aspire M3-581TG Intel Core i7-2637M 1.7GHz
HD Graphics 3000
11.9 [X] Schenker XMG A501 Intel Core i7-2630QM 2GHz
HD Graphics 3000
~ 12 fps
HD Graphics 3000:
8.5 [X] Schenker XMG A501 Intel Core i7-2630QM 2GHz
HD Graphics 3000
8.6 [X] Acer Aspire M3-581TG Intel Core i7-2637M 1.7GHz
HD Graphics 3000
~ 9 fps
HD Graphics 3000:
21.2 21.4 31 [X] Schenker XMG A501 Intel Core i7-2630QM 2GHz
HD Graphics 3000
~ 25 fps
HD Graphics 3000:
15.8 21.7 [X] Schenker XMG A501 Intel Core i7-2630QM 2GHz
HD Graphics 3000
~ 19 fps
HD Graphics 3000:
12.3 [X] Schenker XMG A501 Intel Core i7-2630QM 2GHz
HD Graphics 3000
fps
HD Graphics 3000:
4 4 9.1 [X] Schenker XMG A501 Intel Core i7-2630QM 2GHz
HD Graphics 3000
~ 6 fps
HD Graphics 4400:
11.7 fps
HD Graphics 3000:
6.2 [X] Schenker XMG A501 Intel Core i7-2630QM 2GHz
HD Graphics 3000
fps
HD Graphics 3000:
41.3 [X] Schenker Xesia M501 Intel Core i5-2430M 2.4GHz
HD Graphics 3000
fps
HD Graphics 3000:
11 [X] Schenker Xesia M501 Intel Core i5-2430M 2.4GHz
HD Graphics 3000
fps
HD Graphics 3000:
21 21.5 22 24 29.3 [X] Dell Inspiron N411z (C0425821) Intel Core i3-2330M 2.2GHz
HD Graphics 3000
29.3 29.6 30 30 30.2 30.3 30.6 30.7 31.1 31.4 31.6 32 [X] Sony Vaio VPCCA290X Intel Core i5-2410M 2.3GHz
HD Graphics 3000
32 32 32.7 33.4 34 [X] Acer Aspire 3830TG-6431 Intel Core i5-2410M 2.3GHz
HD Graphics 3000
35 35.2 35.3 [X] Asus X501A-XX381H Intel Core i3-2328M 2.2GHz
HD Graphics 3000
36.7 [X] Schenker XMG A501 Intel Core i7-2630QM 2GHz
HD Graphics 3000
39.2 [X] Asus B33E PL Intel Core i7-2620M 2.7GHz
HD Graphics 3000
42 [X] no model Intel Core i7-2860QM 2.5GHz
HD Graphics 3000
47.4 ~ 32 fps
HD Graphics 3000:
6 6.1 7 7 7.4 [X] Dell Inspiron N411z (C0425821) Intel Core i3-2330M 2.2GHz
HD Graphics 3000
7.7 8 [X] Sony Vaio VPCCA290X Intel Core i5-2410M 2.3GHz
HD Graphics 3000
8.1 8.6 8.8 9 9 9.6 [X] Asus B33E PL Intel Core i7-2620M 2.7GHz
HD Graphics 3000
~ 8 fps
HD Graphics 4400:
5.8 5.9 5.9 6.1 [X] Toshiba Satellite M50-A-11L (HD Graphics 4400) Intel Core i5-4200U 1.6GHz
HD Graphics 4400
6.7 6.9 6.9 7.1 7.7 7.8 8 8.8 [X] Toshiba Satellite Radius P50W-BST2N01 Intel Core i5-4210U 1.7GHz
HD Graphics 4400
9.8 [X] Fujitsu LifeBook U904 M0010PL Intel Core i7-4600U 2.1GHz
HD Graphics 4400
56 ~ 11 fps
HD Graphics 3000:
3 [X] Sony Vaio VPCCA290X Intel Core i5-2410M 2.3GHz
HD Graphics 3000
fps
HD Graphics 3000:
12 [X] Sony Vaio VPCCA290X Intel Core i5-2410M 2.3GHz
HD Graphics 3000
17 17 18 [X] Acer Aspire 3830TG-6431 Intel Core i5-2410M 2.3GHz
HD Graphics 3000
18 18 18.7 19.4 19.7 21.1 22.5 25 [X] no model Intel Core i7-2860QM 2.5GHz
HD Graphics 3000
25.2 [X] Schenker XMG A501 Intel Core i7-2630QM 2GHz
HD Graphics 3000
~ 19 fps
HD Graphics 3000:
8 [X] Sony Vaio VPCCA290X Intel Core i5-2410M 2.3GHz
HD Graphics 3000
8 9 [X] Acer Aspire 3830TG-6431 Intel Core i5-2410M 2.3GHz
HD Graphics 3000
9 9 9.2 9.6 9.9 10 10.5 11.2 13 [X] no model Intel Core i7-2860QM 2.5GHz
HD Graphics 3000
~ 10 fps
HD Graphics 3000:
7 [X] Acer Aspire 3830TG-6431 Intel Core i5-2410M 2.3GHz
HD Graphics 3000
8.5 ~ 8 fps
HD Graphics 3000:
70.9 [X] Schenker XMG A501 Intel Core i7-2630QM 2GHz
HD Graphics 3000
fps
HD Graphics 3000:
31.9 [X] Schenker XMG A501 Intel Core i7-2630QM 2GHz
HD Graphics 3000
fps
HD Graphics 3000:
13.4 [X] Schenker XMG A501 Intel Core i7-2630QM 2GHz
HD Graphics 3000
fps
HD Graphics 3000:
6.9 [X] Schenker XMG A501 Intel Core i7-2630QM 2GHz
HD Graphics 3000
fps
HD Graphics 3000:
7 (!) [X] Acer Aspire 3830TG-6431 Intel Core i5-2410M 2.3GHz
HD Graphics 3000
7 (!) [X] no model Intel Core i7-2860QM 2.5GHz
HD Graphics 3000
13.8 16.6 [X] Schenker XMG A501 Intel Core i7-2630QM 2GHz
HD Graphics 3000
~ 11 fps
HD Graphics 4400:
11.7 fps
HD Graphics 4400:
27 39 ~ 33 fps
HD Graphics 3000:
23 23 45 [X] no model Intel Core i7-2860QM 2.5GHz
HD Graphics 3000
~ 30 fps
HD Graphics 4400:
22 28 ~ 25 fps
HD Graphics 3000:
18 18 32 [X] no model Intel Core i7-2860QM 2.5GHz
HD Graphics 3000
~ 23 fps
HD Graphics 4400:
10 12 ~ 11 fps
HD Graphics 3000:
49.9 49.9 55 63 66.5 67 69 76 76.3 79 80.4 81 84 [X] Acer Aspire 3830TG-6431 Intel Core i5-2410M 2.3GHz
HD Graphics 3000
94 [X] Asus X501A-XX381H Intel Core i3-2328M 2.2GHz
HD Graphics 3000
106.5 108.6 [X] Dell Inspiron N411z (C0425821) Intel Core i3-2330M 2.2GHz
HD Graphics 3000
118.6 [X] Asus B33E PL Intel Core i7-2620M 2.7GHz
HD Graphics 3000
120.4 185 [X] no model Intel Core i7-2860QM 2.5GHz
HD Graphics 3000
~ 86 fps
HD Graphics 3000:
22.9 22.9 29.5 33 34 37 42 42.7 47 47.1 48 49.2 [X] Asus X501A-XX381H Intel Core i3-2328M 2.2GHz
HD Graphics 3000
53.4 54.1 57 [X] Acer Aspire 3830TG-6431 Intel Core i5-2410M 2.3GHz
HD Graphics 3000
61.7 [X] Dell Inspiron N411z (C0425821) Intel Core i3-2330M 2.2GHz
HD Graphics 3000
65.1 86.5 [X] Asus B33E PL Intel Core i7-2620M 2.7GHz
HD Graphics 3000
91 [X] no model Intel Core i7-2860QM 2.5GHz
HD Graphics 3000
~ 49 fps
HD Graphics 3000:
18 18 19 19.9 21 25 25.5 26.6 27 27 27.8 28 [X] Acer Aspire 3830TG-6431 Intel Core i5-2410M 2.3GHz
HD Graphics 3000
28 30.2 30.6 [X] Schenker XMG A501 Intel Core i7-2630QM 2GHz
HD Graphics 3000
30.9 46 [X] no model Intel Core i7-2860QM 2.5GHz
HD Graphics 3000
47.7 [X] Asus B33E PL Intel Core i7-2620M 2.7GHz
HD Graphics 3000
~ 28 fps
HD Graphics 3000:
19 [X] Acer Aspire 3830TG-6431 Intel Core i5-2410M 2.3GHz
HD Graphics 3000
19 27 [X] no model Intel Core i7-2860QM 2.5GHz
HD Graphics 3000
~ 22 fps
HD Graphics 3000:
30 33 38.5 48 [X] Acer Aspire 3830TG-6431 Intel Core i5-2410M 2.3GHz
HD Graphics 3000
70 [X] no model Intel Core i7-2860QM 2.5GHz
HD Graphics 3000
~ 44 fps
HD Graphics 3000:
16 18 20 22 [X] Acer Aspire 3830TG-6431 Intel Core i5-2410M 2.3GHz
HD Graphics 3000
30 [X] Schenker XMG A501 Intel Core i7-2630QM 2GHz
HD Graphics 3000
35 [X] no model Intel Core i7-2860QM 2.5GHz
HD Graphics 3000
~ 24 fps
HD Graphics 3000:
24 26.7 28 31.2 33 42 [X] Acer Aspire 3830TG-6431 Intel Core i5-2410M 2.3GHz
HD Graphics 3000
51 [X] no model Intel Core i7-2860QM 2.5GHz
HD Graphics 3000
53 [X] Alienware M18x Intel Core i7-2920XM @4GHz
HD Graphics 3000
~ 36 fps
HD Graphics 4400:
31.7 fps
HD Graphics 4400:
13.8 fps
HD Graphics 4400:
44.6 fps
HD Graphics 4400:
24.4 fps
HD Graphics 3000:
8.3 16 18 18 18 18 19.9 [X] no model Intel Core i7-2820QM 2.3GHz
HD Graphics 3000
~ 17 fps
HD Graphics 4400:
12.8 fps
HD Graphics 3000:
12.9 [X] no model Intel Core i7-2820QM 2.3GHz
HD Graphics 3000
13 13 ~ 13 fps
HD Graphics 3000:
13 [X] Acer Aspire 3830TG-6431 Intel Core i5-2410M 2.3GHz
HD Graphics 3000
fps
HD Graphics 3000:
27 [X] MSI CX640-i547W7P Intel Core i5-2410M 2.3GHz
HD Graphics 3000
30 30 33 [X] no model Intel Core i7-2820QM 2.3GHz
HD Graphics 3000
~ 30 fps
HD Graphics 3000:
18 [X] MSI CX640-i547W7P Intel Core i5-2410M 2.3GHz
HD Graphics 3000
18.5 [X] Schenker XMG A501 Intel Core i7-2630QM 2GHz
HD Graphics 3000
19 19 20 [X] no model Intel Core i7-2820QM 2.3GHz
HD Graphics 3000
~ 19 fps
HD Graphics 3000:
13 [X] MSI CX640-i547W7P Intel Core i5-2410M 2.3GHz
HD Graphics 3000
15 15 16 [X] no model Intel Core i7-2820QM 2.3GHz
HD Graphics 3000
~ 15 fps
HD Graphics 3000:
4 [X] MSI CX640-i547W7P Intel Core i5-2410M 2.3GHz
HD Graphics 3000
4 4 ~ 4 fps
HD Graphics 3000:
59.1 62.7 79 [X] Acer Aspire 3830TG-6431 Intel Core i5-2410M 2.3GHz
HD Graphics 3000
88 [X] Alienware M18x Intel Core i7-2920XM @4GHz
HD Graphics 3000
~ 72 fps
HD Graphics 3000:
5 (!) [X] Toshiba Portégé Z830-10N Intel Core i3-2367M 1.4GHz
HD Graphics 3000
6 [X] Alienware M18x Intel Core i7-2920XM @4GHz
HD Graphics 3000
6.2 [X] Acer Aspire 3830TG-6431 Intel Core i5-2410M 2.3GHz
HD Graphics 3000
15.7 ~ 8 fps
HD Graphics 3000:
-1 [X] Alienware M18x Intel Core i7-2920XM @4GHz
HD Graphics 3000
fps
HD Graphics 3000:
20.9 [X] Asus U30SD-XA1 Intel HD 3000 Intel Core i5-2410M 2.3GHz
HD Graphics 3000
21 21 22.7 [X] Asus N53SV HD3000 Intel Core i7-2720QM 2.2GHz
HD Graphics 3000
24.4 25 26 27 27 29 [X] no model Intel Core i7-2820QM 2.3GHz
HD Graphics 3000
32 [X] no model Intel Core i5-2500K 3.3GHz
HD Graphics 3000
32 [X] no model Intel Core i7-2600K 3.4GHz
HD Graphics 3000
~ 26 fps
HD Graphics 3000:
15 15.6 [X] Asus U30SD-XA1 Intel HD 3000 Intel Core i5-2410M 2.3GHz
HD Graphics 3000
16 16.5 18 18 18 18.3 [X] Asus N53SV HD3000 Intel Core i7-2720QM 2.2GHz
HD Graphics 3000
19 [X] no model Intel Core i7-2820QM 2.3GHz
HD Graphics 3000
22 [X] no model Intel Core i5-2500K 3.3GHz
HD Graphics 3000
27 [X] Schenker XMG A501 Intel Core i7-2630QM 2GHz
HD Graphics 3000
~ 18 fps
HD Graphics 3000:
9.3 [X] Asus U30SD-XA1 Intel HD 3000 Intel Core i5-2410M 2.3GHz
HD Graphics 3000
10.2 13 13 14 [X] no model Intel Core i5-2500K 3.3GHz
HD Graphics 3000
14 17.9 [X] Asus N53SV HD3000 Intel Core i7-2720QM 2.2GHz
HD Graphics 3000
~ 13 fps
HD Graphics 3000:
5.7 6 6 ~ 6 fps
HD Graphics 3000:
53 [X] Samsung 350U2A-A01PL Intel Core i3-2357M 1.3GHz
HD Graphics 3000
80.7 [X] MSI CR640-048XPL Intel Core i3-2310M 2.1GHz
HD Graphics 3000
88.3 [X] Toshiba Satellite Pro R850-122 Intel Core i3-2310M 2.1GHz
HD Graphics 3000
97.7 [X] HP ProBook 6360b LG632EA Intel Core i5-2410M 2.3GHz
HD Graphics 3000
98 98 98 99.8 [X] Fujitsu LifeBook P771 (VFY:P7710MF011PL) Intel Core i7-2617M 1.5GHz
HD Graphics 3000
101 101 101.8 [X] HP Folio 13 (B0N00AA) Intel Core i5-2467M 1.6GHz
HD Graphics 3000
107.3 [X] Samsung QX311-A01PL Intel Core i5-2410M 2.3GHz
HD Graphics 3000
117 127 132.8 ~ 100 fps
HD Graphics 3000:
31.1 [X] Samsung 350U2A-A01PL Intel Core i3-2357M 1.3GHz
HD Graphics 3000
48.2 [X] Asus K53E-SX058V Intel Core i3-2310M 2.1GHz
HD Graphics 3000
49.3 [X] MSI CR640-048XPL Intel Core i3-2310M 2.1GHz
HD Graphics 3000
54 54 54 55.1 [X] Fujitsu LifeBook P771 (VFY:P7710MF011PL) Intel Core i7-2617M 1.5GHz
HD Graphics 3000
55.8 [X] HP Folio 13 (B0N00AA) Intel Core i5-2467M 1.6GHz
HD Graphics 3000
55.9 [X] Toshiba Satellite Pro R850-122 Intel Core i3-2310M 2.1GHz
HD Graphics 3000
56 56 57 [X] HP ProBook 6360b LG632EA Intel Core i5-2410M 2.3GHz
HD Graphics 3000
61 62.6 [X] Asus Zenbook UX21E-KX004V Intel Core i5-2467M 1.6GHz
HD Graphics 3000
63 63.5 [X] Samsung QX311-A01PL Intel Core i5-2410M 2.3GHz
HD Graphics 3000
65.7 ~ 55 fps
HD Graphics 3000:
21.4 [X] MSI CR640-048XPL Intel Core i3-2310M 2.1GHz
HD Graphics 3000
21.7 [X] HP ProBook 6360b LG632EA Intel Core i5-2410M 2.3GHz
HD Graphics 3000
24 [X] Asus K53E-SX058V Intel Core i3-2310M 2.1GHz
HD Graphics 3000
26.2 [X] Toshiba Satellite Pro R850-122 Intel Core i3-2310M 2.1GHz
HD Graphics 3000
29.4 [X] HP Folio 13 (B0N00AA) Intel Core i5-2467M 1.6GHz
HD Graphics 3000
32 32 32 32 32 32 32 35.9 [X] Samsung QX311-A01PL Intel Core i5-2410M 2.3GHz
HD Graphics 3000
36.2 [X] Asus Zenbook UX21E-KX004V Intel Core i5-2467M 1.6GHz
HD Graphics 3000
41.4 44 [X] no model Intel Core i5-2500K 3.3GHz
HD Graphics 3000
46 [X] no model Intel Core i7-2820QM 2.3GHz
HD Graphics 3000
~ 32 fps
HD Graphics 3000:
21 23 [X] no model Intel Core i7-2820QM 2.3GHz
HD Graphics 3000
23 23 25 [X] no model Intel Core i5-2500K 3.3GHz
HD Graphics 3000
~ 23 fps
HD Graphics 4400:
21.5 fps
HD Graphics 3000:
9.8 16.9 [X] Alienware M18x Intel Core i7-2920XM @4GHz
HD Graphics 3000
16.9 [X] Acer Aspire 3830TG-6431 Intel Core i5-2410M 2.3GHz
HD Graphics 3000
~ 15 fps
HD Graphics 3000:
5 (!) [X] Alienware M18x Intel Core i7-2920XM @4GHz
HD Graphics 3000
fps
HD Graphics 4400:
26.5 [X] Asus B551LA-CF361G Intel Core i5-4210U 1.7GHz
HD Graphics 4400
28 [X] Dell Vostro 3546 JAN15HSW1601_1K9_Win Intel Core i3-4005U 1.7GHz
HD Graphics 4400
32.5 [X] Lenovo B50-70 59-407828 Intel Core i5-4210U 1.7GHz
HD Graphics 4400
34.2 [X] Asus PU551LA-XO359G Intel Core i3-4030U 1.9GHz
HD Graphics 4400
46 50 ~ 36 fps
HD Graphics 3000:
7 7 7.7 9 9 20.5 20.8 23 [X] MSI CX640-i547W7P Intel Core i5-2410M 2.3GHz
HD Graphics 3000
~ 13 fps
HD Graphics 4400:
20.5 [X] Asus B551LA-CF361G Intel Core i5-4210U 1.7GHz
HD Graphics 4400
20.8 [X] Dell Vostro 3546 JAN15HSW1601_1K9_Win Intel Core i3-4005U 1.7GHz
HD Graphics 4400
23 [X] Asus PU551LA-XO359G Intel Core i3-4030U 1.9GHz
HD Graphics 4400
25.2 [X] Lenovo B50-70 59-407828 Intel Core i5-4210U 1.7GHz
HD Graphics 4400
30 32 ~ 25 fps
HD Graphics 3000:
5.8 17.4 [X] Schenker XMG A501 Intel Core i7-2630QM 2GHz
HD Graphics 3000
17.6 19 [X] MSI CX640-i547W7P Intel Core i5-2410M 2.3GHz
HD Graphics 3000
19 19 19 19 19 ~ 17 fps
HD Graphics 4400:
17.2 [X] Dell Vostro 3546 JAN15HSW1601_1K9_Win Intel Core i3-4005U 1.7GHz
HD Graphics 4400
17.3 [X] Asus B551LA-CF361G Intel Core i5-4210U 1.7GHz
HD Graphics 4400
19.2 [X] Asus PU551LA-XO359G Intel Core i3-4030U 1.9GHz
HD Graphics 4400
20.9 [X] Lenovo B50-70 59-407828 Intel Core i5-4210U 1.7GHz
HD Graphics 4400
23 26 ~ 21 fps
HD Graphics 3000:
4.8 14.4 15 [X] MSI CX640-i547W7P Intel Core i5-2410M 2.3GHz
HD Graphics 3000
15 15 15 15 15 ~ 14 fps
HD Graphics 4400:
10.5 [X] Asus B551LA-CF361G Intel Core i5-4210U 1.7GHz
HD Graphics 4400
12 12.3 [X] Lenovo B50-70 59-407828 Intel Core i5-4210U 1.7GHz
HD Graphics 4400
13 ~ 12 fps
HD Graphics 3000:
8.5 9 [X] MSI CX640-i547W7P Intel Core i5-2410M 2.3GHz
HD Graphics 3000
9 9 ~ 9 fps
HD Graphics 4400:
70 [X] Acer Aspire V7-582P-6673 Intel Core i5-4200U 1.6GHz
HD Graphics 4400
81.5 86 116.3 117 122 [X] Dell XPS 12-9Q33 Intel Core i5-4200U 1.6GHz
HD Graphics 4400
127.1 138 ~ 107 fps
HD Graphics 3000:
44 48.3 48.8 51 54 56 57 [X] Sony Vaio VPC-EG27FM/W Intel Core i5-2430M 2.4GHz
HD Graphics 3000
58 61 61 62.2 64 64 [X] Toshiba Portégé R835-P88 Intel Core i5-2450M 2.5GHz
HD Graphics 3000
65 66 68 68 69 69 72 75 [X] MSI CX640-i547W7P Intel Core i5-2410M 2.3GHz
HD Graphics 3000
77.2 86.8 94 [X] no model Intel Core i5-2500K 3.3GHz
HD Graphics 3000
94.4 [X] Asus N53SV HD3000 Intel Core i7-2720QM 2.2GHz
HD Graphics 3000
96 [X] no model Intel Core i7-2820QM 2.3GHz
HD Graphics 3000
106 [X] no model Intel Core i7-2600K 3.4GHz
HD Graphics 3000
117 ~ 70 fps
HD Graphics 4400:
19 24 27 32.4 33.6 35 [X] Dell XPS 12-9Q33 Intel Core i5-4200U 1.6GHz
HD Graphics 4400
42 [X] Acer Aspire V7-582P-6673 Intel Core i5-4200U 1.6GHz
HD Graphics 4400
~ 30 fps
HD Graphics 3000:
12 13.3 14 14 15 15 16 16 16 16.3 16.6 17 [X] Sony Vaio VPC-EG27FM/W Intel Core i5-2430M 2.4GHz
HD Graphics 3000
17 [X] Toshiba Portégé R835-P88 Intel Core i5-2450M 2.5GHz
HD Graphics 3000
17.8 18 19 [X] no model Intel Core i5-2500K 3.3GHz
HD Graphics 3000
19 19 19.5 [X] Schenker XMG A501 Intel Core i7-2630QM 2GHz
HD Graphics 3000
20 20.4 [X] Asus N53SV HD3000 Intel Core i7-2720QM 2.2GHz
HD Graphics 3000
21 [X] no model Intel Core i7-2820QM 2.3GHz
HD Graphics 3000
21 [X] MSI CX640-i547W7P Intel Core i5-2410M 2.3GHz
HD Graphics 3000
21 22 23 [X] no model Intel Core i7-2600K 3.4GHz
HD Graphics 3000
31.4 ~ 18 fps
HD Graphics 4400:
13 15.8 18 18.4 20 [X] Dell XPS 12-9Q33 Intel Core i5-4200U 1.6GHz
HD Graphics 4400
20.4 24 [X] Acer Aspire V7-582P-6673 Intel Core i5-4200U 1.6GHz
HD Graphics 4400
~ 19 fps
HD Graphics 3000:
7 7 8 [X] Toshiba Portégé R835-P88 Intel Core i5-2450M 2.5GHz
HD Graphics 3000
9 10 10 10 10.1 10.2 10.6 11 [X] no model Intel Core i7-2820QM 2.3GHz
HD Graphics 3000
11 11 11 12 [X] no model Intel Core i5-2500K 3.3GHz
HD Graphics 3000
12 [X] MSI CX640-i547W7P Intel Core i5-2410M 2.3GHz
HD Graphics 3000
12 13 13 13.1 [X] Asus N53SV HD3000 Intel Core i7-2720QM 2.2GHz
HD Graphics 3000
14 [X] Sony Vaio VPC-EG27FM/W Intel Core i5-2430M 2.4GHz
HD Graphics 3000
15 [X] no model Intel Core i7-2600K 3.4GHz
HD Graphics 3000
21.8 ~ 11 fps
HD Graphics 4400:
7 8 9.1 10 11 [X] Dell XPS 12-9Q33 Intel Core i5-4200U 1.6GHz
HD Graphics 4400
11.1 12 ~ 10 fps
HD Graphics 3000:
5 7 [X] MSI CX640-i547W7P Intel Core i5-2410M 2.3GHz
HD Graphics 3000
7 8 [X] no model Intel Core i7-2600K 3.4GHz
HD Graphics 3000
8 8 8.8 9 [X] no model Intel Core i5-2500K 3.3GHz
HD Graphics 3000
~ 8 fps
HD Graphics 3000:
2.7 [X] Acer Aspire 3830TG-6431 Intel Core i5-2410M 2.3GHz
HD Graphics 3000
fps
HD Graphics 4400:
34 [X] Fujitsu LifeBook U904 M0010PL Intel Core i7-4600U 2.1GHz
HD Graphics 4400
35.5 [X] Lenovo ThinkPad T440 20B6A002PB Intel Core i5-4200U 1.6GHz
HD Graphics 4400
36 ~ 35 fps
HD Graphics 3000:
18.2 [X] Asus K53E-SX058V Intel Core i3-2310M 2.1GHz
HD Graphics 3000
19.4 [X] Samsung 400B2B-H01PL Intel Core i5-2410M 2.3GHz
HD Graphics 3000
21.1 [X] Fujitsu LifeBook P771 (VFY:P7710MF011PL) Intel Core i7-2617M 1.5GHz
HD Graphics 3000
24 25 [X] no model Intel Core i5-2500K 3.3GHz
HD Graphics 3000
26 [X] no model Intel Core i7-2820QM 2.3GHz
HD Graphics 3000
30.3 [X] Schenker XMG A501 Intel Core i7-2630QM 2GHz
HD Graphics 3000
~ 23 fps
HD Graphics 4400:
16.7 18.2 [X] Lenovo ThinkPad T440 20B6A002PB Intel Core i5-4200U 1.6GHz
HD Graphics 4400
22.6 22.7 [X] Fujitsu LifeBook U904 M0010PL Intel Core i7-4600U 2.1GHz
HD Graphics 4400
~ 20 fps
HD Graphics 3000:
11 12 [X] no model Intel Core i5-2500K 3.3GHz
HD Graphics 3000
13 [X] no model Intel Core i7-2820QM 2.3GHz
HD Graphics 3000
~ 12 fps
HD Graphics 4400:
9.6 [X] Fujitsu LifeBook U904 M0010PL Intel Core i7-4600U 2.1GHz
HD Graphics 4400
11.5 [X] Lenovo ThinkPad T440 20B6A002PB Intel Core i5-4200U 1.6GHz
HD Graphics 4400
12.3 ~ 11 fps
HD Graphics 4400:
3.8 [X] Fujitsu LifeBook U904 M0010PL Intel Core i7-4600U 2.1GHz
HD Graphics 4400
6.3 ~ 5 fps
HD Graphics 3000:
31.1 39 [X] Acer Aspire 3830TG-6431 Intel Core i5-2410M 2.3GHz
HD Graphics 3000
41 [X] Alienware M18x Intel Core i7-2920XM @4GHz
HD Graphics 3000
~ 37 fps
HD Graphics 3000:
12.4 16.3 [X] Acer Aspire 3830TG-6431 Intel Core i5-2410M 2.3GHz
HD Graphics 3000
16.6 [X] Alienware M18x Intel Core i7-2920XM @4GHz
HD Graphics 3000
~ 15 fps
HD Graphics 3000:
12.1 28 34 [X] no model Intel Core i5-2500K 3.3GHz
HD Graphics 3000
34 [X] MSI CX640-i547W7P Intel Core i5-2410M 2.3GHz
HD Graphics 3000
38 41 [X] no model Intel Core i7-2820QM 2.3GHz
HD Graphics 3000
44 [X] no model Intel Core i7-2600K 3.4GHz
HD Graphics 3000
~ 33 fps
HD Graphics 3000:
7.6 14.6 18 22 [X] no model Intel Core i7-2820QM 2.3GHz
HD Graphics 3000
22 [X] MSI CX640-i547W7P Intel Core i5-2410M 2.3GHz
HD Graphics 3000
25.4 [X] Asus N53SV HD3000 Intel Core i7-2720QM 2.2GHz
HD Graphics 3000
~ 18 fps
HD Graphics 3000:
4.6 10.5 14 [X] no model Intel Core i7-2820QM 2.3GHz
HD Graphics 3000
14 [X] MSI CX640-i547W7P Intel Core i5-2410M 2.3GHz
HD Graphics 3000
15.5 [X] Asus N53SV HD3000 Intel Core i7-2720QM 2.2GHz
HD Graphics 3000
~ 12 fps
HD Graphics 3000:
5 [X] no model Intel Core i5-2500K 3.3GHz
HD Graphics 3000
6 [X] MSI CX640-i547W7P Intel Core i5-2410M 2.3GHz
HD Graphics 3000
~ 6 fps
HD Graphics 3000:
55 [X] no model Intel Core i5-2500K 3.3GHz
HD Graphics 3000
61.7 [X] Asus N53SV HD3000 Intel Core i7-2720QM 2.2GHz
HD Graphics 3000
~ 58 fps
HD Graphics 3000:
16 [X] no model Intel Core i5-2500K 3.3GHz
HD Graphics 3000
fps
HD Graphics 3000:
12 [X] no model Intel Core i5-2500K 3.3GHz
HD Graphics 3000
fps
HD Graphics 4400:
48.4 fps
HD Graphics 3000:
19.5 [X] MSI CR640-048XPL Intel Core i3-2310M 2.1GHz
HD Graphics 3000
25.4 [X] Lenovo ThinkPad Edge E420s NWD2QPB Intel Core i3-2310M 2.1GHz
HD Graphics 3000
30 [X] Asus K53E-SX058V Intel Core i3-2310M 2.1GHz
HD Graphics 3000
31.1 [X] Dell Inspiron N411z (C0425821) Intel Core i3-2330M 2.2GHz
HD Graphics 3000
37.7 [X] HP ProBook 6360b LG632EA Intel Core i5-2410M 2.3GHz
HD Graphics 3000
37.9 [X] Fujitsu LifeBook P771 (VFY:P7710MF011PL) Intel Core i7-2617M 1.5GHz
HD Graphics 3000
38 39 [X] Asus B33E PL Intel Core i7-2620M 2.7GHz
HD Graphics 3000
39.5 57 [X] no model Intel Core i5-2500K 3.3GHz
HD Graphics 3000
60 [X] no model Intel Core i7-2820QM 2.3GHz
HD Graphics 3000
~ 38 fps
HD Graphics 4400:
18.4 fps
HD Graphics 3000:
9.7 [X] MSI CR640-048XPL Intel Core i3-2310M 2.1GHz
HD Graphics 3000
14.9 [X] Dell Inspiron N411z (C0425821) Intel Core i3-2330M 2.2GHz
HD Graphics 3000
15 [X] HP ProBook 6360b LG632EA Intel Core i5-2410M 2.3GHz
HD Graphics 3000
15.7 [X] Asus K53E-SX058V Intel Core i3-2310M 2.1GHz
HD Graphics 3000
16 16.1 [X] Fujitsu LifeBook P771 (VFY:P7710MF011PL) Intel Core i7-2617M 1.5GHz
HD Graphics 3000
16.3 [X] Lenovo ThinkPad Edge E420s NWD2QPB Intel Core i3-2310M 2.1GHz
HD Graphics 3000
17.4 18.4 [X] Asus B33E PL Intel Core i7-2620M 2.7GHz
HD Graphics 3000
19 [X] no model Intel Core i5-2500K 3.3GHz
HD Graphics 3000
22 [X] no model Intel Core i7-2820QM 2.3GHz
HD Graphics 3000
~ 16 fps
HD Graphics 3000:
7.7 [X] MSI CR640-048XPL Intel Core i3-2310M 2.1GHz
HD Graphics 3000
9.7 [X] HP ProBook 6360b LG632EA Intel Core i5-2410M 2.3GHz
HD Graphics 3000
10.1 [X] Dell Inspiron N411z (C0425821) Intel Core i3-2330M 2.2GHz
HD Graphics 3000
12.3 [X] Asus B33E PL Intel Core i7-2620M 2.7GHz
HD Graphics 3000
14 [X] no model Intel Core i5-2500K 3.3GHz
HD Graphics 3000
~ 11 fps
HD Graphics 4400:
45.8 fps
HD Graphics 3000:
37 40.6 [X] Asus U30SD-XA1 Intel HD 3000 Intel Core i5-2410M 2.3GHz
HD Graphics 3000
48.7 50.7 58.4 [X] Asus N53SV HD3000 Intel Core i7-2720QM 2.2GHz
HD Graphics 3000
60.5 [X] no model Intel Core i7-2820QM 2.3GHz
HD Graphics 3000
71.1 [X] no model Intel Core i7-2600K 3.4GHz
HD Graphics 3000
72.1 [X] no model Intel Core i5-2500K 3.3GHz
HD Graphics 3000
~ 55 fps
HD Graphics 4400:
17.8 fps
HD Graphics 3000:
14.7 15.3 [X] Asus U30SD-XA1 Intel HD 3000 Intel Core i5-2410M 2.3GHz
HD Graphics 3000
15.9 20.2 20.8 [X] no model Intel Core i7-2820QM 2.3GHz
HD Graphics 3000
20.9 [X] Asus N53SV HD3000 Intel Core i7-2720QM 2.2GHz
HD Graphics 3000
21.6 [X] no model Intel Core i5-2500K 3.3GHz
HD Graphics 3000
23.4 [X] no model Intel Core i7-2600K 3.4GHz
HD Graphics 3000
~ 19 fps
HD Graphics 3000:
5.7 [X] Asus U30SD-XA1 Intel HD 3000 Intel Core i5-2410M 2.3GHz
HD Graphics 3000
7.8 8.4 9.5 [X] no model Intel Core i5-2500K 3.3GHz
HD Graphics 3000
10 [X] no model Intel Core i7-2820QM 2.3GHz
HD Graphics 3000
10.8 [X] no model Intel Core i7-2600K 3.4GHz
HD Graphics 3000
~ 9 fps
HD Graphics 4400:
45.1 fps
HD Graphics 3000:
24.9 [X] HP ProBook 6360b LG632EA Intel Core i5-2410M 2.3GHz
HD Graphics 3000
33.8 [X] MSI CR640-048XPL Intel Core i3-2310M 2.1GHz
HD Graphics 3000
37.1 [X] Asus N53SV HD3000 Intel Core i7-2720QM 2.2GHz
HD Graphics 3000
~ 32 fps
HD Graphics 4400:
20.3 fps
HD Graphics 3000:
11.5 [X] HP ProBook 6360b LG632EA Intel Core i5-2410M 2.3GHz
HD Graphics 3000
14.9 [X] MSI CR640-048XPL Intel Core i3-2310M 2.1GHz
HD Graphics 3000
23.6 [X] Asus N53SV HD3000 Intel Core i7-2720QM 2.2GHz
HD Graphics 3000
~ 17 fps
HD Graphics 3000:
8.7 [X] HP ProBook 6360b LG632EA Intel Core i5-2410M 2.3GHz
HD Graphics 3000
9.3 [X] MSI CR640-048XPL Intel Core i3-2310M 2.1GHz
HD Graphics 3000
19.4 [X] Asus N53SV HD3000 Intel Core i7-2720QM 2.2GHz
HD Graphics 3000
~ 12 fps
HD Graphics 3000:
18.7 [X] MSI CR640-048XPL Intel Core i3-2310M 2.1GHz
HD Graphics 3000
19.7 [X] Toshiba Satellite Pro R850-122 Intel Core i3-2310M 2.1GHz
HD Graphics 3000
21.2 [X] HP ProBook 6360b LG632EA Intel Core i5-2410M 2.3GHz
HD Graphics 3000
22.4 [X] Samsung 350U2A-A01PL Intel Core i3-2357M 1.3GHz
HD Graphics 3000
28.7 [X] Asus K53E-SX058V Intel Core i3-2310M 2.1GHz
HD Graphics 3000
29.7 [X] Fujitsu LifeBook P771 (VFY:P7710MF011PL) Intel Core i7-2617M 1.5GHz
HD Graphics 3000
31.4 [X] Lenovo ThinkPad Edge E420s NWD2QPB Intel Core i3-2310M 2.1GHz
HD Graphics 3000
32.9 [X] Asus Zenbook UX21E-KX004V Intel Core i5-2467M 1.6GHz
HD Graphics 3000
33.4 [X] HP Folio 13 (B0N00AA) Intel Core i5-2467M 1.6GHz
HD Graphics 3000
34.2 [X] Samsung 400B2B-H01PL Intel Core i5-2410M 2.3GHz
HD Graphics 3000
34.5 [X] HP ProBook 4340s (B6M41EA) Intel Core i3-2370M 2.4GHz
HD Graphics 3000
35.4 38.2 [X] no model Intel Core i5-2500K 3.3GHz
HD Graphics 3000
38.7 [X] Samsung QX311-A01PL Intel Core i5-2410M 2.3GHz
HD Graphics 3000
40.9 [X] no model Intel Core i7-2820QM 2.3GHz
HD Graphics 3000
45.1 [X] no model Intel Core i7-2600K 3.4GHz
HD Graphics 3000
~ 32 fps
HD Graphics 3000:
13.3 [X] Samsung 350U2A-A01PL Intel Core i3-2357M 1.3GHz
HD Graphics 3000
16 [X] MSI CR640-048XPL Intel Core i3-2310M 2.1GHz
HD Graphics 3000
16.6 [X] Toshiba Satellite Pro R850-122 Intel Core i3-2310M 2.1GHz
HD Graphics 3000
17.8 [X] HP ProBook 6360b LG632EA Intel Core i5-2410M 2.3GHz
HD Graphics 3000
19.2 [X] Asus K53E-SX058V Intel Core i3-2310M 2.1GHz
HD Graphics 3000
19.6 [X] Lenovo ThinkPad Edge E420s NWD2QPB Intel Core i3-2310M 2.1GHz
HD Graphics 3000
19.8 [X] Fujitsu LifeBook P771 (VFY:P7710MF011PL) Intel Core i7-2617M 1.5GHz
HD Graphics 3000
21.1 21.7 [X] Samsung 400B2B-H01PL Intel Core i5-2410M 2.3GHz
HD Graphics 3000
21.7 [X] HP Folio 13 (B0N00AA) Intel Core i5-2467M 1.6GHz
HD Graphics 3000
22.2 [X] Asus Zenbook UX21E-KX004V Intel Core i5-2467M 1.6GHz
HD Graphics 3000
24.1 [X] Samsung QX311-A01PL Intel Core i5-2410M 2.3GHz
HD Graphics 3000
24.2 [X] Dell Vostro 3450 (Vostro0150) Intel Core i3-2310M 2.1GHz
HD Graphics 3000
24.2 [X] HP ProBook 4340s (B6M41EA) Intel Core i3-2370M 2.4GHz
HD Graphics 3000
26.2 [X] no model Intel Core i5-2500K 3.3GHz
HD Graphics 3000
30 [X] no model Intel Core i7-2600K 3.4GHz
HD Graphics 3000
30.6 [X] no model Intel Core i7-2820QM 2.3GHz
HD Graphics 3000
~ 22 fps
HD Graphics 3000:
12.7 [X] MSI CR640-048XPL Intel Core i3-2310M 2.1GHz
HD Graphics 3000
12.7 [X] HP Folio 13 (B0N00AA) Intel Core i5-2467M 1.6GHz
HD Graphics 3000
12.7 [X] HP ProBook 4340s (B6M41EA) Intel Core i3-2370M 2.4GHz
HD Graphics 3000
12.8 13.2 [X] Toshiba Satellite Pro R850-122 Intel Core i3-2310M 2.1GHz
HD Graphics 3000
13.6 [X] HP ProBook 6360b LG632EA Intel Core i5-2410M 2.3GHz
HD Graphics 3000
14.5 [X] Asus K53E-SX058V Intel Core i3-2310M 2.1GHz
HD Graphics 3000
15.9 [X] no model Intel Core i5-2500K 3.3GHz
HD Graphics 3000
17.7 [X] no model Intel Core i7-2820QM 2.3GHz
HD Graphics 3000
18.8 [X] no model Intel Core i7-2600K 3.4GHz
HD Graphics 3000
~ 14 fps
HD Graphics 3000:
12.7 [X] no model Intel Core i5-2500K 3.3GHz
HD Graphics 3000
12.7 [X] no model Intel Core i7-2600K 3.4GHz
HD Graphics 3000
12.7 [X] no model Intel Core i7-2820QM 2.3GHz
HD Graphics 3000
~ 13 fps
HD Graphics 3000:
37.6 [X] Samsung 350U2A-A01PL Intel Core i3-2357M 1.3GHz
HD Graphics 3000
40 [X] no model Intel Core i5-2500K 3.3GHz
HD Graphics 3000
45.7 [X] Asus N53SV HD3000 Intel Core i7-2720QM 2.2GHz
HD Graphics 3000
45.9 [X] Lenovo ThinkPad Edge E420s NWD2QPB Intel Core i3-2310M 2.1GHz
HD Graphics 3000
46.3 51.2 [X] Asus K53E-SX058V Intel Core i3-2310M 2.1GHz
HD Graphics 3000
53.1 [X] Samsung 400B2B-H01PL Intel Core i5-2410M 2.3GHz
HD Graphics 3000
58.6 [X] HP Folio 13 (B0N00AA) Intel Core i5-2467M 1.6GHz
HD Graphics 3000
70.5 [X] Fujitsu LifeBook P771 (VFY:P7710MF011PL) Intel Core i7-2617M 1.5GHz
HD Graphics 3000
~ 50 fps
HD Graphics 3000:
7 [X] no model Intel Core i5-2500K 3.3GHz
HD Graphics 3000
7.2 [X] Fujitsu LifeBook P771 (VFY:P7710MF011PL) Intel Core i7-2617M 1.5GHz
HD Graphics 3000
8.8 [X] Asus N53SV HD3000 Intel Core i7-2720QM 2.2GHz
HD Graphics 3000
9.3 [X] HP Folio 13 (B0N00AA) Intel Core i5-2467M 1.6GHz
HD Graphics 3000
10.3 [X] Samsung 400B2B-H01PL Intel Core i5-2410M 2.3GHz
HD Graphics 3000
~ 9 fps
HD Graphics 3000:
3 (!) [X] Alienware M18x Intel Core i7-2920XM @4GHz
HD Graphics 3000
fps
HD Graphics 3000:
63 93 111 164 [X] no model Intel Core i5-2500K 3.3GHz
HD Graphics 3000
~ 108 fps
HD Graphics 4400:
31.8 fps
HD Graphics 3000:
25.9 33 [X] no model Intel Core i5-2500K 3.3GHz
HD Graphics 3000
38 45 ~ 35 fps
HD Graphics 3000:
18 [X] no model Intel Core i5-2500K 3.3GHz
HD Graphics 3000
23 ~ 21 fps
HD Graphics 3000:
59.4 84 [X] no model Intel Core i7-2820QM 2.3GHz
HD Graphics 3000
~ 72 fps
HD Graphics 3000:
18.1 32 [X] no model Intel Core i7-2820QM 2.3GHz
HD Graphics 3000
~ 25 fps
HD Graphics 3000:
11.2 fps
HD Graphics 3000:
-1 [X] no model Intel Core i5-2500K 3.3GHz
HD Graphics 3000
-1 ~ -1 fps
HD Graphics 3000:
117.1 [X] Asus N53SV HD3000 Intel Core i7-2720QM 2.2GHz
HD Graphics 3000
fps
HD Graphics 3000:
55 [X] no model Intel Core i7-2820QM 2.3GHz
HD Graphics 3000
69.3 [X] Asus N53SV HD3000 Intel Core i7-2720QM 2.2GHz
HD Graphics 3000
72 [X] no model Intel Core i7-2600K 3.4GHz
HD Graphics 3000
~ 65 fps
HD Graphics 3000:
62.7 [X] Asus N53SV HD3000 Intel Core i7-2720QM 2.2GHz
HD Graphics 3000
fps
HD Graphics 3000:
18.8 [X] Asus N53SV HD3000 Intel Core i7-2720QM 2.2GHz
HD Graphics 3000
fps
HD Graphics 3000:
25.7 31.8 35.5 [X] Toshiba Satellite Pro R850-122 Intel Core i3-2310M 2.1GHz
HD Graphics 3000
~ 31 fps
HD Graphics 3000:
21.6 [X] Toshiba Satellite Pro R850-122 Intel Core i3-2310M 2.1GHz
HD Graphics 3000
22.3 26.1 ~ 23 fps
HD Graphics 3000:
99 125 127 127 128 [X] MSI CX640-i547W7P Intel Core i5-2410M 2.3GHz
HD Graphics 3000
~ 121 fps
HD Graphics 3000:
21.2 36.6 41 [X] MSI CX640-i547W7P Intel Core i5-2410M 2.3GHz
HD Graphics 3000
42 42 49.5 [X] no model Intel Core i5-2500K 3.3GHz
HD Graphics 3000
~ 39 fps
HD Graphics 3000:
11 (!) [X] Toshiba Portégé Z830-10N Intel Core i3-2367M 1.4GHz
HD Graphics 3000
13 [X] MSI CX640-i547W7P Intel Core i5-2410M 2.3GHz
HD Graphics 3000
14.2 [X] no model Intel Core i5-2500K 3.3GHz
HD Graphics 3000
~ 13 fps
HD Graphics 3000:
62.3 [X] MSI CR640-048XPL Intel Core i3-2310M 2.1GHz
HD Graphics 3000
63.2 [X] Toshiba Satellite Pro R850-122 Intel Core i3-2310M 2.1GHz
HD Graphics 3000
83 [X] no model Intel Core i5-2500K 3.3GHz
HD Graphics 3000
~ 70 fps
HD Graphics 3000:
30.4 [X] MSI CR640-048XPL Intel Core i3-2310M 2.1GHz
HD Graphics 3000
30.6 [X] Toshiba Satellite Pro R850-122 Intel Core i3-2310M 2.1GHz
HD Graphics 3000
35 [X] no model Intel Core i5-2500K 3.3GHz
HD Graphics 3000
~ 32 fps
HD Graphics 3000:
12 [X] no model Intel Core i5-2500K 3.3GHz
HD Graphics 3000
fps
HD Graphics 3000:
16.9 19 28.2 34.7 [X] no model Intel Core i7-2820QM 2.3GHz
HD Graphics 3000
38.1 54.9 [X] no model Intel Core i5-2500K 3.3GHz
HD Graphics 3000
~ 32 fps
HD Graphics 3000:
5.1 11.1 13 18.5 [X] no model Intel Core i5-2500K 3.3GHz
HD Graphics 3000
~ 12 fps
HD Graphics 4400:
21 42.5 ~ 32 fps
HD Graphics 3000:
24.8 35 [X] MSI CX640-i547W7P Intel Core i5-2410M 2.3GHz
HD Graphics 3000
35.3 42.2 [X] no model Intel Core i7-2820QM 2.3GHz
HD Graphics 3000
44 [X] no model Intel Core i5-2500K 3.3GHz
HD Graphics 3000
~ 36 fps
HD Graphics 4400:
23.7 fps
HD Graphics 3000:
17 [X] MSI CX640-i547W7P Intel Core i5-2410M 2.3GHz
HD Graphics 3000
17.4 18 [X] no model Intel Core i7-2820QM 2.3GHz
HD Graphics 3000
24.8 [X] no model Intel Core i5-2500K 3.3GHz
HD Graphics 3000
~ 19 fps
HD Graphics 3000:
10.6 11.6 [X] no model Intel Core i5-2500K 3.3GHz
HD Graphics 3000
12 [X] MSI CX640-i547W7P Intel Core i5-2410M 2.3GHz
HD Graphics 3000
~ 11 fps
HD Graphics 3000:
3.1 [X] no model Intel Core i5-2500K 3.3GHz
HD Graphics 3000
fps
HD Graphics 4400:
37.9 fps
HD Graphics 3000:
26 34.2 36 [X] MSI CX640-i547W7P Intel Core i5-2410M 2.3GHz
HD Graphics 3000
44.1 [X] no model Intel Core i7-2820QM 2.3GHz
HD Graphics 3000
~ 35 fps
HD Graphics 4400:
19.9 fps
HD Graphics 3000:
15 [X] MSI CX640-i547W7P Intel Core i5-2410M 2.3GHz
HD Graphics 3000
15.6 [X] no model Intel Core i7-2820QM 2.3GHz
HD Graphics 3000
16.2 ~ 16 fps
HD Graphics 3000:
9.4 11 [X] MSI CX640-i547W7P Intel Core i5-2410M 2.3GHz
HD Graphics 3000
~ 10 fps
HD Graphics 3000:
33 40 41 69 [X] MSI CX640-i547W7P Intel Core i5-2410M 2.3GHz
HD Graphics 3000
71 88 [X] no model Intel Core i7-2820QM 2.3GHz
HD Graphics 3000
~ 57 fps
HD Graphics 3000:
11 12 14 22 26 [X] MSI CX640-i547W7P Intel Core i5-2410M 2.3GHz
HD Graphics 3000
32 [X] no model Intel Core i7-2820QM 2.3GHz
HD Graphics 3000
~ 20 fps
HD Graphics 3000:
4 9 10 11 [X] MSI CX640-i547W7P Intel Core i5-2410M 2.3GHz
HD Graphics 3000
14 [X] no model Intel Core i7-2820QM 2.3GHz
HD Graphics 3000
~ 10 fps
HD Graphics 3000:
4 [X] no model Intel Core i7-2820QM 2.3GHz
HD Graphics 3000
4 [X] MSI CX640-i547W7P Intel Core i5-2410M 2.3GHz
HD Graphics 3000
4 ~ 4 fps
HD Graphics 3000:
9.1 [X] Toshiba Satellite Pro R850-122 Intel Core i3-2310M 2.1GHz
HD Graphics 3000
10 ~ 10 fps
HD Graphics 3000:
107 [X] MSI CX640-i547W7P Intel Core i5-2410M 2.3GHz
HD Graphics 3000
123 [X] no model Intel Core i7-2820QM 2.3GHz
HD Graphics 3000
140.5 [X] no model Intel Core i5-2500K 3.3GHz
HD Graphics 3000
~ 124 fps
HD Graphics 3000:
49 [X] no model Intel Core i5-2500K 3.3GHz
HD Graphics 3000
fps
HD Graphics 3000:
61 73 93 103 [X] MSI CX640-i547W7P Intel Core i5-2410M 2.3GHz
HD Graphics 3000
125 129 [X] no model Intel Core i7-2820QM 2.3GHz
HD Graphics 3000
~ 97 fps
HD Graphics 3000:
32 39 [X] MSI CX640-i547W7P Intel Core i5-2410M 2.3GHz
HD Graphics 3000
47 48 [X] no model Intel Core i7-2820QM 2.3GHz
HD Graphics 3000
58 74 ~ 50 fps
HD Graphics 3000:
6 8 12 [X] MSI CX640-i547W7P Intel Core i5-2410M 2.3GHz
HD Graphics 3000
12 13 [X] no model Intel Core i7-2820QM 2.3GHz
HD Graphics 3000
~ 10 fps
HD Graphics 4400:
7 8 9 9 11 ~ 9 fps
HD Graphics 3000:
75 110 [X] no model Intel Core i7-2820QM 2.3GHz
HD Graphics 3000
~ 93 fps
HD Graphics 3000:
23.5 fps
HD Graphics 3000:
22 37.6 46.8 [X] no model Intel Core i7-2820QM 2.3GHz
HD Graphics 3000
48.6 [X] no model Intel Core i5-2500K 3.3GHz
HD Graphics 3000
~ 39 fps
HD Graphics 3000:
203 241.7 [X] no model Intel Core i7-2820QM 2.3GHz
HD Graphics 3000
~ 222 fps
v1.26
log 26. 21:05:02
#0 checking url part for id 6474 +0s ... 0s
#1 checking url part for id 4575 +0s ... 0s
#2 checking url part for id 1956 +0s ... 0s
#3 not redirecting to Ajax server +0s ... 0s
#4 did not recreate cache, as it is less than 5 days old! Created at Thu, 25 Apr 2024 05:40:10 +0200 +0.001s ... 0.001s
#5 composed specs +0.133s ... 0.134s
#6 did output specs +0s ... 0.134s
#7 start showIntegratedCPUs +0s ... 0.134s
#8 getting avg benchmarks for device 6474 +0.049s ... 0.183s
#9 got single benchmarks 6474 +0s ... 0.183s
#10 getting avg benchmarks for device 4575 +0.017s ... 0.201s
#11 got single benchmarks 4575 +0.279s ... 0.48s
#12 getting avg benchmarks for device 1956 +0.003s ... 0.483s
#13 got single benchmarks 1956 +0.476s ... 0.959s
#14 got avg benchmarks for devices +0s ... 0.959s
#15 No cached benchmark found, getting uncached values +0.465s ... 1.424s
#16 min, max, avg, median took s +0.018s ... 1.443s
#17 before gaming benchmark output +0s ... 1.443s
#18 Got 2336 rows for game benchmarks. +0.196s ... 1.639s
#19 composed SQL query for gamebenchmarks +0s ... 1.639s
#20 got data and put it in $dataArray +0.163s ... 1.802s
#21 benchmarks composed for output. +0.482s ... 2.284s
#22 calculated avg scores. +0s ... 2.284s
#23 return log +0.007s ... 2.291s
Teilen Sie diesen Artikel, um uns zu unterstützen. Jeder Link hilft!
Autor: Klaus Hinum, 8.09.2017 (Update: 1.07.2023)
 Deutsch
 English
 Español
 Français
 Italiano
 Nederlands
 Polski
 Português
 Русский
 Türkçe
 Svenska
 Chinese
 Magyar