Notebookcheck Logo

NVIDIA GeForce RTX 2080 Super (Desktop) vs AMD Radeon RX 7900 GRE vs NVIDIA Titan RTX

NVIDIA GeForce RTX 2080 Super (Desktop)

► remove from comparison NVIDIA GeForce RTX 2080 Super (Desktop)

Die Nvidia GeForce RTX 2080 Super (2080S) ist eine High-End Desktop Grafikkarte von Mitte 2019. Die RTX 2080 Super ist das Facelift-Modell der älteren Nvidia GeForce RTX 2080 und bietet eine etwas gesteigerte Performance. Damit schließt diese die Lücke zur etwas schnelleren Nvidia GeForce RTX 2080 Ti und ist zum Release am 02.07.2019 die zweitschnellste Grafikkarte auf Basis der Turing-Architektur für Consumer nach der schnelleren RTX 2080 Ti. Die GPU verfügt über 3.072 Shadereinheiten / Kerne und basiert weiterhin auf dem TU104-Chip (Nvidia GeForce RTX 2080 = TU104, 2.944 Kerne). Der VRAM bietet zwar weiterhin 8-GB-GDDR6-Speicher und ein 256-Bit-Interface, allerdings steigt die Taktrate auf 15,5 GHz, woraus eine höhere Speicherbandbreite von 496,1 GB/s resultiert.

Features

Der TU104-Chip wird in 12nm gefertigt und bietet eine Reihe neuer Features, wie DLSS (Deep Learning Super Sampling) und Real Time Ray Tracing. Dadurch lassen sich vor allem Beleuchtungseffekte sehr viel realistischer darstellen. Weiterhin gibt es Support für DisplayPort 1.4 (ready), HDMI 2.0b, HDR, Simultaneous Multi-Projection (SMP) sowie H.265 Video De- und Encoding (PlayReady 3.0). Außerdem haben die Nutzer einer Nvidia GeForce RTX 2080S die Möglichkeit NVLink einzusetzen.

Performance

Die Performance der GeForce RTX 2080 Super liegt etwas über dem Niveau einer Nvidia Titan XP. Werden auch die neuen Features unterstützt, so ist die GeForce RTX 2080S der GeForce GTX 1080 Ti deutlich überlegen. Damit ordnet sich die RTX 2080 Super im absoluten High-End-Segment ein und kann die meisten Spiele der Jahre 2018 und 2019 in hohen Einstellungen und in 2.160p flüssig darstellen. 

Leistungsaufnahme

Die Leistungsaufnahme der GeForce RTX 2080 Super wird vom Hersteller mit 250 Watt beziffert und liegt damit etwas über dem Vorgängermodell (GeForce RTX 2080 215 Watt). Im Vergleich zur ähnlich schnellen Nvidia Titan XP, ist der Stromverbrauch jedoch identisch. Die Leistung pro Watt konnte allerdings deutlich gesteigert werden.

AMD Radeon RX 7900 GRE

► remove from comparison AMD Radeon RX 7900 GRE

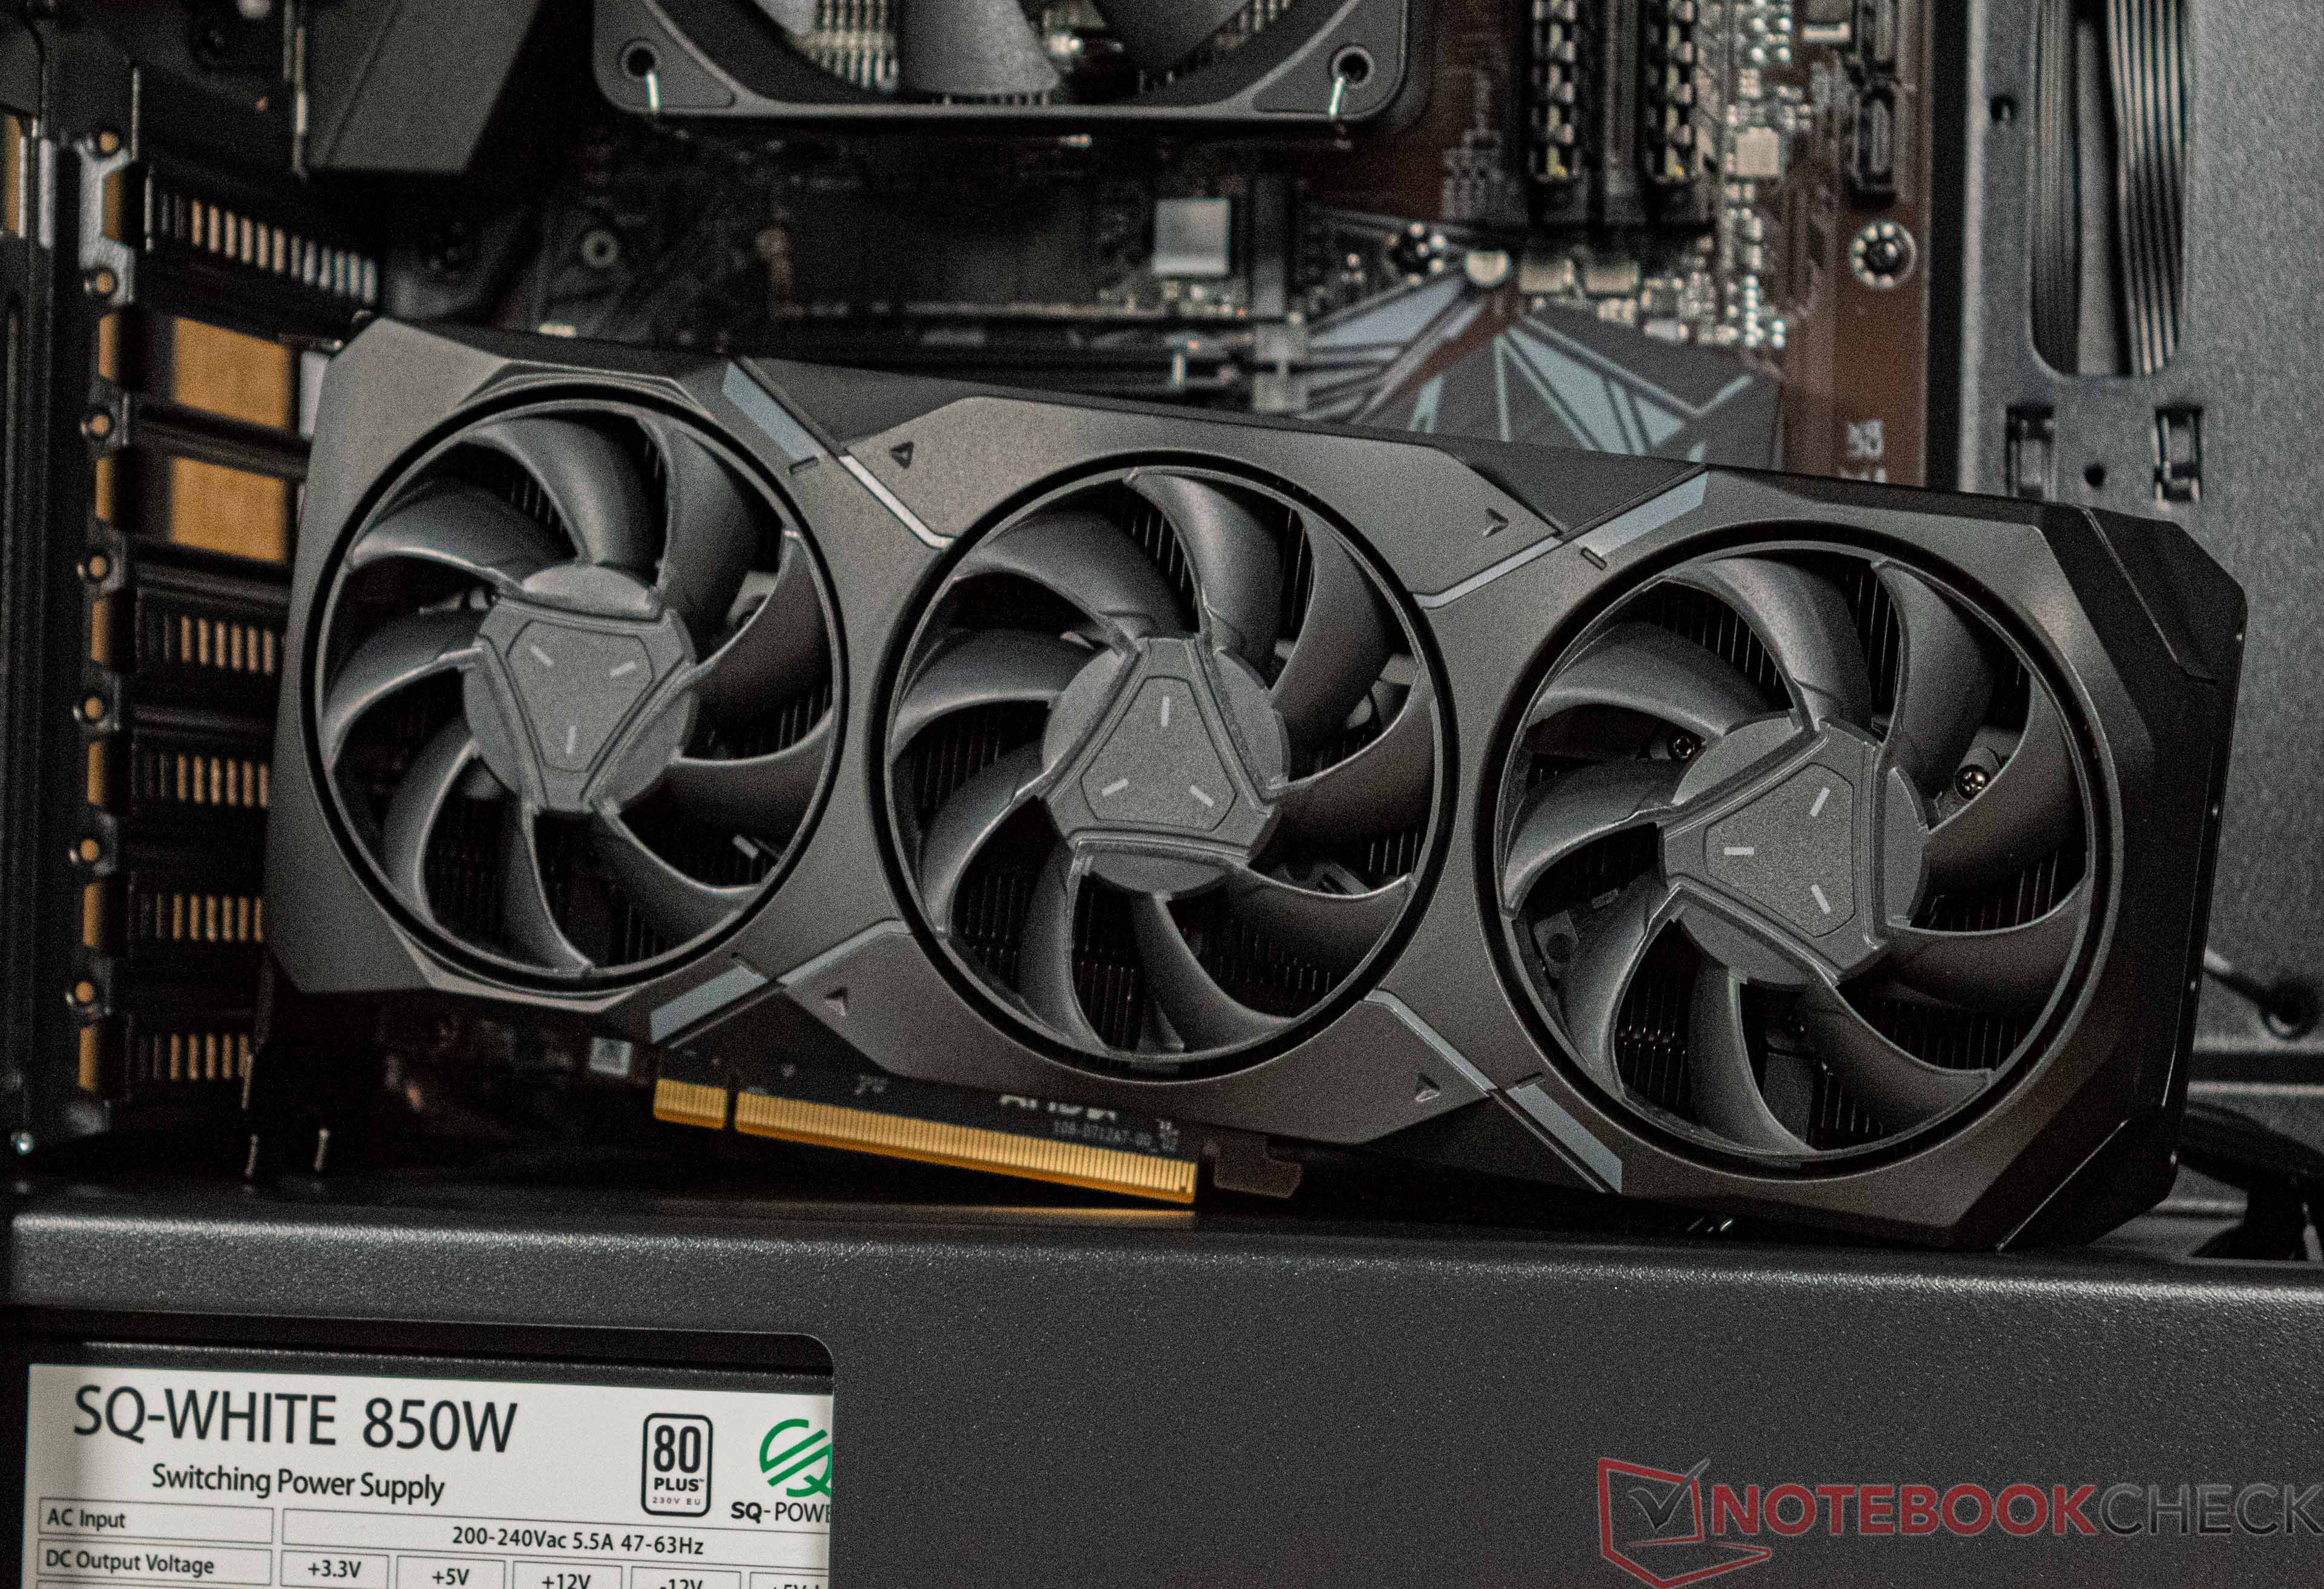
Die AMD Radeon RX 7900 GRE ist eine Desktop-GPU und primär für das Gaming in 1.440p ausgelegt. Der Grafikchip wird im 5 nm Verfahren bei TSMC gefertigt. Das Chiplet-Design kommt auch bei der AMD Radeon RX 7900 GRE zum Einsatz, wenngleich hier aber nur vier der sechs MCDs aktiv sind. Daraus resultiert auch das geringere VRAM (16 GB GDDR6) gegenüber einer AMD Radeon RX 7900 XT (20 GB GDDR6) oder der AMD Radeon RX 7900 XTX (24 GB GDDR6). Die Anzahl der Shadereinheiten reduziert sich ebenfalls und beträgt nunmehr 5.120, was genauso viel ist wie bei einer AMD Radeon RX 6950 XT.

Features

RDNA 3 dient weiterhin als Basis für den Navi 31 getauften Grafikchip. Die bereits etablierten Features wie SAM (Smart Access Memory) und der Infinity Cache gibt es auch bei der 7900er-Serie. Gleichwohl wurden der Raytracing-Part überarbeitet und eine hardwareseitige AI-Unterstützung implementiert. Die Media Engine wurde erneuert und Videos mit einer Auflösung von bis zu 8K dekodieren/enkodieren. Dabei kann auch der neue AV1-Codec verwendet werden. Bildschirme mit bis zu 8K bei 165 Hz inklusive HDR oder 4K HDR mit 480Hz angesprochen werden. Dies ermöglicht der DisplayPort-Anschluss, welcher nun in der Version 2.1 verwendet wird. AMDs Counterpart zu DLSS heißt FSR 2.0 und bietet mit der Upscaling-Option eine deutliche Performance-Steigerung in Spielen. 

Performance

Die Leistung der AMD Radeon RX 7900 GRE positioniert sich in Spielen ohne Raytracing zwischen auf dem gleichen Level wie eine AMD Radeon RX 6950 XT. Gegenüber Nvidia konkurriert die AMD Radeon RX 7900 GRE mit einer Nvidia GeForce RTX 4070 Ti.

Leistungsaufnahme

Die Leistungsaufnahme der AMD Radeon RX 7900 GRE wird vom Hersteller mit 260 Watt (TBP) beziffert und ist damit deutlich sparsamer als eine AMD Radeon RX 6950 XT (335 Watt). Im Vergleich zur Nvidia GeForce RTX 4070 Ti ist die AMD Radeon RX 7900 GRE 25 Watt etwas sparsamer.

NVIDIA Titan RTX

► remove from comparison

Die Nvidia Titan RTX bietet mit dem Vollausbau des TU102-Grafikprozessors nochmals mehr Leistung als das bisherige Topmodell Nvidia GeForce RTX 2080 Ti. Dieses Topmodell für High-End-Consumer auf Basis der aktuellen Turing-Grafikkarten für Desktop-PCs wurde im Dezember 2018 vorgestellt. Die GPU verfügt über die 4.608 Shadereinheiten, sowie 24 GB GDDR6-Speicher an einem 384-Bit-Interface (14 GHz, 672 GB/s). Zusätzlich integriert die 2080 Ti 576 Tensor-Kerne und 72 Raytracing-Kerne.

Features

Der TU102-Chip wird in 12nm gefertigt und bietet eine Reihe neuer Features, wie DLSS (Deep Learning Super Sampling) und Real Time Ray Tracing. Dadurch lassen sich vor allem Bleuchtungseffekte sehr viel realistischer darstellen. Weiterhin gibt es Support für DisplayPort 1.4 (ready), HDMI 2.0b, HDR, Simultaneous Multi-Projection (SMP) sowie H.265 Video De- und Encoding (PlayReady 3.0). Im Vollausbau bietet der TU102 4.608 Shader, 576 Tensor Kerne und 72 Raytracing Kerne. Damit bietet die Nvidia Titan RTX die gleichen Spezifikationen wie die Nvidia Quadro RTX 8000. Leider bleiben die vielen Quadro-Features weiterhin nur der teureren Quadro-Familie erhalten. 

Performance

Die Performance der Titan RTX liegt in 4K zwar vor der GeForce RTX 2080 ti, jedoch ist dieser mit wenigen Prozent schon fast zu vernachlässigen. Eine übertaktete RTX 2080 ti sollte somit einer Titan RTX wieder überlegen sein. Im Gegen die Titan X auf Pascal-Basis kann sich das Turing-Modell einen Vorsprung von bis zu 30 % erzielen. Mit dieser Leistung ordnet sich die Titan RTX zweifelsohne im High-End-Segment ein und kann die meisten Spiele des Jahres 2018 in hohen Einstellungen und 4K-Auflösung flüssig darstellen.

Leistungsaufnahme

Die Leistungsaufnahme der Nvidia Titan RTX wird vom Hersteller mit 280 Watt beziffert. Im Vergleich zur Titan X (Pascal) benötigt das neue Spitzenmodell bei voller Auslastung 30 Watt mehr.

NVIDIA GeForce RTX 2080 Super (Desktop)AMD Radeon RX 7900 GRENVIDIA Titan RTX
GeForce RTX 2000 Serie
Titan RTX 4608 @ 1.35 - 1.77 GHz384 Bit @ 14000 MHz
GeForce RTX 2080 Ti (Desktop) 4352 @ 1.35 - 1.55 GHz352 Bit @ 14000 MHz
GeForce RTX 2080 Super (Desktop) 3072 @ 1.65 - 1.82 GHz256 Bit @ 15500 MHz
GeForce RTX 2080 (Desktop) 2944 @ 1.52 - 1.71 GHz256 Bit @ 14000 MHz
GeForce RTX 2080 Super Mobile 3072 @ 1.37 - 1.56 GHz256 Bit @ 14000 MHz
GeForce RTX 2080 Mobile 2944 @ 1.38 - 1.59 GHz256 Bit @ 14000 MHz
GeForce RTX 2070 Super (Desktop) 2560 @ 1.61 - 1.77 GHz256 Bit @ 14000 MHz
GeForce RTX 2070 (Desktop) 2304 @ 1.41 - 1.62 GHz256 Bit @ 14000 MHz
GeForce RTX 2070 Super Mobile 2560 @ 1.14 - 1.38 GHz256 Bit @ 14002 MHz
GeForce RTX 2080 Super Max-Q 3072 @ 0.98 - 1.23 GHz256 Bit @ 11000 MHz
GeForce RTX 2060 Super (Desktop) 2176 @ 1.47 - 1.65 GHz256 Bit @ 14000 MHz
GeForce RTX 2070 Mobile 2304 @ 1.22 - 1.44 GHz256 Bit @ 14000 MHz
GeForce RTX 2080 Max-Q 2944 @ 0.74 - 1.1 GHz256 Bit @ 12000 MHz
GeForce RTX 2060 (Desktop) 1920 @ 1.32 - 1.62 GHz192 Bit @ 14000 MHz
GeForce RTX 2070 Super Max-Q 2560 @ 0.93 - 1.16 GHz256 Bit @ 11000 MHz
GeForce RTX 2070 Max-Q 2304 @ 0.89 - 1.19 GHz256 Bit @ 12000 MHz
GeForce RTX 2060 Mobile 1920 @ 0.96 - 1.2 GHz192 Bit @ 14000 MHz
GeForce RTX 2060 Max-Q 1920 @ 0.98 - 1.19 GHz192 Bit @ 11000 MHz
GeForce RTX 2050 Mobile 2048 @ 1.48 GHz64 Bit @ 14000 MHz
Radeon RX 7900 XTX 6144 @ 2.27 GHz384 Bit @ 20000 MHz
Radeon RX 7900 XT 5376 @ 2 GHz320 Bit @ 20000 MHz
Radeon RX 7900 GRE 5120 @ 2.25 GHz256 Bit @ 18000 MHz
Radeon RX 7800 XT 3840 @ 2.43 GHz256 Bit @ 19500 MHz
Radeon RX 7700 XT 3456 @ 1.7 - 2.54 GHz192 Bit @ 18000 MHz
Titan RTX 4608 @ 1.35 - 1.77 GHz384 Bit @ 14000 MHz
GeForce RTX 2080 Ti (Desktop) 4352 @ 1.35 - 1.55 GHz352 Bit @ 14000 MHz
GeForce RTX 2080 Super (Desktop) 3072 @ 1.65 - 1.82 GHz256 Bit @ 15500 MHz
GeForce RTX 2080 (Desktop) 2944 @ 1.52 - 1.71 GHz256 Bit @ 14000 MHz
GeForce RTX 2080 Super Mobile 3072 @ 1.37 - 1.56 GHz256 Bit @ 14000 MHz
GeForce RTX 2080 Mobile 2944 @ 1.38 - 1.59 GHz256 Bit @ 14000 MHz
GeForce RTX 2070 Super (Desktop) 2560 @ 1.61 - 1.77 GHz256 Bit @ 14000 MHz
GeForce RTX 2070 (Desktop) 2304 @ 1.41 - 1.62 GHz256 Bit @ 14000 MHz
GeForce RTX 2070 Super Mobile 2560 @ 1.14 - 1.38 GHz256 Bit @ 14002 MHz
GeForce RTX 2080 Super Max-Q 3072 @ 0.98 - 1.23 GHz256 Bit @ 11000 MHz
GeForce RTX 2060 Super (Desktop) 2176 @ 1.47 - 1.65 GHz256 Bit @ 14000 MHz
GeForce RTX 2070 Mobile 2304 @ 1.22 - 1.44 GHz256 Bit @ 14000 MHz
GeForce RTX 2080 Max-Q 2944 @ 0.74 - 1.1 GHz256 Bit @ 12000 MHz
GeForce RTX 2060 (Desktop) 1920 @ 1.32 - 1.62 GHz192 Bit @ 14000 MHz
GeForce RTX 2070 Super Max-Q 2560 @ 0.93 - 1.16 GHz256 Bit @ 11000 MHz
GeForce RTX 2070 Max-Q 2304 @ 0.89 - 1.19 GHz256 Bit @ 12000 MHz
GeForce RTX 2060 Mobile 1920 @ 0.96 - 1.2 GHz192 Bit @ 14000 MHz
GeForce RTX 2060 Max-Q 1920 @ 0.98 - 1.19 GHz192 Bit @ 11000 MHz
GeForce RTX 2050 Mobile 2048 @ 1.48 GHz64 Bit @ 14000 MHz
CodenameTuring TU104Navi 31Turing TU102
ArchitekturTuringRDNA 3Turing
Pipelines3072 - unified5120 - unified4608 - unified
Kerntakt1650 - 1815 (Boost) MHz2245 (Boost) MHz1350 - 1770 (Boost) MHz
Speichertakt15500 MHz18000 effective = 2250 MHz14000 MHz
Speicherbandbreite256 Bit256 Bit384 Bit
SpeichertypGDDR6GDDR6GDDR6
Max. Speichergröße8 GB16 GB24 GB
Shared Memoryneinneinnein
APIDirectX 12_1, Shader 6.4, OpenGL 4.6DirectX 12 Ultimate (12_2), Shader 6.7, OpenGL 4.6, OpenCL 2.2, Vulkan 1.3DirectX 12_1, Shader 6.4, OpenGL 4.6
Transistors13.6 Billion57.7 Billion18.6 Billion
Herstellungsprozess12 nm5 nm12 nm
FeaturesDLSS, Raytraycing, NVLink, VR Ready, G-SYNC, Vulkan, Multi Monitor, 650 Watt system power recommendedNVLink, DLSS, Raytraycing, VR Ready, G-SYNC, Vulkan, Multi Monitor, 650 Watt system power recommended
Erscheinungsdatum02.07.2019 27.07.2023 03.12.2018
TMUs320
ROPs160
Raytracing Cores80
Tensor / AI Cores160
Theoretical Performance91.96 TFLOPS FP16, 45.98 TFLOPS FP32, 1.437 TFLOPS FP64
CacheL2: 6 MB, L3: 64 MB
Memory Bandwidth576 GB/s
Stromverbrauch260 Watt280 Watt
Die Size 520 mm²
PCIe4.0 x16
Displays4 Displays (max.), HDMI 2.1a, DisplayPort 2.1 UHBR13.5
Herstellerseitewww.amd.com

Benchmarks

Performance Rating - 3DMark 11 + Fire Strike + Time Spy - GeForce RTX 2080 Super (Desktop)
10.3 pt (31%)
Restrict / Search: Model: Max. age: years
Performance Rating - 3DMark 11 + Fire Strike + Time Spy - Radeon RX 7900 GRE
20.4 pt (61%)
Restrict / Search: Model: Max. age: years
Performance Rating - 3DMark 11 + Fire Strike + Time Spy - Titan RTX
13.4 pt (40%)
Restrict / Search: Model: Max. age: years
3DMark - 3DMark Speed Way Score
min: 4067     avg: 4072     median: 4072 (27%)     max: 4077 Points
min: 3182     avg: 3191     median: 3186 (22%)     max: 3205 Points
3DMark - 3DMark Steel Nomad
3779 Points (26%)
3DMark - 3DMark Steel Nomad Light
15462 Points (35%)
3DMark - 3DMark Wild Life Unlimited
71949 Points (36%)
96465 Points (49%)
3DMark - 3DMark Solar Bay
68829 Points (32%)
3DMark - 3DMark Fire Strike Standard Score
min: 21093     avg: 23130     median: 23364 (35%)     max: 24697 Points
min: 38476     avg: 42408     median: 42407.5 (64%)     max: 46339 Points
min: 20679     avg: 28156     median: 27999 (42%)     max: 35830 Points
3DMark - 3DMark Fire Strike Standard Graphics
min: 26824     avg: 27647     median: 27398 (25%)     max: 28968 Points
min: 54400     avg: 54610     median: 54609.5 (50%)     max: 54819 Points
min: 33377     avg: 36062     median: 35884 (33%)     max: 40910 Points
3DMark - 3DMark Ice Storm Graphics
min: 285953     avg: 342060     median: 327518 (36%)     max: 412709 Points
min: 446871     avg: 555420     median: 555420 (61%)     max: 663969 Points
min: 304286     avg: 499679     median: 510836 (57%)     max: 708281 Points
3DMark - 3DMark Time Spy Score
min: 9969     avg: 11002     median: 11215.5 (29%)     max: 11609 Points
min: 17905     avg: 19037     median: 19036.5 (49%)     max: 20168 Points
min: 10798     avg: 13874     median: 14007 (36%)     max: 15955 Points
3DMark - 3DMark Time Spy Graphics
min: 11313     avg: 11439     median: 11450 (23%)     max: 11542 Points
min: 20497     avg: 20659     median: 20658.5 (42%)     max: 20820 Points
min: 14216     avg: 14893     median: 14961.5 (30%)     max: 15283 Points
3DMark - 3DMark Ice Storm Unlimited Graphics
min: 434157     avg: 497073     median: 515887 (52%)     max: 541176 Points
min: 560812     avg: 637522     median: 637522 (64%)     max: 714232 Points
min: 386786     avg: 573459     median: 537413 (54%)     max: 798347 Points
3DMark - 3DMark Ice Storm Extreme Graphics
min: 276319     avg: 318195     median: 296636 (35%)     max: 381630 Points
min: 431805     avg: 523496     median: 523496 (61%)     max: 615187 Points
min: 290154     avg: 456832     median: 461607 (54%)     max: 615600 Points
3DMark - 3DMark Cloud Gate Score
min: 37925     avg: 50367     median: 50596.5 (48%)     max: 62350 Points
min: 71793     avg: 78905     median: 78905 (75%)     max: 86017 Points
min: 24891     avg: 59427     median: 63672.5 (60%)     max: 81469 Points
3DMark - 3DMark Cloud Gate Graphics
min: 136360     avg: 142320     median: 140388 (35%)     max: 152144 Points
min: 247050     avg: 247366     median: 247366 (61%)     max: 247681 Points
min: 145389     avg: 176948     median: 177234 (44%)     max: 202725 Points
3DMark - 3DMark Night Raid
min: 41514     avg: 51334     median: 54996 (52%)     max: 57491 Points
min: 64416     avg: 75977     median: 75976.5 (72%)     max: 87537 Points
min: 0     avg: 50876     median: 56519 (53%)     max: 88698 Points
3DMark - 3DMark Night Raid Graphics Score
min: 85538     avg: 103690     median: 109596 (42%)     max: 115936 Points
min: 169156     avg: 190129     median: 190128 (73%)     max: 211101 Points
min: 79576     avg: 126974     median: 132210 (51%)     max: 174384 Points
3DMark 11 - 3DM11 Performance Score
min: 24934     avg: 27272     median: 26415.5 (32%)     max: 31323 Points
min: 39261     avg: 45225     median: 45225 (55%)     max: 51189 Points
min: 23108     avg: 34679     median: 34920 (42%)     max: 44979 Points
3DMark 11 - 3DM11 Performance GPU
min: 37958     avg: 40354     median: 40963 (31%)     max: 41532 Points
min: 66008     avg: 67134     median: 67134 (51%)     max: 68260 Points
min: 43461     avg: 49115     median: 49602 (38%)     max: 51863 Points
3DMark Vantage
3DM Vant. Perf. total + AMD Radeon RX 7900 GRE
3DMark Vantage - 3DM Vant. Perf. total
min: 110273     avg: 122732     median: 122732 (36%)     max: 135190 Points
3DM Vant. Perf. total + NVIDIA Titan RTX
min: 71673     avg: 98814     median: 99561 (29%)     max: 120336 Points
3DM Vant. Perf. GPU no PhysX + AMD Radeon RX 7900 GRE
3DMark Vantage - 3DM Vant. Perf. GPU no PhysX
min: 128176     avg: 138530     median: 138530 (76%)     max: 148884 Points
3DM Vant. Perf. GPU no PhysX + NVIDIA Titan RTX
min: 10307     avg: 98904     median: 107177 (58%)     max: 128166 Points
3DMark 03 - 3DMark 03 - Standard
141003 Points (74%)
3DMark 05 - 3DMark 05 - Standard
43011 Points (47%)
min: 40210     avg: 61225     median: 61224.5 (67%)     max: 82239 Points
min: 35314     avg: 62178     median: 60144 (66%)     max: 91296 Points
3DMark 06 3DMark 06 - Standard 1280x1024 + NVIDIA GeForce RTX 2080 Super (Desktop)
3DMark 06
min: 34358     avg: 38035     median: 38034.5 (50%)     max: 41711 Points
3DMark 06 - Standard 1280x1024 + AMD Radeon RX 7900 GRE
min: 51356     avg: 59003     median: 59002.5 (77%)     max: 66649 Points
3DMark 06 - Standard 1280x1024 + NVIDIA Titan RTX
min: 7882     avg: 49384     median: 51380 (67%)     max: 69803 Points
3DMark 06 - Standard 1366x768 + NVIDIA Titan RTX
3DMark 06
46874 Points (61%)
Unigine Valley 1.0 - Unigine Valley 1.0 DX
120.2 fps (36%)
min: 195.7     avg: 206.4     median: 206.4 (63%)     max: 217 fps
min: 135     avg: 173.3     median: 179 (54%)     max: 191.4 fps
Blender - Blender 3.3 Classroom CUDA *
47 Seconds (7%)
31 Seconds (5%)
Blender - Blender 3.3 Classroom OPTIX *
30 Seconds (11%)
21 Seconds (8%)
Blender - Blender 3.3 Classroom HIP *
29 Seconds (2%)
SPECviewperf 12
specvp12 sw-03 + NVIDIA GeForce RTX 2080 Super (Desktop)
SPECviewperf 12 - specvp12 sw-03
min: 70.8     avg: 71.1     median: 71.1 (18%)     max: 71.3 fps
specvp12 sw-03 + AMD Radeon RX 7900 GRE
min: 278     avg: 298.5     median: 298.5 (74%)     max: 319 fps
specvp12 sw-03 + NVIDIA Titan RTX
min: 114.8     avg: 164.8     median: 165 (41%)     max: 207 fps
specvp12 snx-02 + NVIDIA GeForce RTX 2080 Super (Desktop)
SPECviewperf 12 - specvp12 snx-02
min: 12.26     avg: 12.8     median: 12.8 (2%)     max: 13.39 fps
specvp12 snx-02 + AMD Radeon RX 7900 GRE
min: 335     avg: 338     median: 338 (50%)     max: 341 fps
specvp12 snx-02 + NVIDIA Titan RTX
min: 227.5     avg: 263.9     median: 263.3 (39%)     max: 306 fps
specvp12 showcase-01 + NVIDIA GeForce RTX 2080 Super (Desktop)
SPECviewperf 12 - specvp12 showcase-01
min: 139     avg: 141.3     median: 141.3 (25%)     max: 143.6 fps
specvp12 showcase-01 + AMD Radeon RX 7900 GRE
min: 220     avg: 221     median: 221 (39%)     max: 222 fps
specvp12 showcase-01 + NVIDIA Titan RTX
min: 185.7     avg: 193.8     median: 193.3 (34%)     max: 203 fps
specvp12 mediacal-01 + NVIDIA GeForce RTX 2080 Super (Desktop)
SPECviewperf 12 - specvp12 mediacal-01
min: 38.93     avg: 42     median: 42 (11%)     max: 45 fps
specvp12 mediacal-01 + AMD Radeon RX 7900 GRE
min: 213     avg: 219.5     median: 219.5 (56%)     max: 226 fps
specvp12 mediacal-01 + NVIDIA Titan RTX
min: 83.9     avg: 94.6     median: 90.7 (23%)     max: 127 fps
specvp12 maya-04 + NVIDIA GeForce RTX 2080 Super (Desktop)
SPECviewperf 12 - specvp12 maya-04
min: 130     avg: 132.4     median: 132.4 (36%)     max: 134.8 fps
specvp12 maya-04 + AMD Radeon RX 7900 GRE
min: 273     avg: 298     median: 298 (81%)     max: 323 fps
specvp12 maya-04 + NVIDIA Titan RTX
min: 110.9     avg: 184     median: 186 (51%)     max: 260 fps
specvp12 energy-01 + NVIDIA GeForce RTX 2080 Super (Desktop)
SPECviewperf 12 - specvp12 energy-01
min: 12.11     avg: 12.6     median: 12.6 (11%)     max: 13.09 fps
specvp12 energy-01 + AMD Radeon RX 7900 GRE
min: 39.3     avg: 39.8     median: 39.8 (36%)     max: 40.3 fps
specvp12 energy-01 + NVIDIA Titan RTX
min: 27.75     avg: 28.7     median: 28.5 (25%)     max: 31.1 fps
specvp12 creo-01 + NVIDIA GeForce RTX 2080 Super (Desktop)
SPECviewperf 12 - specvp12 creo-01
min: 52.7     avg: 52.9     median: 52.9 (21%)     max: 53 fps
specvp12 creo-01 + AMD Radeon RX 7900 GRE
min: 134     avg: 144.5     median: 144.5 (58%)     max: 155 fps
specvp12 creo-01 + NVIDIA Titan RTX
min: 106.3     avg: 153.8     median: 154.5 (62%)     max: 202 fps
specvp12 catia-04 + NVIDIA GeForce RTX 2080 Super (Desktop)
SPECviewperf 12 - specvp12 catia-04
min: 104.2     avg: 106.6     median: 106.6 (18%)     max: 109 fps
specvp12 catia-04 + AMD Radeon RX 7900 GRE
min: 401     avg: 424.5     median: 424.5 (70%)     max: 448 fps
specvp12 catia-04 + NVIDIA Titan RTX
min: 146.7     avg: 238.9     median: 225.2 (37%)     max: 354 fps
specvp12 3dsmax-05 + NVIDIA GeForce RTX 2080 Super (Desktop)
SPECviewperf 12 - specvp12 3dsmax-05
min: 217     avg: 221.4     median: 221.4 (33%)     max: 225.8 fps
specvp12 3dsmax-05 + AMD Radeon RX 7900 GRE
min: 414     avg: 429     median: 429 (65%)     max: 444 fps
specvp12 3dsmax-05 + NVIDIA Titan RTX
min: 243.4     avg: 283.6     median: 288.4 (43%)     max: 315 fps
SPECviewperf 13 specvp13 sw-04 + NVIDIA GeForce RTX 2080 Super (Desktop)
SPECviewperf 13 - specvp13 sw-04
min: 96.9     avg: 98.3     median: 98.3 (26%)     max: 99.6 fps
specvp13 sw-04 + AMD Radeon RX 7900 GRE
min: 248     avg: 267.5     median: 267.5 (72%)     max: 287 fps
specvp13 sw-04 + NVIDIA Titan RTX
min: 112.8     avg: 169.6     median: 166.2 (45%)     max: 229 fps
specvp13 snx-03 + NVIDIA GeForce RTX 2080 Super (Desktop)
SPECviewperf 13 - specvp13 snx-03
min: 21.94     avg: 23     median: 23 (3%)     max: 24.11 fps
specvp13 snx-03 + AMD Radeon RX 7900 GRE
min: 600     avg: 609     median: 608.5 (68%)     max: 617 fps
specvp13 snx-03 + NVIDIA Titan RTX
min: 411.2     avg: 476.5     median: 472.9 (52%)     max: 552 fps
specvp13 showcase-02 + NVIDIA GeForce RTX 2080 Super (Desktop)
SPECviewperf 13 - specvp13 showcase-02
min: 138     avg: 141.3     median: 141.3 (24%)     max: 144.5 fps
specvp13 showcase-02 + AMD Radeon RX 7900 GRE
min: 218     avg: 219.5     median: 219.5 (37%)     max: 221 fps
specvp13 showcase-02 + NVIDIA Titan RTX
min: 184.3     avg: 192.8     median: 193.2 (33%)     max: 199 fps
specvp13 medical-02 + NVIDIA GeForce RTX 2080 Super (Desktop)
SPECviewperf 13 - specvp13 medical-02
min: 71.3     avg: 71.5     median: 71.5 (12%)     max: 71.6 fps
specvp13 medical-02 + AMD Radeon RX 7900 GRE
min: 349     avg: 360.5     median: 360.5 (61%)     max: 372 fps
specvp13 medical-02 + NVIDIA Titan RTX
min: 84     avg: 90.1     median: 90 (15%)     max: 93.7 fps
specvp13 maya-05 + NVIDIA GeForce RTX 2080 Super (Desktop)
SPECviewperf 13 - specvp13 maya-05
min: 296     avg: 312.4     median: 312.4 (35%)     max: 328.7 fps
specvp13 maya-05 + AMD Radeon RX 7900 GRE
min: 535     avg: 558     median: 557.5 (63%)     max: 580 fps
specvp13 maya-05 + NVIDIA Titan RTX
min: 291.6     avg: 425.4     median: 411.9 (47%)     max: 530 fps
specvp13 energy-02 + NVIDIA GeForce RTX 2080 Super (Desktop)
SPECviewperf 13 - specvp13 energy-02
min: 23.78     avg: 24.8     median: 24.8 (8%)     max: 25.89 fps
specvp13 energy-02 + AMD Radeon RX 7900 GRE
min: 147     avg: 148.5     median: 148.5 (48%)     max: 150 fps
specvp13 energy-02 + NVIDIA Titan RTX
min: 51.8     avg: 52.7     median: 52.4 (17%)     max: 53.9 fps
specvp13 creo-02 + NVIDIA GeForce RTX 2080 Super (Desktop)
SPECviewperf 13 - specvp13 creo-02
min: 220.1     avg: 227.1     median: 227.1 (33%)     max: 234 fps
specvp13 creo-02 + AMD Radeon RX 7900 GRE
min: 448     avg: 459     median: 459 (67%)     max: 470 fps
specvp13 creo-02 + NVIDIA Titan RTX
min: 266.2     avg: 344     median: 339.2 (50%)     max: 405 fps
specvp13 catia-05 + NVIDIA GeForce RTX 2080 Super (Desktop)
SPECviewperf 13 - specvp13 catia-05
min: 157.7     avg: 162.9     median: 162.9 (18%)     max: 168 fps
specvp13 catia-05 + AMD Radeon RX 7900 GRE
min: 590     avg: 626     median: 625.5 (70%)     max: 661 fps
specvp13 catia-05 + NVIDIA Titan RTX
min: 221.9     avg: 373.5     median: 366.8 (41%)     max: 546 fps
specvp13 3dsmax-06 + NVIDIA GeForce RTX 2080 Super (Desktop)
SPECviewperf 13 - specvp13 3dsmax-06
min: 213     avg: 220.4     median: 220.4 (34%)     max: 227.8 fps
specvp13 3dsmax-06 + AMD Radeon RX 7900 GRE
min: 412     avg: 425.5     median: 425.5 (67%)     max: 439 fps
specvp13 3dsmax-06 + NVIDIA Titan RTX
min: 243.1     avg: 283.2     median: 288 (45%)     max: 321 fps
SPECviewperf 2020 specvp2020 solidworks-05 4k + NVIDIA GeForce RTX 2080 Super (Desktop)
SPECviewperf 2020 - specvp2020 solidworks-05 4k
118 fps (28%)
specvp2020 solidworks-05 4k + AMD Radeon RX 7900 GRE
193 fps (46%)
specvp2020 solidworks-05 4k + NVIDIA Titan RTX
min: 153     avg: 171.2     median: 157.5 (38%)     max: 336 fps
specvp2020 snx-04 4k + NVIDIA GeForce RTX 2080 Super (Desktop)
SPECviewperf 2020 - specvp2020 snx-04 4k
19.9 fps (2%)
specvp2020 snx-04 4k + AMD Radeon RX 7900 GRE
min: 395     avg: 398.5     median: 398.5 (41%)     max: 402 fps
specvp2020 snx-04 4k + NVIDIA Titan RTX
min: 337     avg: 372.4     median: 371 (38%)     max: 454 fps
specvp2020 medical-03 4k + NVIDIA GeForce RTX 2080 Super (Desktop)
SPECviewperf 2020 - specvp2020 medical-03 4k
11.8 fps (8%)
specvp2020 medical-03 4k + AMD Radeon RX 7900 GRE
min: 71.1     avg: 73.6     median: 73.6 (47%)     max: 76.1 fps
specvp2020 medical-03 4k + NVIDIA Titan RTX
min: 16.33     avg: 18.6     median: 16.7 (11%)     max: 41.1 fps
specvp2020 maya-06 4k + NVIDIA GeForce RTX 2080 Super (Desktop)
SPECviewperf 2020 - specvp2020 maya-06 4k
197 fps (28%)
specvp2020 maya-06 4k + AMD Radeon RX 7900 GRE
min: 339     avg: 342.5     median: 342.5 (49%)     max: 346 fps
specvp2020 maya-06 4k + NVIDIA Titan RTX
min: 247     avg: 277.6     median: 264.3 (38%)     max: 445 fps
specvp2020 energy-03 4k + NVIDIA GeForce RTX 2080 Super (Desktop)
SPECviewperf 2020 - specvp2020 energy-03 4k
30.5 fps (7%)
specvp2020 energy-03 4k + AMD Radeon RX 7900 GRE
min: 86.4     avg: 109.7     median: 109.7 (24%)     max: 133 fps
specvp2020 energy-03 4k + NVIDIA Titan RTX
min: 37.7     avg: 50.1     median: 39.4 (9%)     max: 93.9 fps
specvp2020 creo-03 4k + NVIDIA GeForce RTX 2080 Super (Desktop)
SPECviewperf 2020 - specvp2020 creo-03 4k
73.6 fps (33%)
specvp2020 creo-03 4k + AMD Radeon RX 7900 GRE
min: 147     avg: 153     median: 153 (69%)     max: 159 fps
specvp2020 creo-03 4k + NVIDIA Titan RTX
min: 109     avg: 127.5     median: 126 (57%)     max: 163 fps
specvp2020 catia-06 4k + NVIDIA GeForce RTX 2080 Super (Desktop)
SPECviewperf 2020 - specvp2020 catia-06 4k
37.7 fps (25%)
specvp2020 catia-06 4k + AMD Radeon RX 7900 GRE
min: 102     avg: 104.5     median: 104.5 (68%)     max: 107 fps
specvp2020 catia-06 4k + NVIDIA Titan RTX
min: 73.8     avg: 83.8     median: 79.3 (52%)     max: 122 fps
specvp2020 3dsmax-07 4k + NVIDIA GeForce RTX 2080 Super (Desktop)
SPECviewperf 2020 - specvp2020 3dsmax-07 4k
69.5 fps (23%)
specvp2020 3dsmax-07 4k + AMD Radeon RX 7900 GRE
min: 129     avg: 131.5     median: 131.5 (44%)     max: 134 fps
specvp2020 3dsmax-07 4k + NVIDIA Titan RTX
min: 108     avg: 119.4     median: 116 (39%)     max: 169 fps
Cinebench R10 Cinebench R10 Shading (32bit) + AMD Radeon RX 7900 GRE
Cinebench R10 - Cinebench R10 Shading (32bit)
min: 20581     avg: 23019     median: 23018.5 (16%)     max: 25456 Points
Cinebench R10 Shading (32bit) + NVIDIA Titan RTX
min: 6709     avg: 7901     median: 6831 (5%)     max: 19419 Points
Cinebench R11.5 Cinebench R11.5 OpenGL 64 Bit + NVIDIA Titan RTX
Cinebench R11.5 - Cinebench R11.5 OpenGL 64 Bit
min: 104     avg: 181.2     median: 174.2 (57%)     max: 274.3 fps
Cinebench R15
Cinebench R15 OpenGL 64 Bit + NVIDIA GeForce RTX 2080 Super (Desktop)
Cinebench R15 - Cinebench R15 OpenGL 64 Bit
198.6 fps (12%)
Cinebench R15 OpenGL 64 Bit + AMD Radeon RX 7900 GRE
min: 292.02     avg: 356.9     median: 356.9 (21%)     max: 421.87 fps
Cinebench R15 OpenGL 64 Bit + NVIDIA Titan RTX
min: 99.9     avg: 205.4     median: 173.6 (10%)     max: 371.3 fps
Cinebench R15 OpenGL Ref. Match 64 Bit + NVIDIA GeForce RTX 2080 Super (Desktop)
Cinebench R15 - Cinebench R15 OpenGL Ref. Match 64 Bit
99.6 % (100%)
Cinebench R15 OpenGL Ref. Match 64 Bit + AMD Radeon RX 7900 GRE
97.9 % (98%)
Cinebench R15 OpenGL Ref. Match 64 Bit + NVIDIA Titan RTX
min: 99.6     avg: 99.6     median: 99.6 (100%)     max: 99.8 %
Basemark GPU 1.2 - Basemark GPU 1.2 Vulkan Official Medium Offscreen 1080
min: 104.6     avg: 976     median: 975.8 (24%)     max: 1847 fps
Basemark GPU 1.2 - Basemark GPU 1.2 Vulkan Official High Offscreen 2160
min: 3.64     avg: 89     median: 89 (16%)     max: 174.3 fps
Geekbench 6.5 - Geekbench 6.5 GPU OpenCL
min: 150110     avg: 155982     median: 155982 (40%)     max: 161854 Points
148703 Points (38%)
Geekbench 6.5 - Geekbench 6.5 GPU Vulkan
min: 152526     avg: 155936     median: 155936 (39%)     max: 159345 Points
146551 Points (36%)
LuxMark v2.0 64Bit - LuxMark v2.0 Room GPU
3430 Samples/s (12%)
min: 3784     avg: 3880     median: 3880 (14%)     max: 3976 Samples/s
min: 4643     avg: 4673     median: 4673 (17%)     max: 4703 Samples/s
LuxMark v2.0 64Bit - LuxMark v2.0 Sala GPU
7878 Samples/s (14%)
min: 10837     avg: 11051     median: 11051 (19%)     max: 11265 Samples/s
min: 10799     avg: 10898     median: 10897.5 (19%)     max: 10996 Samples/s
ComputeMark v2.1 - ComputeMark v2.1 Result
21009 Points (17%)
min: 46784     avg: 47021     median: 47020.5 (39%)     max: 47257 Points
min: 27907     avg: 28802     median: 28670 (24%)     max: 29830 Points
Power Consumption - Furmark Stress Test Power Consumption - external Monitor *
min: 328     avg: 362.4     median: 353.9 (48%)     max: 413.6 Watt
min: 356     avg: 387     median: 387 (52%)     max: 418 Watt
419 Watt (56%)
Power Consumption - The Witcher 3 Power Consumption - external Monitor *
min: 336     avg: 362.8     median: 343 (48%)     max: 416.1 Watt
min: 385     avg: 412.5     median: 412.5 (58%)     max: 440 Watt
min: 370.5     avg: 408.1     median: 403 (56%)     max: 463 Watt
Power Consumption - Power Efficiency - Witcher 3 ultra external Monitor
0.3 fps per Watt (24%)
min: 0.4777     avg: 0.5     median: 0.5 (42%)     max: 0.538 fps per Watt
min: 0.2926     avg: 0.3     median: 0.3 (28%)     max: 0.385 fps per Watt
Power Consumption - Cyberpunk 2077 Power Consumption - external Monitor *
537 Watt (68%)
Clock Speed - GPU Clock Witcher 3 ultra
min: 1883     avg: 1902     median: 1901.5 (75%)     max: 1920 MHz
Clock Speed - GPU Clock Speed Furmark
1741 MHz (69%)

Average Benchmarks NVIDIA GeForce RTX 2080 Super (Desktop) → 100% n=47

Average Benchmarks AMD Radeon RX 7900 GRE → 376% n=47

Average Benchmarks NVIDIA Titan RTX → 268% n=47

- Bereich der Benchmarkergebnisse für diese Grafikkarte
red legend - Durchschnittliche Benchmarkergebnisse für diese Grafikkarte
* Smaller numbers mean a higher performance
1 This benchmark is not used for the average calculation

Spiele-Benchmarks

Die folgenden Benchmarks basieren auf unseren Spieletests mit Testnotebooks. Die Performance dieser Grafikkarte bei den gelisteten Spielen ist abhängig von der verwendeten CPU, Speicherausstattung, Treiber und auch Betriebssystem. Dadurch müssen die untenstehenden Werte nicht repräsentativ sein. Detaillierte Informationen über das verwendete System sehen Sie nach einem Klick auf den fps-Wert.

F1 25

F1 25

2025
low 1920x1080
100%
GeForce RTX 2080 Super (Desktop):
206  fps
med. 1920x1080
100%
GeForce RTX 2080 Super (Desktop):
196  fps
high 1920x1080
100%
GeForce RTX 2080 Super (Desktop):
162.8  fps
med. 1920x1080
100%
GeForce RTX 2080 Super (Desktop):
53.9  fps
ultra 1920x1080
100%
GeForce RTX 2080 Super (Desktop):
40.8  fps
QHD 2560x1440
100%
GeForce RTX 2080 Super (Desktop):
31.2  fps
QHD DLSS 2560x1440
100%
GeForce RTX 2080 Super (Desktop):
39  fps
low 1920x1080
Titan RTX:
99  fps
med. 1920x1080
100%
GeForce RTX 2080 Super (Desktop):
62  fps
121%
Titan RTX:
75  fps
high 1920x1080
100%
GeForce RTX 2080 Super (Desktop):
47  fps
123%
Titan RTX:
58  fps
ultra 1920x1080
100%
GeForce RTX 2080 Super (Desktop):
26  fps
123%
Titan RTX:
32  fps
QHD 2560x1440
100%
GeForce RTX 2080 Super (Desktop):
20  fps
125%
Titan RTX:
25  fps
4K 3840x2160
Titan RTX:
15  fps
4K DLSS 3840x2160
Titan RTX:
25  fps
QHD DLSS 2560x1440
100%
GeForce RTX 2080 Super (Desktop):
28  fps
125%
Titan RTX:
35  fps
low 1920x1080
Titan RTX:
240  fps
med. 1920x1080
Titan RTX:
178.4  fps
high 1920x1080
Titan RTX:
152.7  fps
ultra 1920x1080
Titan RTX:
137.1  fps
QHD 2560x1440
Titan RTX:
93.2  fps
4K 3840x2160
Titan RTX:
49  fps
low 1920x1080
Titan RTX:
211  fps
med. 1920x1080
Titan RTX:
128.9  fps
high 1920x1080
Titan RTX:
106.5  fps
ultra 1920x1080
Titan RTX:
89.4  fps
QHD 2560x1440
Titan RTX:
60.8  fps
4K 3840x2160
Titan RTX:
34.2  fps
4K DLSS 3840x2160
Titan RTX:
33.9  fps
F1 24

F1 24

2024
low 1920x1080
Titan RTX:
385  fps
med. 1920x1080
Titan RTX:
325  fps
high 1920x1080
Titan RTX:
244  fps
ultra 1920x1080
Titan RTX:
80.8  fps
QHD 2560x1440
Titan RTX:
53.6  fps
4K 3840x2160
Titan RTX:
26.6  fps
4K DLSS 3840x2160
Titan RTX:
47.1  fps
QHD DLSS 2560x1440
Titan RTX:
84.1  fps
low 1920x1080
Titan RTX:
77.3  fps
med. 1920x1080
Titan RTX:
65.3  fps
high 1920x1080
Titan RTX:
49.7  fps
QHD 2560x1440
Titan RTX:
34.9  fps
4K 3840x2160
Titan RTX:
19.9  fps
4K DLSS 3840x2160
Titan RTX:
34.1  fps
QHD DLSS 2560x1440
Titan RTX:
52.7  fps
low 1920x1080
Titan RTX:
130.4  fps
med. 1920x1080
Titan RTX:
107.9  fps
high 1920x1080
Titan RTX:
99.6  fps
ultra 1920x1080
Titan RTX:
80  fps
QHD 2560x1440
Titan RTX:
62.3  fps
4K 3840x2160
Titan RTX:
39.4  fps
4K DLSS 3840x2160
Titan RTX:
58.2  fps
QHD DLSS 2560x1440
Titan RTX:
83.4  fps
low 1920x1080
Titan RTX:
145.3  fps
med. 1920x1080
Titan RTX:
131.4  fps
high 1920x1080
Titan RTX:
91.3  fps
ultra 1920x1080
Titan RTX:
90.4  fps
QHD 2560x1440
Titan RTX:
68.8  fps
4K 3840x2160
Titan RTX:
41.9  fps
4K DLSS 3840x2160
Titan RTX:
56.4  fps
4K FSR 3840x2160
Titan RTX:
54.4  fps
low 1920x1080
Titan RTX:
313  fps
med. 1920x1080
Titan RTX:
272  fps
high 1920x1080
Titan RTX:
233  fps
ultra 1920x1080
Titan RTX:
137.9  fps
QHD 2560x1440
Titan RTX:
84.2  fps
4K 3840x2160
Titan RTX:
22.3  fps
4K DLSS 3840x2160
Titan RTX:
66.6  fps
4K FSR 3840x2160
Titan RTX:
79.1  fps
low 1920x1080
Titan RTX:
89.2  fps
high 1920x1080
Titan RTX:
72.3  fps
QHD 2560x1440
Titan RTX:
59.3  fps
4K 3840x2160
Titan RTX:
41.3  fps
4K DLSS 3840x2160
Titan RTX:
45.8  fps
4K FSR 3840x2160
Titan RTX:
44.6  fps
low 1920x1080
Titan RTX:
293  fps
med. 1920x1080
Titan RTX:
294  fps
high 1920x1080
Titan RTX:
267  fps
ultra 1920x1080
Titan RTX:
222  fps
QHD 2560x1440
Titan RTX:
147.8  fps
4K 3840x2160
Titan RTX:
74.3  fps
low 1920x1080
Titan RTX:
141  fps
med. 1920x1080
Titan RTX:
132  fps
high 1920x1080
Titan RTX:
109  fps
ultra 1920x1080
Titan RTX:
84  fps
QHD 2560x1440
Titan RTX:
68  fps
4K 3840x2160
Titan RTX:
42  fps
4K DLSS 3840x2160
Titan RTX:
61  fps
4K FSR 3840x2160
Titan RTX:
59  fps
low 1920x1080
Titan RTX:
188.3  fps
med. 1920x1080
Titan RTX:
143.6  fps
high 1920x1080
Titan RTX:
127.9  fps
ultra 1920x1080
Titan RTX:
125.3  fps
QHD 2560x1440
Titan RTX:
90.9  fps
4K 3840x2160
Titan RTX:
51.3  fps
low 1920x1080
Titan RTX:
105.7  fps
med. 1920x1080
Titan RTX:
92.9  fps
high 1920x1080
Titan RTX:
79.8  fps
ultra 1920x1080
Titan RTX:
67.4  fps
QHD 2560x1440
Titan RTX:
53.2  fps
4K 3840x2160
Titan RTX:
33  fps
4K DLSS 3840x2160
Titan RTX:
47.2  fps
4K FSR 3840x2160
Titan RTX:
40  fps
Palworld

Palworld

2024
low 1920x1080
Titan RTX:
146.6  fps
med. 1920x1080
Titan RTX:
123.8  fps
high 1920x1080
Titan RTX:
98.7  fps
ultra 1920x1080
Titan RTX:
91.4  fps
QHD 2560x1440
Titan RTX:
65.8  fps
4K 3840x2160
Titan RTX:
36.3  fps
4K DLSS 3840x2160
Titan RTX:
70.9  fps
med. 1920x1080
Titan RTX:
359  fps
high 1920x1080
Titan RTX:
359  fps
ultra 1920x1080
Titan RTX:
359  fps
QHD 2560x1440
Titan RTX:
359  fps
4K 3840x2160
Titan RTX:
277  fps
low 1920x1080
Titan RTX:
289  fps
med. 1920x1080
Titan RTX:
283  fps
high 1920x1080
Titan RTX:
256  fps
ultra 1920x1080
Titan RTX:
183.8  fps
QHD 2560x1440
Titan RTX:
109.2  fps
4K 3840x2160
Titan RTX:
46.4  fps
4K DLSS 3840x2160
Titan RTX:
101.7  fps
low 1920x1080
Titan RTX:
324  fps
med. 1920x1080
Titan RTX:
250  fps
high 1920x1080
Titan RTX:
225  fps
ultra 1920x1080
Titan RTX:
171.5  fps
QHD 2560x1440
Titan RTX:
111.6  fps
4K 3840x2160
Titan RTX:
55.1  fps
low 1920x1080
Titan RTX:
97  fps
med. 1920x1080
Titan RTX:
91  fps
high 1920x1080
Titan RTX:
80  fps
ultra 1920x1080
Titan RTX:
64  fps
QHD 2560x1440
Titan RTX:
44  fps
4K 3840x2160
Titan RTX:
23  fps
4K DLSS 3840x2160
Titan RTX:
39  fps
low 1920x1080
Titan RTX:
153  fps
med. 1920x1080
Titan RTX:
139  fps
high 1920x1080
Titan RTX:
110  fps
ultra 1920x1080
Titan RTX:
103  fps
QHD 2560x1440
Titan RTX:
74  fps
4K 3840x2160
Titan RTX:
45  fps
low 1920x1080
Titan RTX:
175.3  fps
med. 1920x1080
Titan RTX:
133.1  fps
high 1920x1080
Titan RTX:
122.3  fps
ultra 1920x1080
Titan RTX:
111.5  fps
QHD 2560x1440
Titan RTX:
83.3  fps
4K 3840x2160
Titan RTX:
49.5  fps
4K DLSS 3840x2160
Titan RTX:
70.6  fps
low 1920x1080
Titan RTX:
91.7  fps
med. 1920x1080
Titan RTX:
82.5  fps
high 1920x1080
Titan RTX:
78  fps
QHD 2560x1440
Titan RTX:
54.1  fps
4K 3840x2160
Titan RTX:
28.3  fps
low 1920x1080
Titan RTX:
110.7  fps
med. 1920x1080
Titan RTX:
98.7  fps
high 1920x1080
Titan RTX:
71.8  fps
ultra 1920x1080
Titan RTX:
51.1  fps
QHD 2560x1440
Titan RTX:
35.3  fps
4K 3840x2160
Titan RTX:
18.9  fps
4K DLSS 3840x2160
Titan RTX:
35.5  fps
low 1920x1080
Titan RTX:
493  fps
med. 1920x1080
Titan RTX:
319.6  fps
high 1920x1080
Titan RTX:
200.9  fps
ultra 1920x1080
Titan RTX:
159.9  fps
QHD 2560x1440
Titan RTX:
116  fps
4K 3840x2160
Titan RTX:
60.8  fps
low 1920x1080
Titan RTX:
134  fps
med. 1920x1080
Titan RTX:
125  fps
high 1920x1080
Titan RTX:
119  fps
ultra 1920x1080
Titan RTX:
98  fps
QHD 2560x1440
Titan RTX:
79  fps
4K 3840x2160
Titan RTX:
51  fps
4K DLSS 3840x2160
Titan RTX:
70  fps
low 1920x1080
Titan RTX:
338  fps
med. 1920x1080
Titan RTX:
292  fps
high 1920x1080
Titan RTX:
247  fps
ultra 1920x1080
Titan RTX:
228  fps
QHD 2560x1440
Titan RTX:
178.7  fps
4K 3840x2160
Titan RTX:
109.5  fps
low 1920x1080
Titan RTX:
353  fps
med. 1920x1080
Titan RTX:
342  fps
high 1920x1080
Titan RTX:
289  fps
ultra 1920x1080
Titan RTX:
251  fps
QHD 2560x1440
Titan RTX:
157.1  fps
4K 3840x2160
Titan RTX:
89.6  fps
low 1920x1080
100%
GeForce RTX 2080 Super (Desktop):
135.1  fps
123%
Titan RTX:
164.6 166.6 ~ 166 fps
med. 1920x1080
100%
GeForce RTX 2080 Super (Desktop):
111.3  fps
138%
Titan RTX:
135.2 140.8 185.8 ~ 154 fps
high 1920x1080
100%
GeForce RTX 2080 Super (Desktop):
96.9  fps
124%
Titan RTX:
118.9 122 ~ 120 fps
ultra 1920x1080
100%
GeForce RTX 2080 Super (Desktop):
86  fps
128%
Titan RTX:
109.2 111.4 ~ 110 fps
QHD 2560x1440
100%
GeForce RTX 2080 Super (Desktop):
55  fps
135%
Titan RTX:
73.2 74.5 ~ 74 fps
4K 3840x2160
100%
GeForce RTX 2080 Super (Desktop):
24.3  fps
152%
Titan RTX:
36.1 37.1 ~ 37 fps
low 1920x1080
Radeon RX 7900 GRE:
197 235 ~ 216 fps
Titan RTX:
175.8  fps
med. 1920x1080
Radeon RX 7900 GRE:
177.2 204 ~ 191 fps
Titan RTX:
144.7  fps
high 1920x1080
Radeon RX 7900 GRE:
158 175.3 ~ 167 fps
Titan RTX:
121.8  fps
ultra 1920x1080
100%
GeForce RTX 2080 Super (Desktop):
102.3  fps
161%
Radeon RX 7900 GRE:
159.8 170.3 ~ 165 fps
119%
Titan RTX:
122.2  fps
QHD 2560x1440
100%
GeForce RTX 2080 Super (Desktop):
69.5  fps
177%
Radeon RX 7900 GRE:
120.6 124.5 ~ 123 fps
121%
Titan RTX:
83.9  fps
4K 3840x2160
100%
GeForce RTX 2080 Super (Desktop):
36.2  fps
185%
Radeon RX 7900 GRE:
65.8 67.6 ~ 67 fps
123%
Titan RTX:
44.7  fps
Lies of P

Lies of P

2023
low 1920x1080
Titan RTX:
248  fps
med. 1920x1080
Titan RTX:
221  fps
high 1920x1080
Titan RTX:
193.6  fps
ultra 1920x1080
Titan RTX:
177.1  fps
QHD 2560x1440
Titan RTX:
119  fps
4K 3840x2160
Titan RTX:
61.2  fps
4K DLSS 3840x2160
Titan RTX:
96.3  fps
Starfield

Starfield

2023
low 1920x1080
Titan RTX:
70.6  fps
med. 1920x1080
Titan RTX:
61.5  fps
high 1920x1080
Titan RTX:
54  fps
ultra 1920x1080
Titan RTX:
50.7  fps
QHD 2560x1440
Titan RTX:
41  fps
4K 3840x2160
Titan RTX:
28.2  fps
low 1920x1080
Titan RTX:
119.7  fps
med. 1920x1080
Titan RTX:
119.6  fps
high 1920x1080
Titan RTX:
119.5  fps
ultra 1920x1080
Titan RTX:
119.1  fps
QHD 2560x1440
Titan RTX:
100.7  fps
4K 3840x2160
Titan RTX:
60.5  fps
low 1920x1080
Titan RTX:
76.5  fps
high 1920x1080
Titan RTX:
66.1  fps
ultra 1920x1080
Titan RTX:
53.3  fps
QHD 2560x1440
Titan RTX:
37.8  fps
4K 3840x2160
Titan RTX:
20.9  fps
low 1920x1080
Radeon RX 7900 GRE:
192.4 193 ~ 193 fps
Titan RTX:
190.8  fps
med. 1920x1080
Radeon RX 7900 GRE:
189.5 191.1 ~ 190 fps
Titan RTX:
184.9  fps
high 1920x1080
Radeon RX 7900 GRE:
182.9 184.8 ~ 184 fps
Titan RTX:
175.8  fps
ultra 1920x1080
Radeon RX 7900 GRE:
178.4 185.2 ~ 182 fps
Titan RTX:
157.1  fps
QHD 2560x1440
Radeon RX 7900 GRE:
140.6 142.3 ~ 141 fps
Titan RTX:
108.3  fps
4K 3840x2160
Radeon RX 7900 GRE:
76.6 78.4 ~ 78 fps
Titan RTX:
59.6  fps
low 1920x1080
Radeon RX 7900 GRE:
146.8 175.3 ~ 161 fps
Titan RTX:
152.2  fps
med. 1920x1080
Radeon RX 7900 GRE:
134.9 151.9 ~ 143 fps
Titan RTX:
131.9  fps
high 1920x1080
Radeon RX 7900 GRE:
114.9 127.6 ~ 121 fps
Titan RTX:
106.4  fps
ultra 1920x1080
Radeon RX 7900 GRE:
100 112.3 ~ 106 fps
Titan RTX:
93.2  fps
QHD 2560x1440
Radeon RX 7900 GRE:
84.5 91.5 ~ 88 fps
Titan RTX:
75.3  fps
4K 3840x2160
Radeon RX 7900 GRE:
57.6 60.2 ~ 59 fps
Titan RTX:
47.1  fps
F1 23

F1 23

2023
low 1920x1080
Radeon RX 7900 GRE:
384 523 ~ 454 fps
Titan RTX:
421  fps
med. 1920x1080
Radeon RX 7900 GRE:
399 487 ~ 443 fps
Titan RTX:
368  fps
high 1920x1080
Radeon RX 7900 GRE:
331 367 ~ 349 fps
Titan RTX:
264  fps
ultra 1920x1080
Radeon RX 7900 GRE:
93.3 97.6 ~ 95 fps
Titan RTX:
81.6  fps
QHD 2560x1440
Radeon RX 7900 GRE:
62.1 64.1 ~ 63 fps
Titan RTX:
52.9  fps
4K 3840x2160
Radeon RX 7900 GRE:
31.6 32.1 ~ 32 fps
Titan RTX:
26.3  fps
4K DLSS 3840x2160
Titan RTX:
46.6  fps
Diablo 4

Diablo 4

2023
low 1920x1080
Radeon RX 7900 GRE:
377 382 ~ 380 fps
Titan RTX:
368  fps
med. 1920x1080
Radeon RX 7900 GRE:
344 364 ~ 354 fps
Titan RTX:
320  fps
high 1920x1080
Radeon RX 7900 GRE:
312 330 ~ 321 fps
Titan RTX:
282  fps
ultra 1920x1080
Radeon RX 7900 GRE:
273 294 ~ 284 fps
Titan RTX:
238  fps
QHD 2560x1440
Radeon RX 7900 GRE:
199 205 ~ 202 fps
Titan RTX:
162  fps
4K 3840x2160
Radeon RX 7900 GRE:
97.3 99.4 ~ 98 fps
Titan RTX:
85.4  fps
low 1920x1080
Radeon RX 7900 GRE:
107.2 155.5 ~ 131 fps
Titan RTX:
124.1  fps
med. 1920x1080
Radeon RX 7900 GRE:
102.9 147.1 ~ 125 fps
Titan RTX:
108.8  fps
high 1920x1080
Radeon RX 7900 GRE:
97.8 136.1 ~ 117 fps
Titan RTX:
100.6  fps
ultra 1920x1080
Radeon RX 7900 GRE:
97.7 128.1 ~ 113 fps
Titan RTX:
95.3  fps
QHD 2560x1440
Radeon RX 7900 GRE:
83.5 85.5 ~ 85 fps
Titan RTX:
60  fps
4K 3840x2160
Radeon RX 7900 GRE:
39.9 42.4 ~ 41 fps
Titan RTX:
30.6  fps
low 1920x1080
Radeon RX 7900 GRE:
248 377 ~ 313 fps
Titan RTX:
314  fps
med. 1920x1080
Radeon RX 7900 GRE:
239 368 ~ 304 fps
Titan RTX:
299  fps
high 1920x1080
Radeon RX 7900 GRE:
206 298 ~ 252 fps
Titan RTX:
224  fps
ultra 1920x1080
Radeon RX 7900 GRE:
172.2 207 ~ 190 fps
Titan RTX:
164.5  fps
QHD 2560x1440
Radeon RX 7900 GRE:
151.5 155.1 ~ 153 fps
Titan RTX:
116.1  fps
4K 3840x2160
Radeon RX 7900 GRE:
84.9 88.6 ~ 87 fps
Titan RTX:
58.7  fps
low 1920x1080
Radeon RX 7900 GRE:
117.2 171.9 ~ 145 fps
Titan RTX:
126.3  fps
med. 1920x1080
Radeon RX 7900 GRE:
108 151.1 ~ 130 fps
Titan RTX:
108.4  fps
high 1920x1080
Radeon RX 7900 GRE:
106 143.3 ~ 125 fps
Titan RTX:
101  fps
ultra 1920x1080
Radeon RX 7900 GRE:
102.9 126.5 ~ 115 fps
Titan RTX:
83.5  fps
QHD 2560x1440
Radeon RX 7900 GRE:
84.7 88.9 ~ 87 fps
Titan RTX:
58.3  fps
4K 3840x2160
Radeon RX 7900 GRE:
43 44.8 ~ 44 fps
Titan RTX:
28.7  fps
4K DLSS 3840x2160
Titan RTX:
46.2  fps
low 1920x1080
Radeon RX 7900 GRE:
204 264 ~ 234 fps
Titan RTX:
202  fps
med. 1920x1080
Radeon RX 7900 GRE:
200 217 ~ 209 fps
Titan RTX:
139.9  fps
high 1920x1080
Radeon RX 7900 GRE:
180.7 190.8 ~ 186 fps
Titan RTX:
129.1  fps
ultra 1920x1080
Radeon RX 7900 GRE:
110.2 133.8 ~ 122 fps
Titan RTX:
97.5  fps
QHD 2560x1440
Radeon RX 7900 GRE:
100.6 109.2 ~ 105 fps
Titan RTX:
73.4  fps
4K 3840x2160
Radeon RX 7900 GRE:
62.4 64.8 ~ 64 fps
Titan RTX:
44.7  fps
low 1920x1080
Radeon RX 7900 GRE:
296.5 352.2 ~ 324 fps
Titan RTX:
248.7  fps
med. 1920x1080
Radeon RX 7900 GRE:
261.4 313.9 ~ 288 fps
Titan RTX:
212.1  fps
high 1920x1080
Radeon RX 7900 GRE:
220.5 260.7 ~ 241 fps
Titan RTX:
164.1  fps
ultra 1920x1080
100%
GeForce RTX 2080 Super (Desktop):
131  fps
179%
Radeon RX 7900 GRE:
220.4 248.7 ~ 235 fps
124%
Titan RTX:
162.8  fps
QHD 2560x1440
100%
GeForce RTX 2080 Super (Desktop):
101  fps
187%
Radeon RX 7900 GRE:
185.4 193.4 ~ 189 fps
121%
Titan RTX:
122.2  fps
4K 3840x2160
100%
GeForce RTX 2080 Super (Desktop):
59  fps
178%
Radeon RX 7900 GRE:
103.2 105.8 ~ 105 fps
122%
Titan RTX:
72.2  fps
low 1920x1080
Radeon RX 7900 GRE:
107.6 126.5 ~ 117 fps
Titan RTX:
130.8  fps
med. 1920x1080
Radeon RX 7900 GRE:
101.4 123.6 ~ 113 fps
Titan RTX:
118.4  fps
high 1920x1080
Radeon RX 7900 GRE:
98.4 121.8 ~ 110 fps
Titan RTX:
113  fps
ultra 1920x1080
Radeon RX 7900 GRE:
96.6 119.2 ~ 108 fps
Titan RTX:
112.2  fps
QHD 2560x1440
Radeon RX 7900 GRE:
94.9 117.8 ~ 106 fps
Titan RTX:
87.4  fps
4K 3840x2160
Radeon RX 7900 GRE:
75 78.2 ~ 77 fps
Titan RTX:
55.7  fps
low 1920x1080
Radeon RX 7900 GRE:
263 342 ~ 303 fps
Titan RTX:
264  fps
med. 1920x1080
Radeon RX 7900 GRE:
211 252 ~ 232 fps
Titan RTX:
197.6  fps
high 1920x1080
Radeon RX 7900 GRE:
147 152.2 ~ 150 fps
Titan RTX:
117.7  fps
ultra 1920x1080
Radeon RX 7900 GRE:
113.9 119 ~ 116 fps
Titan RTX:
96.9  fps
QHD 2560x1440
Radeon RX 7900 GRE:
93.5 96.3 ~ 95 fps
Titan RTX:
74.9  fps
4K 3840x2160
Radeon RX 7900 GRE:
57.4 58.8 ~ 58 fps
Titan RTX:
45  fps
Returnal

Returnal

2023
low 1920x1080
Radeon RX 7900 GRE:
184 208 ~ 196 fps
Titan RTX:
142  fps
med. 1920x1080
Radeon RX 7900 GRE:
177 200 ~ 189 fps
Titan RTX:
134  fps
high 1920x1080
Radeon RX 7900 GRE:
151 177 ~ 164 fps
Titan RTX:
122  fps
ultra 1920x1080
100%
GeForce RTX 2080 Super (Desktop):
78  fps
187%
Radeon RX 7900 GRE:
142 150 ~ 146 fps
137%
Titan RTX:
107  fps
QHD 2560x1440
100%
GeForce RTX 2080 Super (Desktop):
57  fps
198%
Radeon RX 7900 GRE:
111 115 ~ 113 fps
142%
Titan RTX:
81  fps
4K 3840x2160
100%
GeForce RTX 2080 Super (Desktop):
32  fps
206%
Radeon RX 7900 GRE:
64 67 ~ 66 fps
156%
Titan RTX:
50  fps
low 1920x1080
Radeon RX 7900 GRE:
144.6 214 ~ 179 fps
Titan RTX:
166.9  fps
med. 1920x1080
Radeon RX 7900 GRE:
125.1 188.3 ~ 157 fps
Titan RTX:
145.2  fps
high 1920x1080
Radeon RX 7900 GRE:
107.6 154.9 ~ 131 fps
Titan RTX:
116.7  fps
ultra 1920x1080
100%
GeForce RTX 2080 Super (Desktop):
58.6  fps
186%
Radeon RX 7900 GRE:
100.5 118.1 ~ 109 fps
161%
Titan RTX:
94.1  fps
QHD 2560x1440
100%
GeForce RTX 2080 Super (Desktop):
46.5  fps
185%
Radeon RX 7900 GRE:
79.9 91.2 ~ 86 fps
149%
Titan RTX:
69.1  fps
4K 3840x2160
100%
GeForce RTX 2080 Super (Desktop):
27.6  fps
178%
Radeon RX 7900 GRE:
47.8 50.9 ~ 49 fps
137%
Titan RTX:
37.7  fps
low 1920x1080
Radeon RX 7900 GRE:
137.2 170 ~ 154 fps
med. 1920x1080
Radeon RX 7900 GRE:
136.8 163.6 ~ 150 fps
Titan RTX:
126.8  fps
high 1920x1080
Radeon RX 7900 GRE:
125.4 142.4 ~ 134 fps
Titan RTX:
111.3 136.2 ~ 124 fps
ultra 1920x1080
Radeon RX 7900 GRE:
126.3 141.7 ~ 134 fps
Titan RTX:
111.3  fps
QHD 2560x1440
Radeon RX 7900 GRE:
94.8 98.6 ~ 97 fps
Titan RTX:
74.7  fps
4K 3840x2160
Radeon RX 7900 GRE:
48.8 49.8 ~ 49 fps
Titan RTX:
39.3  fps
low 1920x1080
Radeon RX 7900 GRE:
234.8 323.4 ~ 279 fps
Titan RTX:
298  fps
med. 1920x1080
Radeon RX 7900 GRE:
194.5 282 ~ 238 fps
Titan RTX:
245  fps
high 1920x1080
Radeon RX 7900 GRE:
170.1 257.4 ~ 214 fps
Titan RTX:
208  fps
ultra 1920x1080
Radeon RX 7900 GRE:
161.1 217.7 ~ 189 fps
Titan RTX:
175.3  fps
QHD 2560x1440
Radeon RX 7900 GRE:
144.5 155.6 ~ 150 fps
Titan RTX:
125.2  fps
4K 3840x2160
Radeon RX 7900 GRE:
72.3 75.5 ~ 74 fps
Titan RTX:
72.6  fps
low 1920x1080
Radeon RX 7900 GRE:
257 389 ~ 323 fps
Titan RTX:
339  fps
med. 1920x1080
Radeon RX 7900 GRE:
233 312 ~ 273 fps
Titan RTX:
235  fps
high 1920x1080
Radeon RX 7900 GRE:
198.7 230 ~ 214 fps
Titan RTX:
172.6  fps
ultra 1920x1080
Radeon RX 7900 GRE:
171.4 179.4 ~ 175 fps
Titan RTX:
136.6  fps
QHD 2560x1440
Radeon RX 7900 GRE:
108.8 112.2 ~ 111 fps
Titan RTX:
87.1  fps
4K 3840x2160
Radeon RX 7900 GRE:
49.2 50.5 ~ 50 fps
Titan RTX:
39.6  fps
low 1920x1080
Radeon RX 7900 GRE:
180.1 251.7 ~ 216 fps
Titan RTX:
193.3  fps
med. 1920x1080
Radeon RX 7900 GRE:
168.2 221 ~ 195 fps
Titan RTX:
153.9  fps
high 1920x1080
Radeon RX 7900 GRE:
160.7 196.8 ~ 179 fps
Titan RTX:
101.5  fps
ultra 1920x1080
Radeon RX 7900 GRE:
125.8 133 ~ 129 fps
Titan RTX:
101.2  fps
QHD 2560x1440
Radeon RX 7900 GRE:
103.4 107.5 ~ 105 fps
Titan RTX:
74.7  fps
4K 3840x2160
Radeon RX 7900 GRE:
68.7 70.1 ~ 69 fps
Titan RTX:
45.7  fps
low 1920x1080
Titan RTX:
182.1  fps
med. 1920x1080
Titan RTX:
170.1  fps
high 1920x1080
Titan RTX:
143.8  fps
ultra 1920x1080
Titan RTX:
126.6  fps
QHD 2560x1440
Titan RTX:
98  fps
4K 3840x2160
Titan RTX:
57.5  fps
low 1920x1080
Radeon RX 7900 GRE:
124.9 174.9 ~ 150 fps
Titan RTX:
157.5  fps
med. 1920x1080
Radeon RX 7900 GRE:
121 162.6 ~ 142 fps
Titan RTX:
143.6  fps
high 1920x1080
Radeon RX 7900 GRE:
116.8 160.1 ~ 138 fps
Titan RTX:
139.7  fps
ultra 1920x1080
Radeon RX 7900 GRE:
116.4 144.4 ~ 130 fps
Titan RTX:
136.1  fps
QHD 2560x1440
Radeon RX 7900 GRE:
111.9 122.7 ~ 117 fps
Titan RTX:
102.5  fps
4K 3840x2160
Radeon RX 7900 GRE:
72 73.1 ~ 73 fps
Titan RTX:
61  fps
low 1920x1080
Titan RTX:
166  fps
med. 1920x1080
Titan RTX:
134  fps
high 1920x1080
100%
GeForce RTX 2080 Super (Desktop):
95  fps
112%
Titan RTX:
106  fps
ultra 1920x1080
100%
GeForce RTX 2080 Super (Desktop):
89  fps
118%
Titan RTX:
105  fps
QHD 2560x1440
100%
GeForce RTX 2080 Super (Desktop):
66  fps
117%
Titan RTX:
77  fps
4K 3840x2160
100%
GeForce RTX 2080 Super (Desktop):
40  fps
118%
Titan RTX:
47  fps
4K DLSS 3840x2160
100%
GeForce RTX 2080 Super (Desktop):
63  fps
105%
Titan RTX:
66  fps
low 1920x1080
Radeon RX 7900 GRE:
115.8 134.7 ~ 125 fps
Titan RTX:
102.8  fps
med. 1920x1080
Radeon RX 7900 GRE:
111.7 131.5 ~ 122 fps
Titan RTX:
98.7  fps
high 1920x1080
Radeon RX 7900 GRE:
110.6 122 ~ 116 fps
Titan RTX:
96.8  fps
ultra 1920x1080
Radeon RX 7900 GRE:
107 114.8 ~ 111 fps
Titan RTX:
91.3  fps
QHD 2560x1440
Radeon RX 7900 GRE:
87 92.8 ~ 90 fps
Titan RTX:
74  fps
4K 3840x2160
Radeon RX 7900 GRE:
53.9 56.4 ~ 55 fps
Titan RTX:
46.2  fps
low 1920x1080
Radeon RX 7900 GRE:
176.1 202 ~ 189 fps
Titan RTX:
157  fps
med. 1920x1080
Radeon RX 7900 GRE:
144.9 157.4 ~ 151 fps
Titan RTX:
122  fps
high 1920x1080
Radeon RX 7900 GRE:
114.9 120.6 ~ 118 fps
Titan RTX:
92.1  fps
ultra 1920x1080
Radeon RX 7900 GRE:
87.7 91.9 ~ 90 fps
Titan RTX:
70  fps
QHD 2560x1440
Radeon RX 7900 GRE:
67.5 70.3 ~ 69 fps
Titan RTX:
51.1  fps
4K 3840x2160
Radeon RX 7900 GRE:
38.1 39.9 ~ 39 fps
Titan RTX:
29.6  fps
FIFA 23

FIFA 23

2022
low 1920x1080
Titan RTX:
217  fps
med. 1920x1080
Titan RTX:
221  fps
high 1920x1080
Titan RTX:
215  fps
ultra 1920x1080
Titan RTX:
218  fps
QHD 2560x1440
Titan RTX:
183.5  fps
4K 3840x2160
Titan RTX:
111.6  fps
low 1920x1080
Radeon RX 7900 GRE:
271 293 ~ 282 fps
Titan RTX:
217 221 ~ 219 fps
med. 1920x1080
Radeon RX 7900 GRE:
207 221 ~ 214 fps
Titan RTX:
168.2 169.9 ~ 169 fps
high 1920x1080
Radeon RX 7900 GRE:
171.1 179.8 ~ 175 fps
Titan RTX:
138.4 140 ~ 139 fps
ultra 1920x1080
Radeon RX 7900 GRE:
138.1 143.4 ~ 141 fps
Titan RTX:
109.4 109.4 ~ 109 fps
QHD 2560x1440
Radeon RX 7900 GRE:
94.2 97.6 ~ 96 fps
Titan RTX:
75.3 75.7 ~ 76 fps
4K 3840x2160
Radeon RX 7900 GRE:
50.1 52.9 ~ 52 fps
Titan RTX:
40.6 41 ~ 41 fps
F1 22

F1 22

2022
low 1920x1080
100%
GeForce RTX 2080 Super (Desktop):
243  fps
174%
Radeon RX 7900 GRE:
369 474 ~ 422 fps
150%
Titan RTX:
332 398 ~ 365 fps
med. 1920x1080
100%
GeForce RTX 2080 Super (Desktop):
249  fps
176%
Radeon RX 7900 GRE:
394 479 ~ 437 fps
140%
Titan RTX:
326 369 ~ 348 fps
high 1920x1080
100%
GeForce RTX 2080 Super (Desktop):
117.5  fps
312%
Radeon RX 7900 GRE:
343 390 ~ 367 fps
231%
Titan RTX:
256 285 ~ 271 fps
ultra 1920x1080
100%
GeForce RTX 2080 Super (Desktop):
65.6  fps
169%
Radeon RX 7900 GRE:
110.1 111.5 ~ 111 fps
136%
Titan RTX:
86 91.5 ~ 89 fps
QHD 2560x1440
100%
GeForce RTX 2080 Super (Desktop):
43.1  fps
174%
Radeon RX 7900 GRE:
74.2 76.1 ~ 75 fps
135%
Titan RTX:
56.3 58.9 ~ 58 fps
4K 3840x2160
100%
GeForce RTX 2080 Super (Desktop):
21.3  fps
178%
Radeon RX 7900 GRE:
38.1 38.7 ~ 38 fps
136%
Titan RTX:
28.2 29.3 ~ 29 fps
low 1920x1080
Titan RTX:
391  fps
med. 1920x1080
Titan RTX:
267  fps
high 1920x1080
Titan RTX:
252  fps
ultra 1920x1080
Titan RTX:
244  fps
QHD 2560x1440
Titan RTX:
173.2  fps
4K 3840x2160
Titan RTX:
93.6  fps
low 1920x1080
Radeon RX 7900 GRE:
205 290 ~ 248 fps
Titan RTX:
205 228 ~ 217 fps
med. 1920x1080
Radeon RX 7900 GRE:
196.4 282 ~ 239 fps
Titan RTX:
196.8 210 ~ 203 fps
high 1920x1080
Radeon RX 7900 GRE:
193.7 278 ~ 236 fps
Titan RTX:
203 207 ~ 205 fps
ultra 1920x1080
100%
GeForce RTX 2080 Super (Desktop):
157.7  fps
146%
Radeon RX 7900 GRE:
188.8 272 ~ 230 fps
129%
Titan RTX:
202 205 ~ 204 fps
QHD 2560x1440
100%
GeForce RTX 2080 Super (Desktop):
97  fps
193%
Radeon RX 7900 GRE:
179.2 194.7 ~ 187 fps
142%
Titan RTX:
135.9 141 ~ 138 fps
4K 3840x2160
100%
GeForce RTX 2080 Super (Desktop):
52.6  fps
165%
Radeon RX 7900 GRE:
84.2 89.1 ~ 87 fps
133%
Titan RTX:
67.6 73.3 ~ 70 fps
low 1920x1080
Radeon RX 7900 GRE:
325 443 ~ 384 fps
Titan RTX:
245 249 269 ~ 254 fps
med. 1920x1080
Radeon RX 7900 GRE:
251 345 ~ 298 fps
Titan RTX:
201 208 217 ~ 209 fps
high 1920x1080
Radeon RX 7900 GRE:
206 218 ~ 212 fps
Titan RTX:
150.8 151.3 152.5 ~ 152 fps
ultra 1920x1080
Radeon RX 7900 GRE:
162.2 168.5 ~ 165 fps
Titan RTX:
121.7 122.9 124.3 ~ 123 fps
QHD 2560x1440
Radeon RX 7900 GRE:
111.2 114.8 ~ 113 fps
Titan RTX:
86.5 86.7 92.4 ~ 89 fps
4K 3840x2160
Radeon RX 7900 GRE:
58.6 60.7 ~ 60 fps
Titan RTX:
46.8 48.1 50.4 ~ 48 fps
low 1920x1080
Radeon RX 7900 GRE:
179.7 236 ~ 208 fps
Titan RTX:
78.9  fps
med. 1920x1080
Radeon RX 7900 GRE:
169.4 197.8 ~ 184 fps
Titan RTX:
78.7  fps
high 1920x1080
Radeon RX 7900 GRE:
149.1 166.4 ~ 158 fps
Titan RTX:
78.6  fps
ultra 1920x1080
100%
GeForce RTX 2080 Super (Desktop):
88.8  fps
167%
Radeon RX 7900 GRE:
141.2 155.3 ~ 148 fps
88%
Titan RTX:
78.3  fps
QHD 2560x1440
100%
GeForce RTX 2080 Super (Desktop):
57.1  fps
172%
Radeon RX 7900 GRE:
94.8 101.1 ~ 98 fps
116%
Titan RTX:
66.2  fps
4K 3840x2160
100%
GeForce RTX 2080 Super (Desktop):
30.7  fps
147%
Radeon RX 7900 GRE:
43.8 46 ~ 45 fps
107%
Titan RTX:
32.8  fps
Elex 2

Elex 2

2022
low 1920x1080
Titan RTX:
111  fps
med. 1920x1080
Titan RTX:
105  fps
high 1920x1080
Titan RTX:
98  fps
ultra 1920x1080
Titan RTX:
95.4  fps
QHD 2560x1440
Titan RTX:
81.2  fps
4K 3840x2160
Titan RTX:
47.7  fps
low 1920x1080
Radeon RX 7900 GRE:
207 278 ~ 243 fps
Titan RTX:
215.9 260.1 360 ~ 279 fps
med. 1920x1080
Radeon RX 7900 GRE:
181.1 216 ~ 199 fps
Titan RTX:
195.2 217.9 304 ~ 239 fps
high 1920x1080
Radeon RX 7900 GRE:
168.8 241 ~ 205 fps
Titan RTX:
172.8 184.8 243 ~ 200 fps
ultra 1920x1080
100%
GeForce RTX 2080 Super (Desktop):
116  fps
154%
Radeon RX 7900 GRE:
159 199.5 ~ 179 fps
131%
Titan RTX:
132.5 142.7 181.7 ~ 152 fps
QHD 2560x1440
100%
GeForce RTX 2080 Super (Desktop):
97.5  fps
173%
Radeon RX 7900 GRE:
153.7 185 ~ 169 fps
131%
Titan RTX:
112.2 122.6 147.7 ~ 128 fps
4K 3840x2160
100%
GeForce RTX 2080 Super (Desktop):
66.4  fps
200%
Radeon RX 7900 GRE:
126.4 140.5 ~ 133 fps
131%
Titan RTX:
78.6 86.5 96.8 ~ 87 fps
low 1920x1080
Titan RTX:
59.9  fps
med. 1920x1080
Titan RTX:
59.9  fps
high 1920x1080
Titan RTX:
59.7  fps
ultra 1920x1080
Titan RTX:
59.9  fps
QHD 2560x1440
100%
GeForce RTX 2080 Super (Desktop):
60  fps
100%
Titan RTX:
59.9  fps
4K 3840x2160
100%
GeForce RTX 2080 Super (Desktop):
48.8  fps
122%
Titan RTX:
59.6  fps
low 1920x1080
Titan RTX:
169  fps
med. 1920x1080
Titan RTX:
110  fps
high 1920x1080
100%
GeForce RTX 2080 Super (Desktop):
79.3  fps
118%
Titan RTX:
93.6  fps
QHD 2560x1440
100%
GeForce RTX 2080 Super (Desktop):
56.2  fps
118%
Titan RTX:
66.5  fps
4K 3840x2160
100%
GeForce RTX 2080 Super (Desktop):
28.9  fps
128%
Titan RTX:
37.1  fps
low 1920x1080
Titan RTX:
264  fps
med. 1920x1080
Titan RTX:
225  fps
high 1920x1080
Titan RTX:
223  fps
ultra 1920x1080
Titan RTX:
179  fps
QHD 2560x1440
Titan RTX:
130  fps
4K 3840x2160
Titan RTX:
70  fps
low 1920x1080
Radeon RX 7900 GRE:
137.8 221 ~ 179 fps
Titan RTX:
174 182.2 185.8 ~ 181 fps
med. 1920x1080
Radeon RX 7900 GRE:
135.3 214 ~ 175 fps
Titan RTX:
149 155 159.6 ~ 155 fps
high 1920x1080
Radeon RX 7900 GRE:
133.3 180.3 ~ 157 fps
Titan RTX:
124 129 132.8 ~ 129 fps
ultra 1920x1080
100%
GeForce RTX 2080 Super (Desktop):
68.9  fps
183%
Radeon RX 7900 GRE:
124 128.3 ~ 126 fps
139%
Titan RTX:
89 95.7 101.9 ~ 96 fps
QHD 2560x1440
100%
GeForce RTX 2080 Super (Desktop):
60.5  fps
172%
Radeon RX 7900 GRE:
102.9 104.2 ~ 104 fps
132%
Titan RTX:
72.8 82.7 85.9 ~ 80 fps
4K 3840x2160
100%
GeForce RTX 2080 Super (Desktop):
40.6  fps
165%
Radeon RX 7900 GRE:
66.5 68.2 ~ 67 fps
133%
Titan RTX:
48.9 55.2 56.5 ~ 54 fps
med. 1920x1080
Titan RTX:
144  fps
high 1920x1080
Titan RTX:
125  fps
ultra 1920x1080
100%
GeForce RTX 2080 Super (Desktop):
108  fps
110%
Titan RTX:
119  fps
QHD 2560x1440
100%
GeForce RTX 2080 Super (Desktop):
81.2  fps
118%
Titan RTX:
95.5  fps
4K 3840x2160
100%
GeForce RTX 2080 Super (Desktop):
47.2  fps
146%
Titan RTX:
68.8  fps
low 1280x720
Titan RTX:
279  fps
med. 1920x1080
Titan RTX:
221  fps
high 1920x1080
Titan RTX:
186  fps
ultra 1920x1080
Titan RTX:
164  fps
QHD 2560x1440
Titan RTX:
163  fps
4K 3840x2160
Titan RTX:
122  fps
low 1280x720
Titan RTX:
99.3  fps
med. 1920x1080
Titan RTX:
139  fps
high 1920x1080
Titan RTX:
129  fps
ultra 1920x1080
Titan RTX:
117  fps
QHD 2560x1440
Titan RTX:
93.6  fps
4K 3840x2160
Titan RTX:
60.2  fps
low 1280x720
Titan RTX:
237 298 ~ 268 fps
med. 1920x1080
Titan RTX:
161 175 ~ 168 fps
high 1920x1080
Titan RTX:
148 157 ~ 153 fps
ultra 1920x1080
100%
GeForce RTX 2080 Super (Desktop):
81  fps
121%
Titan RTX:
96 100 ~ 98 fps
QHD 2560x1440
100%
GeForce RTX 2080 Super (Desktop):
70  fps
123%
Titan RTX:
84 87 ~ 86 fps
4K 3840x2160
100%
GeForce RTX 2080 Super (Desktop):
49  fps
131%
Titan RTX:
62 65 ~ 64 fps
low 1280x720
Titan RTX:
113  fps
med. 1920x1080
Titan RTX:
153  fps
high 1920x1080
Titan RTX:
144  fps
ultra 1920x1080
Titan RTX:
133  fps
QHD 2560x1440
Titan RTX:
100  fps
4K 3840x2160
Titan RTX:
59.6  fps
low 1280x720
Titan RTX:
221  fps
med. 1920x1080
Titan RTX:
179  fps
high 1920x1080
Titan RTX:
152  fps
ultra 1920x1080
100%
GeForce RTX 2080 Super (Desktop):
117  fps
122%
Titan RTX:
143  fps
QHD 2560x1440
100%
GeForce RTX 2080 Super (Desktop):
80  fps
136%
Titan RTX:
109  fps
4K 3840x2160
100%
GeForce RTX 2080 Super (Desktop):
49  fps
133%
Titan RTX:
65  fps
low 1280x720
Radeon RX 7900 GRE:
138 218 ~ 178 fps
Titan RTX:
135 210 ~ 173 fps
med. 1920x1080
Radeon RX 7900 GRE:
137 218 ~ 178 fps
Titan RTX:
134 208 ~ 171 fps
high 1920x1080
Radeon RX 7900 GRE:
135 218 ~ 177 fps
Titan RTX:
134 207 ~ 171 fps
ultra 1920x1080
Radeon RX 7900 GRE:
134 214 ~ 174 fps
Titan RTX:
133 203 ~ 168 fps
QHD 2560x1440
Radeon RX 7900 GRE:
134 178 ~ 156 fps
Titan RTX:
131 149 ~ 140 fps
4K 3840x2160
Radeon RX 7900 GRE:
97 101 ~ 99 fps
Titan RTX:
82 82 ~ 82 fps
med. 1920x1080
Titan RTX:
294  fps
high 1920x1080
Titan RTX:
270  fps
ultra 1920x1080
Titan RTX:
255  fps
QHD 2560x1440
Titan RTX:
182  fps
4K 3840x2160
Titan RTX:
101  fps
Far Cry 6

Far Cry 6

2021
low 1280x720
100%
GeForce RTX 2080 Super (Desktop):
105  fps
196%
Radeon RX 7900 GRE:
174.8 238 ~ 206 fps
175%
Titan RTX:
143 164 173 185 211 227 ~ 184 fps
med. 1920x1080
100%
GeForce RTX 2080 Super (Desktop):
98.6  fps
185%
Radeon RX 7900 GRE:
152.9 212 ~ 182 fps
153%
Titan RTX:
106 136 150 157 178.9 179.4 ~ 151 fps
high 1920x1080
100%
GeForce RTX 2080 Super (Desktop):
92  fps
182%
Radeon RX 7900 GRE:
138.3 195.3 ~ 167 fps
147%
Titan RTX:
95.8 129 133 142 155.9 156.5 ~ 135 fps
ultra 1920x1080
100%
GeForce RTX 2080 Super (Desktop):
87  fps
182%
Radeon RX 7900 GRE:
128.7 186.4 ~ 158 fps
145%
Titan RTX:
94.7 124 129 134 136.8 138.9 ~ 126 fps
QHD 2560x1440
100%
GeForce RTX 2080 Super (Desktop):
82.3  fps
165%
Radeon RX 7900 GRE:
121.3 151.5 ~ 136 fps
124%
Titan RTX:
80.9 105 105.3 106.6 107 109 ~ 102 fps
4K 3840x2160
100%
GeForce RTX 2080 Super (Desktop):
51.5  fps
169%
Radeon RX 7900 GRE:
85.7 88.1 ~ 87 fps
120%
Titan RTX:
52.8 62.4 63.6 64 64 64.2 ~ 62 fps
med. 1920x1080
Titan RTX:
93.1  fps
high 1920x1080
Titan RTX:
88.3  fps
QHD 2560x1440
Titan RTX:
88.4  fps
4K 3840x2160
Titan RTX:
88.5  fps
FIFA 22

FIFA 22

2021
4K 3840x2160
100%
GeForce RTX 2080 Super (Desktop):
208  fps
New World

New World

2021
low 1280x720
Titan RTX:
180  fps
med. 1920x1080
Titan RTX:
139  fps
high 1920x1080
Titan RTX:
131  fps
ultra 1920x1080
Titan RTX:
123  fps
QHD 2560x1440
Titan RTX:
101  fps
4K 3840x2160
Titan RTX:
54.5  fps
Deathloop

Deathloop

2021
low 1280x720
Titan RTX:
128  fps
med. 1920x1080
Titan RTX:
125  fps
high 1920x1080
Titan RTX:
124  fps
ultra 1920x1080
Titan RTX:
119  fps
QHD 2560x1440
Titan RTX:
91.6  fps
4K 3840x2160
Titan RTX:
51.8  fps
F1 2021

F1 2021

2021
low 1280x720
100%
GeForce RTX 2080 Super (Desktop):
231  fps
264%
Radeon RX 7900 GRE:
544 676 ~ 610 fps
226%
Titan RTX:
407 451 466 491 638 681 ~ 522 fps
med. 1920x1080
100%
GeForce RTX 2080 Super (Desktop):
212  fps
267%
Radeon RX 7900 GRE:
504 630 ~ 567 fps
190%
Titan RTX:
367 383 388 409 425 443 ~ 403 fps
high 1920x1080
100%
GeForce RTX 2080 Super (Desktop):
183  fps
247%
Radeon RX 7900 GRE:
420 483 ~ 452 fps
180%
Titan RTX:
302 307 331 337 343 361 ~ 330 fps
ultra 1920x1080
100%
GeForce RTX 2080 Super (Desktop):
113 114 ~ 114 fps
180%
Radeon RX 7900 GRE:
200 209 ~ 205 fps
146%
Titan RTX:
160 160 165 168.7 171.1 172 ~ 166 fps
QHD 2560x1440
100%
GeForce RTX 2080 Super (Desktop):
92.3  fps
172%
Radeon RX 7900 GRE:
155.9 161.2 ~ 159 fps
135%
Titan RTX:
121 122 126 126.6 127.5 129 ~ 125 fps
4K 3840x2160
100%
GeForce RTX 2080 Super (Desktop):
53.5  fps
174%
Radeon RX 7900 GRE:
91.8 93.8 ~ 93 fps
136%
Titan RTX:
71.9 72.6 73 73.2 74.3 74.5 ~ 73 fps
low 1280x720
Titan RTX:
144  fps
med. 1920x1080
Titan RTX:
144  fps
high 1920x1080
Titan RTX:
144  fps
QHD 2560x1440
Titan RTX:
144  fps
4K 3840x2160
Titan RTX:
144  fps
Days Gone

Days Gone

2021
low 1280x720
Titan RTX:
190  fps
med. 1920x1080
Titan RTX:
181  fps
high 1920x1080
Titan RTX:
174  fps
ultra 1920x1080
Titan RTX:
141  fps
QHD 2560x1440
Titan RTX:
108  fps
4K 3840x2160
Titan RTX:
64.9  fps
low 1280x720
Titan RTX:
106  fps
ultra 1920x1080
Titan RTX:
113  fps
QHD 2560x1440
Titan RTX:
107  fps
4K 3840x2160
Titan RTX:
106  fps
low 1280x720
Titan RTX:
304  fps
med. 1920x1080
Titan RTX:
264  fps
high 1920x1080
Titan RTX:
241  fps
ultra 1920x1080
Titan RTX:
212  fps
QHD 2560x1440
Titan RTX:
142  fps
4K 3840x2160
Titan RTX:
74.2  fps
Outriders

Outriders

2021
low 1280x720
Titan RTX:
136  fps
med. 1920x1080
Titan RTX:
162  fps
high 1920x1080
Titan RTX:
158  fps
ultra 1920x1080
Titan RTX:
156  fps
QHD 2560x1440
Titan RTX:
119  fps
4K 3840x2160
Titan RTX:
64  fps
Hitman 3

Hitman 3

2021
low 1280x720
100%
GeForce RTX 2080 Super (Desktop):
272  fps
100%
Titan RTX:
271  fps
med. 1920x1080
100%
GeForce RTX 2080 Super (Desktop):
197  fps
113%
Titan RTX:
222  fps
high 1920x1080
100%
GeForce RTX 2080 Super (Desktop):
179  fps
117%
Titan RTX:
210  fps
ultra 1920x1080
100%
GeForce RTX 2080 Super (Desktop):
166  fps
122%
Titan RTX:
202  fps
QHD 2560x1440
100%
GeForce RTX 2080 Super (Desktop):
115  fps
126%
Titan RTX:
145  fps
4K 3840x2160
100%
GeForce RTX 2080 Super (Desktop):
64  fps
128%
Titan RTX:
82  fps
low 1280x720
100%
GeForce RTX 2080 Super (Desktop):
126  fps
87%
Titan RTX:
109  fps
med. 1920x1080
100%
GeForce RTX 2080 Super (Desktop):
95  fps
108%
Titan RTX:
103  fps
high 1920x1080
100%
GeForce RTX 2080 Super (Desktop):
82.6  fps
113%
Titan RTX:
93.2  fps
ultra 1920x1080
100%
GeForce RTX 2080 Super (Desktop):
72.1  fps
114%
Titan RTX:
82.3  fps
QHD 2560x1440
100%
GeForce RTX 2080 Super (Desktop):
49.1  fps
119%
Titan RTX:
58.4  fps
4K 3840x2160
100%
GeForce RTX 2080 Super (Desktop):
24.1  fps
128%
Titan RTX:
30.9  fps
low 1280x720
Titan RTX:
136  fps
med. 1920x1080
Titan RTX:
106  fps
high 1920x1080
Titan RTX:
93  fps
ultra 1920x1080
Titan RTX:
71  fps
QHD 2560x1440
Titan RTX:
64  fps
4K 3840x2160
Titan RTX:
48  fps
low 1280x720
100%
GeForce RTX 2080 Super (Desktop):
114  fps
104%
Titan RTX:
119  fps
med. 1920x1080
100%
GeForce RTX 2080 Super (Desktop):
113  fps
104%
Titan RTX:
117  fps
high 1920x1080
100%
GeForce RTX 2080 Super (Desktop):
116  fps
100%
Titan RTX:
116  fps
ultra 1920x1080
100%
GeForce RTX 2080 Super (Desktop):
108  fps
103%
Titan RTX:
111  fps
QHD 2560x1440
100%
GeForce RTX 2080 Super (Desktop):
79.2  fps
126%
Titan RTX:
100  fps
4K 3840x2160
100%
GeForce RTX 2080 Super (Desktop):
42.5  fps
130%
Titan RTX:
55.2  fps
low 1280x720
100%
GeForce RTX 2080 Super (Desktop):
130 240 ~ 185 fps
137%
Titan RTX:
254  fps
med. 1920x1080
100%
GeForce RTX 2080 Super (Desktop):
95 172 ~ 134 fps
178%
Titan RTX:
238  fps
high 1920x1080
100%
GeForce RTX 2080 Super (Desktop):
83 127 ~ 105 fps
154%
Titan RTX:
162  fps
ultra 1920x1080
100%
GeForce RTX 2080 Super (Desktop):
59 106 ~ 83 fps
173%
Titan RTX:
144  fps
QHD 2560x1440
100%
GeForce RTX 2080 Super (Desktop):
51 77.6 ~ 64 fps
137%
Titan RTX:
87.6  fps
4K 3840x2160
100%
GeForce RTX 2080 Super (Desktop):
38 44.5 ~ 41 fps
129%
Titan RTX:
52.9  fps
low 1280x720
100%
GeForce RTX 2080 Super (Desktop):
128  fps
107%
Titan RTX:
137  fps
med. 1920x1080
100%
GeForce RTX 2080 Super (Desktop):
94  fps
111%
Titan RTX:
104  fps
high 1920x1080
100%
GeForce RTX 2080 Super (Desktop):
79  fps
111%
Titan RTX:
88  fps
ultra 1920x1080
100%
GeForce RTX 2080 Super (Desktop):
70  fps
114%
Titan RTX:
80  fps
QHD 2560x1440
100%
GeForce RTX 2080 Super (Desktop):
57  fps
116%
Titan RTX:
66  fps
4K 3840x2160
100%
GeForce RTX 2080 Super (Desktop):
36  fps
119%
Titan RTX:
43  fps
Dirt 5

Dirt 5

2020
low 1280x720
100%
GeForce RTX 2080 Super (Desktop):
217  fps
86%
Titan RTX:
187  fps
med. 1920x1080
100%
GeForce RTX 2080 Super (Desktop):
139  fps
92%
Titan RTX:
128  fps
high 1920x1080
100%
GeForce RTX 2080 Super (Desktop):
115  fps
92%
Titan RTX:
106  fps
ultra 1920x1080
100%
GeForce RTX 2080 Super (Desktop):
96.3  fps
100%
Titan RTX:
95.9  fps
QHD 2560x1440
100%
GeForce RTX 2080 Super (Desktop):
82.5  fps
96%
Titan RTX:
79.5  fps
4K 3840x2160
100%
GeForce RTX 2080 Super (Desktop):
54.1  fps
105%
Titan RTX:
57  fps
low 1280x720
100%
GeForce RTX 2080 Super (Desktop):
117  fps
97%
Titan RTX:
113  fps
med. 1920x1080
100%
GeForce RTX 2080 Super (Desktop):
114  fps
98%
Titan RTX:
112  fps
high 1920x1080
100%
GeForce RTX 2080 Super (Desktop):
99.3  fps
98%
Titan RTX:
97.4  fps
ultra 1920x1080
100%
GeForce RTX 2080 Super (Desktop):
75.4  fps
113%
Titan RTX:
85.5  fps
QHD 2560x1440
100%
GeForce RTX 2080 Super (Desktop):
57.3  fps
122%
Titan RTX:
69.9  fps
4K 3840x2160
100%
GeForce RTX 2080 Super (Desktop):
34.4  fps
126%
Titan RTX:
43.4  fps
FIFA 21

FIFA 21

2020
low 1280x720
100%
GeForce RTX 2080 Super (Desktop):
228  fps
94%
Titan RTX:
215  fps
med. 1920x1080
100%
GeForce RTX 2080 Super (Desktop):
227  fps
95%
Titan RTX:
215  fps
high 1920x1080
100%
GeForce RTX 2080 Super (Desktop):
211  fps
97%
Titan RTX:
204  fps
ultra 1920x1080
100%
GeForce RTX 2080 Super (Desktop):
210  fps
97%
Titan RTX:
203  fps
QHD 2560x1440
100%
GeForce RTX 2080 Super (Desktop):
211  fps
97%
Titan RTX:
205  fps
4K 3840x2160
100%
GeForce RTX 2080 Super (Desktop):
205  fps
99%
Titan RTX:
203  fps
low 1280x720
100%
GeForce RTX 2080 Super (Desktop):
448  fps
98%
Titan RTX:
440  fps
med. 1920x1080
100%
GeForce RTX 2080 Super (Desktop):
351  fps
105%
Titan RTX:
367  fps
high 1920x1080
100%
GeForce RTX 2080 Super (Desktop):
307  fps
109%
Titan RTX:
334  fps
ultra 1920x1080
100%
GeForce RTX 2080 Super (Desktop):
286  fps
110%
Titan RTX:
315  fps
QHD 2560x1440
100%
GeForce RTX 2080 Super (Desktop):
201  fps
115%
Titan RTX:
232  fps
4K 3840x2160
100%
GeForce RTX 2080 Super (Desktop):
119  fps
121%
Titan RTX:
144  fps
low 1280x720
100%
GeForce RTX 2080 Super (Desktop):
152.5  fps
98%
Titan RTX:
149.8  fps
med. 1920x1080
100%
GeForce RTX 2080 Super (Desktop):
130.2  fps
102%
Titan RTX:
133  fps
high 1920x1080
100%
GeForce RTX 2080 Super (Desktop):
118.1  fps
105%
Titan RTX:
123.7  fps
QHD 2560x1440
100%
GeForce RTX 2080 Super (Desktop):
88.8  fps
123%
Titan RTX:
109  fps
4K 3840x2160
100%
GeForce RTX 2080 Super (Desktop):
48.5  fps
131%
Titan RTX:
63.4  fps
low 1280x720
100%
GeForce RTX 2080 Super (Desktop):
134.4  fps
103%
Titan RTX:
138.2  fps
med. 1920x1080
100%
GeForce RTX 2080 Super (Desktop):
113.6  fps
95%
Titan RTX:
108.1  fps
high 1920x1080
100%
GeForce RTX 2080 Super (Desktop):
107.7  fps
99%
Titan RTX:
106.4  fps
ultra 1920x1080
100%
GeForce RTX 2080 Super (Desktop):
104.6  fps
95%
Titan RTX:
99.1  fps
QHD 2560x1440
100%
GeForce RTX 2080 Super (Desktop):
94.2  fps
98%
Titan RTX:
92.4  fps
4K 3840x2160
100%
GeForce RTX 2080 Super (Desktop):
67.7  fps
105%
Titan RTX:
71.2  fps
low 1280x720
100%
GeForce RTX 2080 Super (Desktop):
248  fps
110%
Titan RTX:
273  fps
med. 1920x1080
100%
GeForce RTX 2080 Super (Desktop):
191  fps
39%
Titan RTX:
74.5  fps
high 1920x1080
100%
GeForce RTX 2080 Super (Desktop):
99.4  fps
213%
Titan RTX:
212  fps
ultra 1920x1080
100%
GeForce RTX 2080 Super (Desktop):
78.9  fps
146%
Titan RTX:
115  fps
QHD 2560x1440
100%
GeForce RTX 2080 Super (Desktop):
48.8  fps
186%
Titan RTX:
90.9  fps
4K 3840x2160
100%
GeForce RTX 2080 Super (Desktop):
30.6  fps
160%
Titan RTX:
48.9  fps
low 1280x720
100%
GeForce RTX 2080 Super (Desktop):
87.3  fps
97%
Titan RTX:
85  fps
med. 1920x1080
100%
GeForce RTX 2080 Super (Desktop):
76.2  fps
98%
Titan RTX:
75  fps
high 1920x1080
100%
GeForce RTX 2080 Super (Desktop):
63.1  fps
98%
Titan RTX:
62  fps
ultra 1920x1080
100%
GeForce RTX 2080 Super (Desktop):
47.2  fps
108%
Titan RTX:
51  fps
QHD 2560x1440
100%
GeForce RTX 2080 Super (Desktop):
40.2  fps
119%
Titan RTX:
48  fps
4K 3840x2160
100%
GeForce RTX 2080 Super (Desktop):
24.9  fps
129%
Titan RTX:
32  fps
low 1280x720
100%
GeForce RTX 2080 Super (Desktop):
158  fps
100%
Titan RTX:
158  fps
med. 1920x1080
100%
GeForce RTX 2080 Super (Desktop):
125  fps
114%
Titan RTX:
142  fps
high 1920x1080
100%
GeForce RTX 2080 Super (Desktop):
113  fps
112%
Titan RTX:
126  fps
ultra 1920x1080
100%
GeForce RTX 2080 Super (Desktop):
95  fps
115%
Titan RTX:
109  fps
QHD 2560x1440
100%
GeForce RTX 2080 Super (Desktop):
75  fps
120%
Titan RTX:
90  fps
4K 3840x2160
100%
GeForce RTX 2080 Super (Desktop):
44  fps
123%
Titan RTX:
54  fps
low 1280x720
100%
GeForce RTX 2080 Super (Desktop):
189  fps
125%
Radeon RX 7900 GRE:
236  fps
115%
Titan RTX:
196 239 ~ 218 fps
med. 1920x1080
100%
GeForce RTX 2080 Super (Desktop):
161  fps
146%
Radeon RX 7900 GRE:
235  fps
124%
Titan RTX:
181 217 ~ 199 fps
high 1920x1080
100%
GeForce RTX 2080 Super (Desktop):
148  fps
158%
Radeon RX 7900 GRE:
234  fps
126%
Titan RTX:
172 201 ~ 187 fps
ultra 1920x1080
100%
GeForce RTX 2080 Super (Desktop):
146  fps
160%
Radeon RX 7900 GRE:
233  fps
125%
Titan RTX:
167 196.7 ~ 182 fps
QHD 2560x1440
100%
GeForce RTX 2080 Super (Desktop):
105  fps
201%
Radeon RX 7900 GRE:
211  fps
130%
Titan RTX:
125 146.4 ~ 136 fps
4K 3840x2160
100%
GeForce RTX 2080 Super (Desktop):
60.3  fps
196%
Radeon RX 7900 GRE:
118.1  fps
131%
Titan RTX:
73.7 85.1 ~ 79 fps
F1 2020

F1 2020

2020
low 1280x720
100%
GeForce RTX 2080 Super (Desktop):
297  fps
178%
Radeon RX 7900 GRE:
494 562 ~ 528 fps
141%
Titan RTX:
305 340 405 405 432 498 557 ~ 420 fps
med. 1920x1080
100%
GeForce RTX 2080 Super (Desktop):
254  fps
176%
Radeon RX 7900 GRE:
414 477 ~ 446 fps
131%
Titan RTX:
255 291 332 332 343 369 406 ~ 333 fps
high 1920x1080
100%
GeForce RTX 2080 Super (Desktop):
225  fps
185%
Radeon RX 7900 GRE:
394 439 ~ 417 fps
133%
Titan RTX:
251 288 303 307 307 309 331 ~ 299 fps
ultra 1920x1080
100%
GeForce RTX 2080 Super (Desktop):
162  fps
181%
Radeon RX 7900 GRE:
287 300 ~ 294 fps
133%
Titan RTX:
194 213 216 218 219 219 231 ~ 216 fps
QHD 2560x1440
100%
GeForce RTX 2080 Super (Desktop):
127  fps
182%
Radeon RX 7900 GRE:
228 233 ~ 231 fps
131%
Titan RTX:
153 167 168 168.4 172 175.8 ~ 167 fps
4K 3840x2160
100%
GeForce RTX 2080 Super (Desktop):
77.2  fps
181%
Radeon RX 7900 GRE:
139.4 141.5 ~ 140 fps
132%
Titan RTX:
97.4 101 101.3 103 103 103.4 ~ 102 fps
Valorant

Valorant

2020
low 1280x720
100%
GeForce RTX 2080 Super (Desktop):
341  fps
111%
Titan RTX:
377  fps
med. 1920x1080
100%
GeForce RTX 2080 Super (Desktop):
301  fps
116%
Titan RTX:
348  fps
high 1920x1080
100%
GeForce RTX 2080 Super (Desktop):
283  fps
119%
Titan RTX:
336  fps
QHD 2560x1440
100%
GeForce RTX 2080 Super (Desktop):
273  fps
112%
Titan RTX:
307  fps
4K 3840x2160
100%
GeForce RTX 2080 Super (Desktop):
262  fps
115%
Titan RTX:
300  fps
low 1280x720
100%
GeForce RTX 2080 Super (Desktop):
323.2  fps
101%
Titan RTX:
325.9  fps
med. 1920x1080
100%
GeForce RTX 2080 Super (Desktop):
228.5  fps
87%
Titan RTX:
197.7  fps
high 1920x1080
100%
GeForce RTX 2080 Super (Desktop):
151  fps
97%
Titan RTX:
146.9  fps
ultra 1920x1080
100%
GeForce RTX 2080 Super (Desktop):
118.5  fps
119%
Titan RTX:
141.2  fps
QHD 2560x1440
100%
GeForce RTX 2080 Super (Desktop):
81.6  fps
129%
Titan RTX:
105.3  fps
4K 3840x2160
100%
GeForce RTX 2080 Super (Desktop):
48.7  fps
116%
Titan RTX:
56.3  fps
low 1280x720
100%
GeForce RTX 2080 Super (Desktop):
242  fps
100%
Titan RTX:
242  fps
med. 1920x1080
100%
GeForce RTX 2080 Super (Desktop):
223  fps
110%
Titan RTX:
246  fps
high 1920x1080
100%
GeForce RTX 2080 Super (Desktop):
219  fps
109%
Titan RTX:
239  fps
ultra 1920x1080
100%
GeForce RTX 2080 Super (Desktop):
217  fps
109%
Titan RTX:
236  fps
QHD 2560x1440
100%
GeForce RTX 2080 Super (Desktop):
163  fps
118%
Titan RTX:
192  fps
4K 3840x2160
100%
GeForce RTX 2080 Super (Desktop):
86.8  fps
121%
Titan RTX:
105  fps
low 1280x720
100%
GeForce RTX 2080 Super (Desktop):
254  fps
93%
Titan RTX:
235  fps
med. 1920x1080
100%
GeForce RTX 2080 Super (Desktop):
170  fps
114%
Titan RTX:
194  fps
high 1920x1080
100%
GeForce RTX 2080 Super (Desktop):
142  fps
120%
Titan RTX:
171  fps
QHD 2560x1440
100%
GeForce RTX 2080 Super (Desktop):
96.6  fps
128%
Titan RTX:
124  fps
4K 3840x2160
100%
GeForce RTX 2080 Super (Desktop):
46.8  fps
132%
Titan RTX:
61.8  fps
low 1280x720
100%
GeForce RTX 2080 Super (Desktop):
120  fps
101%
Titan RTX:
121  fps
med. 1920x1080
100%
GeForce RTX 2080 Super (Desktop):
118  fps
103%
Titan RTX:
121  fps
high 1920x1080
100%
GeForce RTX 2080 Super (Desktop):
117  fps
103%
Titan RTX:
120  fps
ultra 1920x1080
100%
GeForce RTX 2080 Super (Desktop):
111  fps
107%
Titan RTX:
119  fps
QHD 2560x1440
100%
GeForce RTX 2080 Super (Desktop):
90.2  fps
130%
Titan RTX:
117  fps
4K 3840x2160
100%
GeForce RTX 2080 Super (Desktop):
53.7  fps
152%
Titan RTX:
81.7  fps
low 1280x720
100%
GeForce RTX 2080 Super (Desktop):
144  fps
99%
Titan RTX:
142  fps
med. 1920x1080
100%
GeForce RTX 2080 Super (Desktop):
126  fps
106%
Titan RTX:
133  fps
high 1920x1080
100%
GeForce RTX 2080 Super (Desktop):
93  fps
118%
Titan RTX:
110  fps
ultra 1920x1080
100%
GeForce RTX 2080 Super (Desktop):
61  fps
125%
Titan RTX:
76  fps
QHD 2560x1440
100%
GeForce RTX 2080 Super (Desktop):
50.6  fps
125%
Titan RTX:
63  fps
4K 3840x2160
100%
GeForce RTX 2080 Super (Desktop):
33  fps
124%
Titan RTX:
41  fps
med. 1920x1080
100%
GeForce RTX 2080 Super (Desktop):
122  fps
104%
Titan RTX:
126 127 ~ 127 fps
high 1920x1080
100%
GeForce RTX 2080 Super (Desktop):
120  fps
105%
Titan RTX:
124 127 ~ 126 fps
ultra 1920x1080
100%
GeForce RTX 2080 Super (Desktop):
118  fps
104%
Titan RTX:
122 123 ~ 123 fps
QHD 2560x1440
100%
GeForce RTX 2080 Super (Desktop):
107  fps
111%
Titan RTX:
118 119 ~ 119 fps
4K 3840x2160
100%
GeForce RTX 2080 Super (Desktop):
59.5  fps
124%
Titan RTX:
73 74 ~ 74 fps
low 1280x720
100%
GeForce RTX 2080 Super (Desktop):
114  fps
109%
Titan RTX:
114 133 ~ 124 fps
med. 1920x1080
100%
GeForce RTX 2080 Super (Desktop):
108  fps
110%
Titan RTX:
109 128 ~ 119 fps
high 1920x1080
100%
GeForce RTX 2080 Super (Desktop):
100  fps
110%
Titan RTX:
102 118 ~ 110 fps
ultra 1920x1080
100%
GeForce RTX 2080 Super (Desktop):
92  fps
109%
Titan RTX:
93 107 ~ 100 fps
QHD 2560x1440
100%
GeForce RTX 2080 Super (Desktop):
90  fps
109%
Titan RTX:
91 105 ~ 98 fps
4K 3840x2160
100%
GeForce RTX 2080 Super (Desktop):
56.5  fps
120%
Titan RTX:
68 68 ~ 68 fps
low 1280x720
100%
GeForce RTX 2080 Super (Desktop):
203  fps
110%
Titan RTX:
207 241 ~ 224 fps
med. 1920x1080
100%
GeForce RTX 2080 Super (Desktop):
191  fps
112%
Titan RTX:
205 220 ~ 213 fps
high 1920x1080
100%
GeForce RTX 2080 Super (Desktop):
163  fps
117%
Titan RTX:
189 190 ~ 190 fps
ultra 1920x1080
100%
GeForce RTX 2080 Super (Desktop):
144  fps
118%
Titan RTX:
169 170 ~ 170 fps
QHD 2560x1440
100%
GeForce RTX 2080 Super (Desktop):
110  fps
119%
Titan RTX:
129 132 ~ 131 fps
4K 3840x2160
100%
GeForce RTX 2080 Super (Desktop):
65  fps
122%
Titan RTX:
78 80 ~ 79 fps
GRID 2019

GRID 2019

2019
low 1280x720
100%
GeForce RTX 2080 Super (Desktop):
169  fps
134%
Titan RTX:
227  fps
med. 1920x1080
100%
GeForce RTX 2080 Super (Desktop):
148  fps
128%
Titan RTX:
189  fps
high 1920x1080
100%
GeForce RTX 2080 Super (Desktop):
141  fps
118%
Titan RTX:
167  fps
ultra 1920x1080
100%
GeForce RTX 2080 Super (Desktop):
118  fps
125%
Titan RTX:
147  fps
QHD 2560x1440
100%
GeForce RTX 2080 Super (Desktop):
99  fps
123%
Titan RTX:
122  fps
4K 3840x2160
100%
GeForce RTX 2080 Super (Desktop):
64  fps
123%
Titan RTX:
79  fps
low 1280x720
100%
GeForce RTX 2080 Super (Desktop):
158  fps
104%
Titan RTX:
160 170 ~ 165 fps
med. 1920x1080
100%
GeForce RTX 2080 Super (Desktop):
127  fps
113%
Titan RTX:
140 146 ~ 143 fps
high 1920x1080
100%
GeForce RTX 2080 Super (Desktop):
120  fps
109%
Titan RTX:
127 135 ~ 131 fps
ultra 1920x1080
100%
GeForce RTX 2080 Super (Desktop):
90  fps
113%
Titan RTX:
99 104 ~ 102 fps
QHD 2560x1440
100%
GeForce RTX 2080 Super (Desktop):
65  fps
122%
Titan RTX:
78 80 ~ 79 fps
4K 3840x2160
100%
GeForce RTX 2080 Super (Desktop):
39  fps
128%
Titan RTX:
49 50 ~ 50 fps
FIFA 20

FIFA 20

2019
low 1280x720
100%
GeForce RTX 2080 Super (Desktop):
269  fps
99%
Titan RTX:
266  fps
med. 1920x1080
100%
GeForce RTX 2080 Super (Desktop):
267  fps
99%
Titan RTX:
263  fps
high 1920x1080
100%
GeForce RTX 2080 Super (Desktop):
254  fps
97%
Titan RTX:
247  fps
ultra 1920x1080
100%
GeForce RTX 2080 Super (Desktop):
253  fps
97%
Titan RTX:
245  fps
QHD 2560x1440
100%
GeForce RTX 2080 Super (Desktop):
252  fps
97%
Titan RTX:
245  fps
4K 3840x2160
100%
GeForce RTX 2080 Super (Desktop):
242  fps
100%
Titan RTX:
242  fps
low 1280x720
100%
GeForce RTX 2080 Super (Desktop):
150.3  fps
139%
Radeon RX 7900 GRE:
170.6 247 ~ 209 fps
118%
Titan RTX:
102.4 116 120.9 136 143 147 150 151 155 159 164 164 166 168 175 183 186 188 191.1 198 200 202 214 217 221 221 229 237 250 ~ 178 fps
med. 1920x1080
100%
GeForce RTX 2080 Super (Desktop):
131.9  fps
140%
Radeon RX 7900 GRE:
147.8 222 ~ 185 fps
117%
Titan RTX:
88.1 107 109.9 120 127 132 132 136 138 140 143 146 148 149 155 160 161 165 166.7 172 174 175 177 182 183 183 187 201 209 ~ 154 fps
high 1920x1080
100%
GeForce RTX 2080 Super (Desktop):
108.2  fps
148%
Radeon RX 7900 GRE:
135.5 185.4 ~ 160 fps
121%
Titan RTX:
81.2 100 102.4 112 116 119 122 122 124 125 129 130 130 132 136 137 138 138 138 139 141 141 141 141 144 144 147 157 160.3 ~ 131 fps
ultra 1920x1080
100%
GeForce RTX 2080 Super (Desktop):
91  fps
152%
Radeon RX 7900 GRE:
123.4 153.4 ~ 138 fps
123%
Titan RTX:
77.2 92 94.7 102 103 104 107 109 109 111 112 112 114 114 115 116 116 116 117 117 117 117 118 118 119 122 124 127.4 128.7 ~ 112 fps
QHD 2560x1440
100%
GeForce RTX 2080 Super (Desktop):
65.5  fps
168%
Radeon RX 7900 GRE:
104.6 115.5 ~ 110 fps
130%
Titan RTX:
74 79 80 82 82 82 82.1 83 83.2 83.2 83.8 83.8 83.9 84 84.4 84.7 84.8 85 85 85 85.1 86 86.1 88.4 89.9 90.4 90.9 91.6 93.1 ~ 85 fps
4K 3840x2160
100%
GeForce RTX 2080 Super (Desktop):
35.9  fps
175%
Radeon RX 7900 GRE:
61.7 64.1 ~ 63 fps
131%
Titan RTX:
46 46 46 46 46 46.3 46.3 46.3 46.4 46.5 46.5 46.6 46.7 46.8 46.9 47 47 47 47.1 47.2 47.2 47.9 48 48.1 49.2 49.6 49.7 49.8 52.8 ~ 47 fps
Control

Control

2019
low 1280x720
100%
GeForce RTX 2080 Super (Desktop):
240  fps
100%
Radeon RX 7900 GRE:
240 240 ~ 240 fps
96%
Titan RTX:
211 240 240 ~ 230 fps
med. 1920x1080
100%
GeForce RTX 2080 Super (Desktop):
124  fps
194%
Radeon RX 7900 GRE:
239 240 ~ 240 fps
143%
Titan RTX:
170 176 186.1 ~ 177 fps
high 1920x1080
100%
GeForce RTX 2080 Super (Desktop):
95  fps
211%
Radeon RX 7900 GRE:
197.2 202 ~ 200 fps
144%
Titan RTX:
135 135 141.9 ~ 137 fps
QHD 2560x1440
100%
GeForce RTX 2080 Super (Desktop):
62  fps
206%
Radeon RX 7900 GRE:
126.9 128.8 ~ 128 fps
148%
Titan RTX:
89 92 93.6 ~ 92 fps
4K 3840x2160
100%
GeForce RTX 2080 Super (Desktop):
30.4  fps
201%
Radeon RX 7900 GRE:
60.9 62 ~ 61 fps
155%
Titan RTX:
45.2 47 47.3 ~ 47 fps
F1 2019

F1 2019

2019
low 1280x720
100%
GeForce RTX 2080 Super (Desktop):
207  fps
84%
Titan RTX:
174  fps
med. 1920x1080
100%
GeForce RTX 2080 Super (Desktop):
191  fps
85%
Titan RTX:
163  fps
high 1920x1080
100%
GeForce RTX 2080 Super (Desktop):
157  fps
94%
Titan RTX:
147  fps
ultra 1920x1080
100%
GeForce RTX 2080 Super (Desktop):
145 169 ~ 157 fps
85%
Titan RTX:
134  fps
QHD 2560x1440
100%
GeForce RTX 2080 Super (Desktop):
124 137 ~ 131 fps
102%
Titan RTX:
134  fps
4K 3840x2160
100%
GeForce RTX 2080 Super (Desktop):
79 84 ~ 82 fps
120%
Titan RTX:
98  fps
low 1280x720
100%
GeForce RTX 2080 Super (Desktop):
234.4  fps
100%
Titan RTX:
234.7  fps
med. 1920x1080
100%
GeForce RTX 2080 Super (Desktop):
149.2  fps
101%
Titan RTX:
151.3  fps
high 1920x1080
100%
GeForce RTX 2080 Super (Desktop):
118.5  fps
104%
Titan RTX:
123.8  fps
ultra 1920x1080
100%
GeForce RTX 2080 Super (Desktop):
90.9 91.2 ~ 91 fps
117%
Titan RTX:
106.1  fps
QHD 2560x1440
100%
GeForce RTX 2080 Super (Desktop):
58.9 66.6 ~ 63 fps
120%
Titan RTX:
75.5  fps
4K 3840x2160
100%
GeForce RTX 2080 Super (Desktop):
29.3 34.1 ~ 32 fps
120%
Titan RTX:
38.4  fps
Rage 2

Rage 2

2019
low 1280x720
100%
GeForce RTX 2080 Super (Desktop):
229  fps
123%
Titan RTX:
282  fps
med. 1920x1080
100%
GeForce RTX 2080 Super (Desktop):
157  fps
111%
Titan RTX:
175  fps
high 1920x1080
100%
GeForce RTX 2080 Super (Desktop):
136  fps
116%
Titan RTX:
158  fps
ultra 1920x1080
100%
GeForce RTX 2080 Super (Desktop):
133 137 ~ 135 fps
116%
Titan RTX:
157  fps
QHD 2560x1440
100%
GeForce RTX 2080 Super (Desktop):
90 91 ~ 91 fps
116%
Titan RTX:
106  fps
4K 3840x2160
100%
GeForce RTX 2080 Super (Desktop):
46.4 47.3 ~ 47 fps
116%
Titan RTX:
54.6  fps
Anno 1800

Anno 1800

2019
low 1280x720
100%
GeForce RTX 2080 Super (Desktop):
90  fps
112%
Titan RTX:
70 131 ~ 101 fps
med. 1920x1080
100%
GeForce RTX 2080 Super (Desktop):
88  fps
110%
Titan RTX:
69 125 ~ 97 fps
high 1920x1080
100%
GeForce RTX 2080 Super (Desktop):
70  fps
109%
Titan RTX:
56.9 96 ~ 76 fps
ultra 1920x1080
100%
GeForce RTX 2080 Super (Desktop):
38.6 45.9 ~ 42 fps
105%
Titan RTX:
33.9 54.5 ~ 44 fps
QHD 2560x1440
100%
GeForce RTX 2080 Super (Desktop):
38 40.4 ~ 39 fps
108%
Titan RTX:
33.4 50.9 ~ 42 fps
4K 3840x2160
100%
GeForce RTX 2080 Super (Desktop):
35.1 35.5 ~ 35 fps
106%
Titan RTX:
33 40.4 ~ 37 fps
low 1280x720
100%
GeForce RTX 2080 Super (Desktop):
182  fps
86%
Titan RTX:
157  fps
med. 1920x1080
100%
GeForce RTX 2080 Super (Desktop):
150  fps
98%
Titan RTX:
147  fps
high 1920x1080
100%
GeForce RTX 2080 Super (Desktop):
129  fps
99%
Titan RTX:
128  fps
ultra 1920x1080
100%
GeForce RTX 2080 Super (Desktop):
106  fps
107%
Titan RTX:
113  fps
QHD 2560x1440
100%
GeForce RTX 2080 Super (Desktop):
79  fps
129%
Titan RTX:
102  fps
4K 3840x2160
100%
GeForce RTX 2080 Super (Desktop):
43 45 ~ 44 fps
141%
Titan RTX:
62  fps
low 1280x720
100%
GeForce RTX 2080 Super (Desktop):
235  fps
85%
Titan RTX:
200  fps
med. 1920x1080
100%
GeForce RTX 2080 Super (Desktop):
186  fps
89%
Titan RTX:
166  fps
high 1920x1080
100%
GeForce RTX 2080 Super (Desktop):
179  fps
91%
Titan RTX:
162  fps
ultra 1920x1080
100%
GeForce RTX 2080 Super (Desktop):
129  fps
115%
Titan RTX:
148  fps
QHD 2560x1440
100%
GeForce RTX 2080 Super (Desktop):
100  fps
132%
Titan RTX:
132  fps
4K 3840x2160
100%
GeForce RTX 2080 Super (Desktop):
58.8 63 ~ 61 fps
136%
Titan RTX:
83  fps
Anthem

Anthem

2019
low 1280x720
100%
GeForce RTX 2080 Super (Desktop):
105  fps
96%
Titan RTX:
101  fps
med. 1920x1080
100%
GeForce RTX 2080 Super (Desktop):
103  fps
94%
Titan RTX:
97  fps
high 1920x1080
100%
GeForce RTX 2080 Super (Desktop):
100  fps
93%
Titan RTX:
93  fps
ultra 1920x1080
100%
GeForce RTX 2080 Super (Desktop):
95  fps
97%
Titan RTX:
92  fps
QHD 2560x1440
100%
GeForce RTX 2080 Super (Desktop):
87  fps
103%
Titan RTX:
90  fps
4K 3840x2160
100%
GeForce RTX 2080 Super (Desktop):
55.5  fps
137%
Titan RTX:
76  fps
low 1280x720
100%
GeForce RTX 2080 Super (Desktop):
111  fps
149%
Radeon RX 7900 GRE:
145 185 ~ 165 fps
134%
Titan RTX:
88 97 99 102 104 122 122 130 132 135 143 147 147 151 152 164 164 165 166 168 171 176 178 178 179 188 188 203 ~ 149 fps
med. 1920x1080
100%
GeForce RTX 2080 Super (Desktop):
98  fps
152%
Radeon RX 7900 GRE:
131 166 ~ 149 fps
132%
Titan RTX:
80 86 86 92 92 105 107 108 115 115 120 124 125 134 135 142 144 145 146 147 148 152 155 155 156 162 167 178 ~ 129 fps
high 1920x1080
100%
GeForce RTX 2080 Super (Desktop):
95  fps
149%
Radeon RX 7900 GRE:
126 158 ~ 142 fps
131%
Titan RTX:
78 83 83 88 89 101 103 104 111 111 113 120 120 129 129 136 139 140 141 143 147 148 149 151 154 162 168 ~ 124 fps
ultra 1920x1080
100%
GeForce RTX 2080 Super (Desktop):
86 100 ~ 93 fps
138%
Radeon RX 7900 GRE:
113 143 ~ 128 fps
120%
Titan RTX:
72 76 76 81 88 92 94 95 98 101 101 108 109 116 117 123 123 124 126 126 129 131 132 135 136 140 145 151 ~ 112 fps
QHD 2560x1440
100%
GeForce RTX 2080 Super (Desktop):
83 96 ~ 90 fps
142%
Radeon RX 7900 GRE:
113 142 ~ 128 fps
119%
Titan RTX:
71 73 75 81 85 87 95 97 97 97 99 103 103 113 115 115 116 117 120 121 121 122 124 126 128 129 133 135 ~ 107 fps
4K 3840x2160
100%
GeForce RTX 2080 Super (Desktop):
62 64 ~ 63 fps
173%
Radeon RX 7900 GRE:
103 115 ~ 109 fps
127%
Titan RTX:
68 69 72 74 75 76 78 79 79 80 81 81 81 82 82 82 82 83 83 83 83 84 84 84 84 84 85 85 ~ 80 fps
low 1280x720
100%
GeForce RTX 2080 Super (Desktop):
125  fps
225%
Radeon RX 7900 GRE:
228 333 ~ 281 fps
153%
Titan RTX:
1 97.1 119 120 131 151 156 159 159 169 177 180.9 192 192 210 210 212 220 227 228 232 236 239 239 241 251 291 304 ~ 191 fps
med. 1920x1080
100%
GeForce RTX 2080 Super (Desktop):
109  fps
211%
Radeon RX 7900 GRE:
218 241 ~ 230 fps
137%
Titan RTX:
1 90.4 106 107 113 129 134 135 138 142 150.2 153 158 161 164 167 172 172 172 172 173 173 174 175 176.9 178 186 187 ~ 149 fps
high 1920x1080
100%
GeForce RTX 2080 Super (Desktop):
90  fps
192%
Radeon RX 7900 GRE:
169.2 177.7 ~ 173 fps
139%
Titan RTX:
80.9 94 96 100 113 117 117 120 120.8 121 129 129 132 133 133 133 133 133 133 135 135 136 137 137 137 144.6 146 ~ 125 fps
ultra 1920x1080
100%
GeForce RTX 2080 Super (Desktop):
76 82 ~ 79 fps
171%
Radeon RX 7900 GRE:
132.4 137.3 ~ 135 fps
129%
Titan RTX:
73 80 84 85 97.1 98.8 99.3 100 101 101.8 104 105 106 106 106 106 107 107 107 108 108.9 109 109 110 111 114.7 116 ~ 102 fps
QHD 2560x1440
100%
GeForce RTX 2080 Super (Desktop):
61 65 ~ 63 fps
176%
Radeon RX 7900 GRE:
109.3 112 ~ 111 fps
133%
Titan RTX:
69 77 79 79.9 80 80.2 80.3 81.5 82 84.1 84.6 84.7 84.9 85.4 85.4 85.8 86.1 86.3 86.4 86.7 87.3 87.7 88 88.7 90.5 92.9 ~ 84 fps
4K 3840x2160
100%
GeForce RTX 2080 Super (Desktop):
40 40.4 ~ 40 fps
178%
Radeon RX 7900 GRE:
69.4 71.6 ~ 71 fps
138%
Titan RTX:
51.3 52.3 52.5 52.5 53 53.6 53.7 53.9 54 54.6 54.7 54.7 54.9 54.9 55 55.1 55.2 55.3 56 56 56.3 56.3 56.4 56.6 56.8 57.7 57.9 ~ 55 fps
low 1280x720
100%
GeForce RTX 2080 Super (Desktop):
144  fps
100%
Titan RTX:
144  fps
med. 1920x1080
100%
GeForce RTX 2080 Super (Desktop):
144  fps
100%
Titan RTX:
144  fps
high 1920x1080
100%
GeForce RTX 2080 Super (Desktop):
144  fps
100%
Titan RTX:
144  fps
ultra 1920x1080
100%
GeForce RTX 2080 Super (Desktop):
144  fps
100%
Titan RTX:
144  fps
QHD 2560x1440
100%
GeForce RTX 2080 Super (Desktop):
143  fps
101%
Titan RTX:
143.8  fps
4K 3840x2160
100%
GeForce RTX 2080 Super (Desktop):
89  fps
136%
Titan RTX:
121.4  fps
low 1280x720
100%
GeForce RTX 2080 Super (Desktop):
194  fps
107%
Titan RTX:
208  fps
med. 1920x1080
100%
GeForce RTX 2080 Super (Desktop):
170  fps
118%
Titan RTX:
201  fps
high 1920x1080
100%
GeForce RTX 2080 Super (Desktop):
132  fps
118%
Titan RTX:
156  fps
ultra 1920x1080
100%
GeForce RTX 2080 Super (Desktop):
124  fps
122%
Titan RTX:
151  fps
QHD 2560x1440
100%
GeForce RTX 2080 Super (Desktop):
93  fps
4K 3840x2160
100%
GeForce RTX 2080 Super (Desktop):
53.4  fps
125%
Titan RTX:
67  fps
low 1280x720
100%
GeForce RTX 2080 Super (Desktop):
210  fps
102%
Titan RTX:
214  fps
med. 1920x1080
100%
GeForce RTX 2080 Super (Desktop):
136  fps
107%
Titan RTX:
145  fps
high 1920x1080
100%
GeForce RTX 2080 Super (Desktop):
131  fps
105%
Titan RTX:
138  fps
ultra 1920x1080
100%
GeForce RTX 2080 Super (Desktop):
124  fps
106%
Titan RTX:
131  fps
QHD 2560x1440
100%
GeForce RTX 2080 Super (Desktop):
104  fps
4K 3840x2160
100%
GeForce RTX 2080 Super (Desktop):
55.3  fps
134%
Titan RTX:
74  fps
low 1280x720
100%
GeForce RTX 2080 Super (Desktop):
146  fps
116%
Titan RTX:
169.5  fps
med. 1920x1080
100%
GeForce RTX 2080 Super (Desktop):
122  fps
134%
Titan RTX:
163.2  fps
high 1920x1080
100%
GeForce RTX 2080 Super (Desktop):
110  fps
149%
Titan RTX:
163.8  fps
ultra 1920x1080
100%
GeForce RTX 2080 Super (Desktop):
101 160 ~ 131 fps
122%
Titan RTX:
160.4  fps
QHD 2560x1440
100%
GeForce RTX 2080 Super (Desktop):
85 131 ~ 108 fps
4K 3840x2160
100%
GeForce RTX 2080 Super (Desktop):
55.7 80 ~ 68 fps
143%
Titan RTX:
97.3  fps
low 1280x720
100%
GeForce RTX 2080 Super (Desktop):
191  fps
104%
Titan RTX:
198  fps
med. 1920x1080
100%
GeForce RTX 2080 Super (Desktop):
151  fps
104%
Titan RTX:
157  fps
high 1920x1080
100%
GeForce RTX 2080 Super (Desktop):
122  fps
107%
Titan RTX:
131  fps
ultra 1920x1080
100%
GeForce RTX 2080 Super (Desktop):
117  fps
107%
Titan RTX:
125  fps
QHD 2560x1440
100%
GeForce RTX 2080 Super (Desktop):
122  fps
4K 3840x2160
100%
GeForce RTX 2080 Super (Desktop):
85  fps
132%
Titan RTX:
112  fps
low 1280x720
Titan RTX:
60  fps
med. 1920x1080
Titan RTX:
60  fps
high 1920x1080
Titan RTX:
60  fps
ultra 1920x1080
Titan RTX:
60  fps
4K 3840x2160
Titan RTX:
60  fps
Hitman 2

Hitman 2

2018
low 1280x720
100%
GeForce RTX 2080 Super (Desktop):
92  fps
95%
Titan RTX:
87  fps
med. 1920x1080
100%
GeForce RTX 2080 Super (Desktop):
90  fps
94%
Titan RTX:
85  fps
high 1920x1080
100%
GeForce RTX 2080 Super (Desktop):
81  fps
96%
Titan RTX:
78  fps
ultra 1920x1080
100%
GeForce RTX 2080 Super (Desktop):
79  fps
95%
Titan RTX:
75  fps
QHD 2560x1440
100%
GeForce RTX 2080 Super (Desktop):
79  fps
4K 3840x2160
100%
GeForce RTX 2080 Super (Desktop):
68  fps
110%
Titan RTX:
75  fps
low 1280x720
100%
GeForce RTX 2080 Super (Desktop):
228  fps
99%
Titan RTX:
225  fps
med. 1920x1080
100%
GeForce RTX 2080 Super (Desktop):
194  fps
108%
Titan RTX:
209  fps
high 1920x1080
100%
GeForce RTX 2080 Super (Desktop):
191  fps
107%
Titan RTX:
205  fps
ultra 1920x1080
100%
GeForce RTX 2080 Super (Desktop):
173  fps
116%
Titan RTX:
200  fps
QHD 2560x1440
100%
GeForce RTX 2080 Super (Desktop):
134  fps
4K 3840x2160
100%
GeForce RTX 2080 Super (Desktop):
62  fps
142%
Titan RTX:
88  fps
low 1280x720
100%
GeForce RTX 2080 Super (Desktop):
108  fps
106%
Titan RTX:
114  fps
med. 1920x1080
100%
GeForce RTX 2080 Super (Desktop):
99  fps
105%
Titan RTX:
104  fps
high 1920x1080
100%
GeForce RTX 2080 Super (Desktop):
87  fps
109%
Titan RTX:
95  fps
ultra 1920x1080
100%
GeForce RTX 2080 Super (Desktop):
68  fps
116%
Titan RTX:
79  fps
QHD 2560x1440
100%
GeForce RTX 2080 Super (Desktop):
58  fps
4K 3840x2160
100%
GeForce RTX 2080 Super (Desktop):
41  fps
127%
Titan RTX:
52  fps
low 1280x720
100%
GeForce RTX 2080 Super (Desktop):
168  fps
128%
Titan RTX:
150 157 173 181 190 194 206 209 210 222 232 236 246 249 251 263 293 ~ 215 fps
med. 1920x1080
100%
GeForce RTX 2080 Super (Desktop):
143  fps
131%
Titan RTX:
132 139 153 160 167 175 185 185 187 200 204 209 218 218 218 221 227 ~ 188 fps
high 1920x1080
100%
GeForce RTX 2080 Super (Desktop):
142  fps
131%
Titan RTX:
131 135 152 158 163 173 184 184 186 200 204 207 212 216 216 216 218 ~ 186 fps
ultra 1920x1080
100%
GeForce RTX 2080 Super (Desktop):
133  fps
128%
Titan RTX:
129 132 134 151 158 164 173 173 175 178 178 185 187 189 192 193 196 ~ 170 fps
QHD 2560x1440
100%
GeForce RTX 2080 Super (Desktop):
117  fps
132%
Titan RTX:
127 132 144 150 153 154 154 157 157 160 162 162 164 164 165 171 ~ 155 fps
4K 3840x2160
100%
GeForce RTX 2080 Super (Desktop):
81  fps
140%
Titan RTX:
90 110 110 111 111 112 112 112 114 114 115 117 117 117 118 118 121 ~ 113 fps
FIFA 19

FIFA 19

2018
low 1280x720
100%
GeForce RTX 2080 Super (Desktop):
271  fps
106%
Titan RTX:
286  fps
med. 1920x1080
100%
GeForce RTX 2080 Super (Desktop):
266  fps
106%
Titan RTX:
281  fps
high 1920x1080
100%
GeForce RTX 2080 Super (Desktop):
258  fps
98%
Titan RTX:
254  fps
ultra 1920x1080
100%
GeForce RTX 2080 Super (Desktop):
253  fps
99%
Titan RTX:
251  fps
QHD 2560x1440
100%
GeForce RTX 2080 Super (Desktop):
249  fps
4K 3840x2160
100%
GeForce RTX 2080 Super (Desktop):
197  fps
108%
Titan RTX:
213  fps
low 1280x720
100%
GeForce RTX 2080 Super (Desktop):
125  fps
245%
Radeon RX 7900 GRE:
237 375 ~ 306 fps
154%
Titan RTX:
115 116 126 135 139 148 154 156 157 172 178 188 195 203 204 217 221 224 225 225.1 230 231 314 350 ~ 193 fps
med. 1920x1080
100%
GeForce RTX 2080 Super (Desktop):
116  fps
213%
Radeon RX 7900 GRE:
206 288 ~ 247 fps
141%
Titan RTX:
107 109 109 122 123 131 142 145 145 160 161 171 176 180 183 184.2 185 186 192 193 195 202 216 218 ~ 164 fps
high 1920x1080
100%
GeForce RTX 2080 Super (Desktop):
115  fps
208%
Radeon RX 7900 GRE:
205 273 ~ 239 fps
137%
Titan RTX:
107 108 109 121 123 129 138 142 143 156 156 168 172 173 177 177.9 178 178 183 183 187 189 195.8 197 ~ 158 fps
ultra 1920x1080
100%
GeForce RTX 2080 Super (Desktop):
110 118 ~ 114 fps
190%
Radeon RX 7900 GRE:
192.9 241 ~ 217 fps
131%
Titan RTX:
106 106 107 116 120 127 133 137 138 149 150 158 163 165 165 166 166.1 168 169 170 176 176 176.9 178.8 ~ 149 fps
QHD 2560x1440
100%
GeForce RTX 2080 Super (Desktop):
91 92 ~ 92 fps
178%
Radeon RX 7900 GRE:
158.3 169.6 ~ 164 fps
128%
Titan RTX:
98 99 99 108 108 112 115 118 120 120.1 121 121 122 122 122 124 124 124 124.5 126.1 127 127 128 ~ 118 fps
4K 3840x2160
100%
GeForce RTX 2080 Super (Desktop):
49 49 ~ 49 fps
178%
Radeon RX 7900 GRE:
85 88 ~ 87 fps
137%
Titan RTX:
59 63 65 65 65 65 66 66 66 66.3 66.3 66.4 66.5 66.8 67 68.2 68.5 69 69.3 69.9 70.1 70.2 70.4 71.1 ~ 67 fps
Strange Brigade

Strange Brigade

2018
low 1280x720
100%
GeForce RTX 2080 Super (Desktop):
445  fps
160%
Radeon RX 7900 GRE:
664 755 ~ 710 fps
111%
Titan RTX:
283 289 300 338 376 435 438 457 473 489 540 593 604 607 620 643 662 711 ~ 492 fps
med. 1920x1080
100%
GeForce RTX 2080 Super (Desktop):
277  fps
176%
Radeon RX 7900 GRE:
475 498 ~ 487 fps
119%
Titan RTX:
231 239 257 291 316 332 336 338 350 351 352 352 352 354 355 370 371 389 ~ 330 fps
high 1920x1080
100%
GeForce RTX 2080 Super (Desktop):
225  fps
179%
Radeon RX 7900 GRE:
397 409 ~ 403 fps
125%
Titan RTX:
227 231 252 264 274 275 284 284 286 286 287 287 288 301 302 306 308 317 ~ 281 fps
ultra 1920x1080
100%
GeForce RTX 2080 Super (Desktop):
189  fps
187%
Radeon RX 7900 GRE:
345 361 ~ 353 fps
129%
Titan RTX:
211 212 229 231 234 235 240 241 242 242 243 243 244 262 263 266 266 274 ~ 243 fps
QHD 2560x1440
100%
GeForce RTX 2080 Super (Desktop):
141  fps
179%
Radeon RX 7900 GRE:
250 254 ~ 252 fps
130%
Titan RTX:
169 170 176 178 178 179 180 181 183 183 183 184 184 194 196 197 197 201 ~ 184 fps
4K 3840x2160
100%
GeForce RTX 2080 Super (Desktop):
82  fps
160%
Radeon RX 7900 GRE:
130.2 132.1 ~ 131 fps
133%
Titan RTX:
101 103 103 106 107 107 107 107 108 110 110 110 110 113.2 114 115 115 115 ~ 109 fps
F1 2018

F1 2018

2018
low 1280x720
100%
GeForce RTX 2080 Super (Desktop):
219  fps
107%
Titan RTX:
234  fps
med. 1920x1080
100%
GeForce RTX 2080 Super (Desktop):
198  fps
104%
Titan RTX:
206  fps
high 1920x1080
100%
GeForce RTX 2080 Super (Desktop):
151  fps
106%
Titan RTX:
160  fps
ultra 1920x1080
100%
GeForce RTX 2080 Super (Desktop):
133  fps
108%
Titan RTX:
143  fps
QHD 2560x1440
100%
GeForce RTX 2080 Super (Desktop):
120  fps
4K 3840x2160
100%
GeForce RTX 2080 Super (Desktop):
74  fps
134%
Titan RTX:
99  fps
low 1280x720
100%
GeForce RTX 2080 Super (Desktop):
141  fps
105%
Titan RTX:
148  fps
med. 1920x1080
100%
GeForce RTX 2080 Super (Desktop):
135  fps
105%
Titan RTX:
142  fps
high 1920x1080
100%
GeForce RTX 2080 Super (Desktop):
134  fps
105%
Titan RTX:
141  fps
ultra 1920x1080
100%
GeForce RTX 2080 Super (Desktop):
114  fps
119%
Titan RTX:
136  fps
QHD 2560x1440
100%
GeForce RTX 2080 Super (Desktop):
76  fps
4K 3840x2160
100%
GeForce RTX 2080 Super (Desktop):
37.6  fps
144%
Titan RTX:
54  fps
low 1280x720
100%
GeForce RTX 2080 Super (Desktop):
60  fps
100%
Titan RTX:
60  fps
med. 1920x1080
100%
GeForce RTX 2080 Super (Desktop):
60  fps
100%
Titan RTX:
60  fps
high 1920x1080
100%
GeForce RTX 2080 Super (Desktop):
60  fps
100%
Titan RTX:
60  fps
ultra 1920x1080
100%
GeForce RTX 2080 Super (Desktop):
60  fps
100%
Titan RTX:
60  fps
QHD 2560x1440
100%
GeForce RTX 2080 Super (Desktop):
60  fps
4K 3840x2160
100%
GeForce RTX 2080 Super (Desktop):
60  fps
100%
Titan RTX:
60  fps
Far Cry 5

Far Cry 5

2018
low 1280x720
100%
GeForce RTX 2080 Super (Desktop):
120  fps
163%
Radeon RX 7900 GRE:
170 222 ~ 196 fps
148%
Titan RTX:
102 114 117 129 137 138 141 148 151 154 157 166 183 184 193 193 199 200 200 201 204 207 212 212 213 220 230 249 ~ 177 fps
med. 1920x1080
100%
GeForce RTX 2080 Super (Desktop):
109  fps
160%
Radeon RX 7900 GRE:
152 196 ~ 174 fps
142%
Titan RTX:
98 100 103 115 122 124 126 129 133 135 139 148 157 160 169 171 171 174 174 177 177 177 183 184 187 191 201 207 ~ 155 fps
high 1920x1080
100%
GeForce RTX 2080 Super (Desktop):
105  fps
160%
Radeon RX 7900 GRE:
147 188 ~ 168 fps
140%
Titan RTX:
93 96 98 109 116 118 120 122 128 128 132 140 147 152 159 161 165 166 166 167 168 169 173 175 177 178 190 195 ~ 147 fps
ultra 1920x1080
100%
GeForce RTX 2080 Super (Desktop):
98 114 ~ 106 fps
146%
Radeon RX 7900 GRE:
136 173 ~ 155 fps
130%
Titan RTX:
89 90 92 103 109 112 113 115 120 120 126 131 136 143 149 152 153 154 154 157 158 158 161 164 165 167 180 184 ~ 138 fps
QHD 2560x1440
100%
GeForce RTX 2080 Super (Desktop):
94 105 ~ 100 fps
154%
Radeon RX 7900 GRE:
135 173 ~ 154 fps
125%
Titan RTX:
87 88 90 104 107 110 110 113 116 120 121 127 130 134 135 136 136 137 137 138 140 140 141 145 145 146 148 ~ 125 fps
4K 3840x2160
100%
GeForce RTX 2080 Super (Desktop):
61 61 ~ 61 fps
175%
Radeon RX 7900 GRE:
106 108 ~ 107 fps
130%
Titan RTX:
72 75 76 76 77 78 78 78 78 78 78 78 79 80 80 80 80 80 80 81 81 81 82 82 83 83 83 84 ~ 79 fps
World of Tanks enCore

World of Tanks enCore

2018
ultra 1920x1080
100%
GeForce RTX 2080 Super (Desktop):
222  fps
QHD 2560x1440
100%
GeForce RTX 2080 Super (Desktop):
160  fps
4K 3840x2160
100%
GeForce RTX 2080 Super (Desktop):
78  fps
low 1280x720
100%
GeForce RTX 2080 Super (Desktop):
101 150.2 ~ 126 fps
127%
Radeon RX 7900 GRE:
139.2 180.2 ~ 160 fps
113%
Titan RTX:
70.9 71.8 91.1 94.8 95 98.2 107 113 123 125 125 127 131 133 139 141 148 149 152 157 168 170 172 172 177 178 186 200 227 230 ~ 142 fps
med. 1920x1080
100%
GeForce RTX 2080 Super (Desktop):
91 136.2 ~ 114 fps
115%
Radeon RX 7900 GRE:
115.1 146 ~ 131 fps
112%
Titan RTX:
67.2 68.6 83.6 86.1 87.8 90.6 96.8 102 108 110 113 113 118 118 125 127 130 133 137 138 152 153 153 156 158 158 164 176 198.9 204 ~ 128 fps
high 1920x1080
100%
GeForce RTX 2080 Super (Desktop):
76 111.2 ~ 94 fps
106%
Radeon RX 7900 GRE:
88.2 112.7 ~ 100 fps
111%
Titan RTX:
58.5 63.2 69.9 71.7 75.6 76.3 83.3 84.6 89.3 91.2 92.8 93.2 96 96.8 102 105 106 109 111 112 117 119 123 125 128 128 130 137 156.8 157.5 ~ 104 fps
4K 3840x2160
100%
GeForce RTX 2080 Super (Desktop):
66 73 ~ 70 fps
109%
Radeon RX 7900 GRE:
68 83.4 ~ 76 fps
129%
Titan RTX:
52.9 56.5 61 62.2 65.9 67.7 73.9 74.4 77.1 79.1 80.2 80.6 82.8 83.7 88.9 90.9 91.9 94 94.9 99.3 101 104 105 109 109 110 111 117 130.4 131.4 ~ 90 fps
low 1280x720
100%
GeForce RTX 2080 Super (Desktop):
160  fps
88%
Titan RTX:
140  fps
med. 1920x1080
100%
GeForce RTX 2080 Super (Desktop):
141  fps
90%
Titan RTX:
127  fps
high 1920x1080
100%
GeForce RTX 2080 Super (Desktop):
112  fps
90%
Titan RTX:
101  fps
ultra 1920x1080
100%
GeForce RTX 2080 Super (Desktop):
79  fps
100%
Titan RTX:
79  fps
QHD 2560x1440
100%
GeForce RTX 2080 Super (Desktop):
70  fps
4K 3840x2160
100%
GeForce RTX 2080 Super (Desktop):
39.5  fps
124%
Titan RTX:
49  fps
low 1280x720
100%
GeForce RTX 2080 Super (Desktop):
159  fps
145%
Radeon RX 7900 GRE:
226 235 ~ 231 fps
120%
Titan RTX:
109 117 128 137 142 145 155 158 177 179 185 187 189 189 196 201 201 213 216 218 219 219 221 222 225 225 225 225 227 235 235 ~ 191 fps
med. 1920x1080
100%
GeForce RTX 2080 Super (Desktop):
130  fps
178%
Radeon RX 7900 GRE:
225 237 ~ 231 fps
128%
Titan RTX:
101 109 120 131 134 137 144 148 149 153 158 161 162 166 169 172 176 176 176 179 182 182 183 184 186 187 192 193 195 195 202 202 ~ 166 fps
high 1920x1080
100%
GeForce RTX 2080 Super (Desktop):
97 104 ~ 101 fps
167%
Radeon RX 7900 GRE:
162.6 174.5 ~ 169 fps
126%
Titan RTX:
84.7 87.9 97 99.3 99.7 109 112 117 118 118 120 120 122 124 127 133 134 136 138 139 140 140 141 141 141 142 143 144 144 148 150.4 150.5 ~ 127 fps
QHD 2560x1440
Radeon RX 7900 GRE:
126.3 133 ~ 130 fps
Titan RTX:
80.6 82.7 101 103 103 104 104 105 105 105 106 107 107 107 108 108 109 111 111.2 113.3 ~ 104 fps
4K 3840x2160
100%
GeForce RTX 2080 Super (Desktop):
46.4 47.2 ~ 47 fps
160%
Radeon RX 7900 GRE:
74.2 75.5 ~ 75 fps
132%
Titan RTX:
57.4 57.8 58 59 59.1 59.3 59.3 59.8 59.9 59.9 59.9 61.2 61.6 62.3 62.9 63.1 63.2 63.2 63.3 63.4 63.6 63.6 64.1 64.5 64.6 64.9 65.2 65.4 65.5 65.5 65.5 66.7 ~ 62 fps
Fortnite

Fortnite

2018
low 1280x720
100%
GeForce RTX 2080 Super (Desktop):
297  fps
92%
Titan RTX:
274  fps
med. 1920x1080
100%
GeForce RTX 2080 Super (Desktop):
253  fps
67%
Titan RTX:
169  fps
high 1920x1080
100%
GeForce RTX 2080 Super (Desktop):
185  fps
95%
Titan RTX:
176  fps
ultra 1920x1080
100%
GeForce RTX 2080 Super (Desktop):
180  fps
74%
Titan RTX:
134  fps
QHD 2560x1440
100%
GeForce RTX 2080 Super (Desktop):
127  fps
4K 3840x2160
100%
GeForce RTX 2080 Super (Desktop):
64  fps
116%
Titan RTX:
74  fps
low 1280x720
Titan RTX:
138  fps
med. 1920x1080
Titan RTX:
128  fps
high 1920x1080
Titan RTX:
123  fps
ultra 1920x1080
Titan RTX:
121  fps
4K 3840x2160
Titan RTX:
90  fps
low 1280x720
100%
GeForce RTX 2080 Super (Desktop):
235  fps
109%
Titan RTX:
255  fps
med. 1920x1080
100%
GeForce RTX 2080 Super (Desktop):
234  fps
109%
Titan RTX:
255  fps
high 1920x1080
100%
GeForce RTX 2080 Super (Desktop):
173  fps
107%
Titan RTX:
185  fps
ultra 1920x1080
100%
GeForce RTX 2080 Super (Desktop):
154  fps
116%
Titan RTX:
179  fps
QHD 2560x1440
100%
GeForce RTX 2080 Super (Desktop):
137  fps
4K 3840x2160
100%
GeForce RTX 2080 Super (Desktop):
88  fps
144%
Titan RTX:
127  fps
low 1280x720
100%
GeForce RTX 2080 Super (Desktop):
108  fps
106%
Titan RTX:
115  fps
med. 1920x1080
100%
GeForce RTX 2080 Super (Desktop):
97  fps
107%
Titan RTX:
104  fps
high 1920x1080
100%
GeForce RTX 2080 Super (Desktop):
94  fps
109%
Titan RTX:
102  fps
ultra 1920x1080
100%
GeForce RTX 2080 Super (Desktop):
82  fps
106%
Titan RTX:
87  fps
QHD 2560x1440
100%
GeForce RTX 2080 Super (Desktop):
76  fps
4K 3840x2160
100%
GeForce RTX 2080 Super (Desktop):
53  fps
123%
Titan RTX:
65  fps
Destiny 2

Destiny 2

2017
low 1280x720
100%
GeForce RTX 2080 Super (Desktop):
151  fps
99%
Titan RTX:
149  fps
med. 1920x1080
100%
GeForce RTX 2080 Super (Desktop):
150  fps
103%
Titan RTX:
154  fps
high 1920x1080
100%
GeForce RTX 2080 Super (Desktop):
149  fps
101%
Titan RTX:
150  fps
ultra 1920x1080
100%
GeForce RTX 2080 Super (Desktop):
148  fps
104%
Titan RTX:
154  fps
QHD 2560x1440
100%
GeForce RTX 2080 Super (Desktop):
133  fps
4K 3840x2160
100%
GeForce RTX 2080 Super (Desktop):
74  fps
127%
Titan RTX:
94  fps
ultra 1920x1080
100%
GeForce RTX 2080 Super (Desktop):
131  fps
4K 3840x2160
100%
GeForce RTX 2080 Super (Desktop):
60  fps
FIFA 18

FIFA 18

2017
low 1280x720
Titan RTX:
361  fps
med. 1920x1080
Titan RTX:
356  fps
high 1920x1080
Titan RTX:
327  fps
ultra 1920x1080
Titan RTX:
325  fps
4K 3840x2160
Titan RTX:
302  fps
F1 2017

F1 2017

2017
low 1280x720
Titan RTX:
232  fps
med. 1920x1080
Titan RTX:
188  fps
high 1920x1080
Titan RTX:
156  fps
ultra 1920x1080
Titan RTX:
141  fps
4K 3840x2160
Titan RTX:
101  fps
low 1280x720
100%
GeForce RTX 2080 Super (Desktop):
202  fps
102%
Titan RTX:
206  fps
med. 1920x1080
100%
GeForce RTX 2080 Super (Desktop):
173  fps
117%
Titan RTX:
202  fps
high 1920x1080
100%
GeForce RTX 2080 Super (Desktop):
168  fps
97%
Titan RTX:
163  fps
ultra 1920x1080
100%
GeForce RTX 2080 Super (Desktop):
159  fps
86%
Titan RTX:
136  fps
4K 3840x2160
100%
GeForce RTX 2080 Super (Desktop):
68  fps
141%
Titan RTX:
96  fps
Dirt 4

Dirt 4

2017
low 1280x720
100%
GeForce RTX 2080 Super (Desktop):
289  fps
112%
Titan RTX:
323  fps
med. 1920x1080
100%
GeForce RTX 2080 Super (Desktop):
226  fps
112%
Titan RTX:
254  fps
high 1920x1080
100%
GeForce RTX 2080 Super (Desktop):
197  fps
112%
Titan RTX:
220  fps
ultra 1920x1080
100%
GeForce RTX 2080 Super (Desktop):
161  fps
119%
Titan RTX:
192  fps
4K 3840x2160
100%
GeForce RTX 2080 Super (Desktop):
102  fps
122%
Titan RTX:
124  fps
low 1280x720
100%
GeForce RTX 2080 Super (Desktop):
249  fps
100%
Titan RTX:
248  fps
med. 1920x1080
100%
GeForce RTX 2080 Super (Desktop):
247  fps
100%
Titan RTX:
248  fps
high 1920x1080
100%
GeForce RTX 2080 Super (Desktop):
248  fps
100%
Titan RTX:
248  fps
4K 3840x2160
100%
GeForce RTX 2080 Super (Desktop):
171  fps
115%
Titan RTX:
197  fps
low 1280x720
100%
GeForce RTX 2080 Super (Desktop):
151.9  fps
92%
Titan RTX:
140  fps
med. 1920x1080
100%
GeForce RTX 2080 Super (Desktop):
122  fps
93%
Titan RTX:
114  fps
high 1920x1080
100%
GeForce RTX 2080 Super (Desktop):
118.7  fps
94%
Titan RTX:
112  fps
ultra 1920x1080
100%
GeForce RTX 2080 Super (Desktop):
74.8  fps
115%
Titan RTX:
86  fps
4K 3840x2160
100%
GeForce RTX 2080 Super (Desktop):
54.9  fps
122%
Titan RTX:
67  fps
For Honor

For Honor

2017
low 1280x720
100%
GeForce RTX 2080 Super (Desktop):
292.2  fps
92%
Titan RTX:
268  fps
med. 1920x1080
100%
GeForce RTX 2080 Super (Desktop):
222.8  fps
110%
Titan RTX:
245  fps
high 1920x1080
100%
GeForce RTX 2080 Super (Desktop):
214.8  fps
113%
Titan RTX:
243  fps
ultra 1920x1080
100%
GeForce RTX 2080 Super (Desktop):
169.8  fps
125%
Titan RTX:
213  fps
4K 3840x2160
100%
GeForce RTX 2080 Super (Desktop):
78.8  fps
128%
Titan RTX:
101  fps
low 1280x720
100%
GeForce RTX 2080 Super (Desktop):
121  fps
117%
Titan RTX:
141  fps
med. 1366x768
100%
GeForce RTX 2080 Super (Desktop):
111  fps
113%
Titan RTX:
125  fps
high 1920x1080
100%
GeForce RTX 2080 Super (Desktop):
105  fps
107%
Titan RTX:
112  fps
ultra 1920x1080
100%
GeForce RTX 2080 Super (Desktop):
87  fps
115%
Titan RTX:
100  fps
4K 3840x2160
100%
GeForce RTX 2080 Super (Desktop):
56.6  fps
124%
Titan RTX:
70  fps
low 1280x720
100%
GeForce RTX 2080 Super (Desktop):
119  fps
101%
Titan RTX:
120  fps
med. 1366x768
100%
GeForce RTX 2080 Super (Desktop):
118  fps
101%
Titan RTX:
119  fps
high 1920x1080
100%
GeForce RTX 2080 Super (Desktop):
116  fps
103%
Titan RTX:
119  fps
ultra 1920x1080
100%
GeForce RTX 2080 Super (Desktop):
112  fps
103%
Titan RTX:
115  fps
4K 3840x2160
100%
GeForce RTX 2080 Super (Desktop):
85  fps
122%
Titan RTX:
104  fps
low 1280x720
100%
GeForce RTX 2080 Super (Desktop):
193  fps
100%
Titan RTX:
193.7  fps
med. 1366x768
100%
GeForce RTX 2080 Super (Desktop):
178  fps
101%
Titan RTX:
179.9  fps
high 1920x1080
100%
GeForce RTX 2080 Super (Desktop):
165  fps
101%
Titan RTX:
166.2  fps
ultra 1920x1080
100%
GeForce RTX 2080 Super (Desktop):
152  fps
101%
Titan RTX:
154.2  fps
4K 3840x2160
100%
GeForce RTX 2080 Super (Desktop):
93  fps
120%
Titan RTX:
111.8  fps
FIFA 17

FIFA 17

2016
low 1280x720
Titan RTX:
420  fps
med. 1366x768
Titan RTX:
411  fps
high 1920x1080
Titan RTX:
390  fps
ultra 1920x1080
Titan RTX:
386  fps
4K 3840x2160
Titan RTX:
355  fps
low 1280x720
100%
GeForce RTX 2080 Super (Desktop):
146.5  fps
108%
Titan RTX:
157.8  fps
med. 1366x768
100%
GeForce RTX 2080 Super (Desktop):
138.7  fps
107%
Titan RTX:
148.1  fps
high 1920x1080
100%
GeForce RTX 2080 Super (Desktop):
120.5  fps
107%
Titan RTX:
128.7  fps
ultra 1920x1080
100%
GeForce RTX 2080 Super (Desktop):
82 89.3 ~ 86 fps
140%
Titan RTX:
120.7  fps
4K 3840x2160
100%
GeForce RTX 2080 Super (Desktop):
53.4 57.3 ~ 55 fps
130%
Titan RTX:
71.6  fps
Overwatch

Overwatch

2016
low 1280x720
100%
GeForce RTX 2080 Super (Desktop):
300  fps
100%
Titan RTX:
300  fps
med. 1366x768
100%
GeForce RTX 2080 Super (Desktop):
300  fps
100%
Titan RTX:
300  fps
high 1920x1080
100%
GeForce RTX 2080 Super (Desktop):
300  fps
100%
Titan RTX:
300  fps
ultra 1920x1080
100%
GeForce RTX 2080 Super (Desktop):
267  fps
112%
Titan RTX:
298  fps
4K 3840x2160
100%
GeForce RTX 2080 Super (Desktop):
152  fps
176%
Titan RTX:
267  fps
Doom

Doom

2016
low 1280x720
100%
GeForce RTX 2080 Super (Desktop):
178  fps
83%
Titan RTX:
147  fps
med. 1366x768
100%
GeForce RTX 2080 Super (Desktop):
144  fps
97%
Titan RTX:
139  fps
high 1920x1080
100%
GeForce RTX 2080 Super (Desktop):
141  fps
99%
Titan RTX:
139  fps
ultra 1920x1080
100%
GeForce RTX 2080 Super (Desktop):
134  fps
107%
Titan RTX:
144  fps
4K 3840x2160
100%
GeForce RTX 2080 Super (Desktop):
114  fps
123%
Titan RTX:
140  fps
low 1280x720
100%
GeForce RTX 2080 Super (Desktop):
189  fps
147%
Titan RTX:
277  fps
med. 1366x768
100%
GeForce RTX 2080 Super (Desktop):
174.5  fps
138%
Titan RTX:
241  fps
high 1920x1080
100%
GeForce RTX 2080 Super (Desktop):
149.1  fps
126%
Titan RTX:
188  fps
ultra 1920x1080
100%
GeForce RTX 2080 Super (Desktop):
132.1  fps
123%
Titan RTX:
163  fps
4K 3840x2160
100%
GeForce RTX 2080 Super (Desktop):
69.7  fps
131%
Titan RTX:
91  fps
low 1280x720
100%
GeForce RTX 2080 Super (Desktop):
119  fps
97%
Titan RTX:
116  fps
med. 1920x1080
100%
GeForce RTX 2080 Super (Desktop):
106  fps
98%
Titan RTX:
104  fps
high 1920x1080
100%
GeForce RTX 2080 Super (Desktop):
97  fps
98%
Titan RTX:
95  fps
ultra 1920x1080
100%
GeForce RTX 2080 Super (Desktop):
90  fps
98%
Titan RTX:
88  fps
4K 3840x2160
100%
GeForce RTX 2080 Super (Desktop):
74  fps
119%
Titan RTX:
88  fps
low 1024x768
100%
GeForce RTX 2080 Super (Desktop):
252  fps
108%
Titan RTX:
272  fps
med. 1366x768
100%
GeForce RTX 2080 Super (Desktop):
183  fps
107%
Titan RTX:
196  fps
high 1920x1080
100%
GeForce RTX 2080 Super (Desktop):
176  fps
107%
Titan RTX:
189  fps
ultra 1920x1080
100%
GeForce RTX 2080 Super (Desktop):
165  fps
114%
Titan RTX:
188  fps
4K 3840x2160
100%
GeForce RTX 2080 Super (Desktop):
79  fps
125%
Titan RTX:
99  fps
low 1024x768
100%
GeForce RTX 2080 Super (Desktop):
296.8  fps
110%
Titan RTX:
327  fps
med. 1366x768
100%
GeForce RTX 2080 Super (Desktop):
255.6  fps
110%
Titan RTX:
281  fps
high 1920x1080
100%
GeForce RTX 2080 Super (Desktop):
245.1  fps
112%
Titan RTX:
275  fps
ultra 1920x1080
100%
GeForce RTX 2080 Super (Desktop):
236.1  fps
116%
Titan RTX:
274  fps
4K 3840x2160
100%
GeForce RTX 2080 Super (Desktop):
150  fps
118%
Titan RTX:
177  fps
low 1280x720
100%
GeForce RTX 2080 Super (Desktop):
135.2 176.3 ~ 156 fps
164%
Radeon RX 7900 GRE:
214 297 ~ 256 fps
115%
Titan RTX:
112.8 117.2 118.3 119.9 127.4 130.9 133.2 148.5 153.8 157.3 160.5 162.1 163.3 168.8 169.8 171.6 178.1 183 183.7 184.8 186.9 195.1 198.8 203.5 214.5 216.8 228.9 232.6 242.5 290.9 303.6 ~ 179 fps
med. 1366x768
100%
GeForce RTX 2080 Super (Desktop):
124.6 158.8 ~ 142 fps
145%
Radeon RX 7900 GRE:
176.2 236 ~ 206 fps
116%
Titan RTX:
101.2 107.7 109 111.7 112.9 120 121.3 132.8 137.3 144.7 145.3 147.2 151.6 155.6 156.4 160.6 167.8 169.9 170.7 180.2 181 187.6 188 192.3 198 200.7 208.7 208.7 213.8 258.7 273.2 ~ 165 fps
high 1920x1080
100%
GeForce RTX 2080 Super (Desktop):
123.4 153.3 ~ 138 fps
146%
Radeon RX 7900 GRE:
184.9 218 ~ 201 fps
115%
Titan RTX:
97.8 100.3 103.3 107.9 108.8 115.8 117.7 128.9 132 139.6 141.7 144.2 151 151.2 151.2 155.2 163 164.7 164.8 173.2 174.2 181.1 183 189.8 191 193.3 199.4 201.7 204 241.2 254.8 ~ 159 fps
ultra 1920x1080
100%
GeForce RTX 2080 Super (Desktop):
111.8 145.3 ~ 129 fps
142%
Radeon RX 7900 GRE:
149.6 217 ~ 183 fps
116%
Titan RTX:
92.1 93.1 98 103.8 104.1 110.8 111.8 124.4 124.9 130.8 134.5 136 139.7 144.1 146.8 148.1 154.5 157.3 162.9 165.3 172.2 172.2 174.9 179.2 180 180.3 180.6 186.8 189.7 222.8 237.6 ~ 150 fps
4K 3840x2160
100%
GeForce RTX 2080 Super (Desktop):
107.9 124.9 ~ 116 fps
126%
Radeon RX 7900 GRE:
136.8 154.4 ~ 146 fps
124%
Titan RTX:
90.4 96.7 100.4 101.9 108.2 110.5 118.9 120.7 122.1 131.5 132.7 138.1 139.1 139.2 143.7 146.1 151.4 153.1 158.9 159.1 161.6 161.8 165.8 167.4 168.3 172.1 174.1 175.6 178.9 187.4 194.6 ~ 144 fps
low 1024x768
100%
GeForce RTX 2080 Super (Desktop):
295  fps
217%
Radeon RX 7900 GRE:
484.7 794.3 ~ 640 fps
155%
Titan RTX:
252 279 280 300 329 338 344 354 388 388 408 412 413 426 466 468 500 514 518 558 560 570 589 594 602 617 650 710 ~ 458 fps
med. 1366x768
100%
GeForce RTX 2080 Super (Desktop):
259  fps
188%
Radeon RX 7900 GRE:
398.3 578 ~ 488 fps
143%
Titan RTX:
233 252 252 270 297 302 317 330 348 357 358 362 362 371 396 400 403 406 413 420 422 431 436 437 438 446 447 471 ~ 371 fps
high 1920x1080
100%
GeForce RTX 2080 Super (Desktop):
195  fps
196%
Radeon RX 7900 GRE:
374.8 390 ~ 382 fps
131%
Titan RTX:
190 205 215 220 221 229 241 242 249 250 252 253 258 265 268 270 270 271 271 272 274 275 276 276 277 277 283 293 ~ 255 fps
ultra 1920x1080
100%
GeForce RTX 2080 Super (Desktop):
109  fps
192%
Radeon RX 7900 GRE:
207.3 210.2 ~ 209 fps
127%
Titan RTX:
124 125 125 126 128 128 130 133 138 139 139 139 139 139 139.9 140 140 141 141 141 142 142 143 144 144 147 149 150 ~ 138 fps
QHD 2560x1440
Radeon RX 7900 GRE:
153.9 157.4 ~ 156 fps
4K 3840x2160
100%
GeForce RTX 2080 Super (Desktop):
79  fps
158%
Radeon RX 7900 GRE:
124.7 124.8 ~ 125 fps
129%
Titan RTX:
94 95.8 98 98.1 100 101 101 101 102 102 102 102 102 103 103 103 103 104 104 104 104.1 105 105 105 106 106 107 107.1 ~ 102 fps
GTA V

GTA V

2015
low 1024x768
100%
GeForce RTX 2080 Super (Desktop):
169  fps
111%
Radeon RX 7900 GRE:
186.7 187.9 ~ 187 fps
109%
Titan RTX:
171.1 179 183 184 186 186 187 187 187 187 187 187 187 187.5 ~ 185 fps
med. 1366x768
100%
GeForce RTX 2080 Super (Desktop):
162  fps
115%
Radeon RX 7900 GRE:
184.5 187.4 ~ 186 fps
113%
Titan RTX:
166.9 173 179 180 184 184 185 186 186 186 187 187 187.2 187.5 ~ 183 fps
high 1920x1080
100%
GeForce RTX 2080 Super (Desktop):
141  fps
129%
Radeon RX 7900 GRE:
177.6 186.4 ~ 182 fps
126%
Titan RTX:
146.6 157 170 172 179 181 181 181 182 184 184 185 186.6 187.3 ~ 177 fps
ultra 1920x1080
100%
GeForce RTX 2080 Super (Desktop):
84  fps
174%
Radeon RX 7900 GRE:
120.6 172.2 ~ 146 fps
146%
Titan RTX:
92.4 104 105 117 118 121 123 124 125.1 126 128 135 153.7 156.6 ~ 123 fps
QHD 2560x1440
Radeon RX 7900 GRE:
116.4 142.7 ~ 130 fps
Titan RTX:
87.5 99.5 101 109 112 113 115 115 116 123 133.8 136.4 ~ 113 fps
4K 3840x2160
100%
GeForce RTX 2080 Super (Desktop):
115  fps
131%
Radeon RX 7900 GRE:
149 153.3 ~ 151 fps
117%
Titan RTX:
125 125 127 132 133 134 134 136 138 139 140.2 140.6 140.8 ~ 134 fps
low 1024x768
100%
GeForce RTX 2080 Super (Desktop):
200  fps
100%
Titan RTX:
200  fps
med. 1366x768
100%
GeForce RTX 2080 Super (Desktop):
200  fps
100%
Titan RTX:
200  fps
high 1366x768
100%
GeForce RTX 2080 Super (Desktop):
200  fps
100%
Titan RTX:
200  fps
ultra 1920x1080
100%
GeForce RTX 2080 Super (Desktop):
191  fps
105%
Titan RTX:
200  fps
4K 3840x2160
100%
GeForce RTX 2080 Super (Desktop):
126  fps
126%
Titan RTX:
159  fps
low 1280x720
100%
GeForce RTX 2080 Super (Desktop):
305  fps
102%
Titan RTX:
311.5  fps
med. 1366x768
100%
GeForce RTX 2080 Super (Desktop):
270  fps
106%
Titan RTX:
287.3  fps
high 1366x768
100%
GeForce RTX 2080 Super (Desktop):
252  fps
104%
Titan RTX:
262.2  fps
ultra 1920x1080
100%
GeForce RTX 2080 Super (Desktop):
196  fps
109%
Titan RTX:
212.8  fps

Average Gaming NVIDIA GeForce RTX 2080 Super (Desktop) → 100%

Average Gaming 30-70 fps → 100%

Average Gaming AMD Radeon RX 7900 GRE → 173%

Average Gaming 30-70 fps → 179%

Average Gaming NVIDIA Titan RTX → 117%

Average Gaming 30-70 fps → 124%

NVIDIA GeForce RTX 2080 Super (Desktop)AMD Radeon RX 7900 GRENVIDIA Titan RTX
lowmed.highultraQHD4Klowmed.highultraQHD4Klowmed.highultraQHD4K
F1 25206196162.8
Monster Hunter Wilds53.940.831.2
Black Myth: Wukong62472620997558322515
Cyberpunk 2077135.1111.396.9865524.31661541201107437
Baldur's Gate 3102.369.536.221619116716512367175.8144.7121.8122.283.944.7
Company of Heroes 313110159324288241235189105248.7212.1164.1162.8122.272.2
Returnal785732196189164146113661421341221078150
Hogwarts Legacy58.646.527.61791571311098649166.9145.2116.794.169.137.7
Call of Duty Modern Warfare 2 2022958966401661341061057747
F1 22243249117.565.643.121.34224373671117538365348271895829
Ghostwire Tokyo157.79752.62482392362301878721720320520413870
Cyberpunk 2077 1.688.857.130.7208184158148984578.978.778.678.366.232.8
GRID Legends11697.566.424319920517916913327923920015212887
Elden Ring6048.859.959.959.759.959.959.6
Dying Light 279.356.228.916911093.666.537.1
God of War68.960.540.617917515712610467181155129968054
Halo Infinite10881.247.214412511995.568.8
Forza Horizon 5817049268168153988664
Riders Republic117804922117915214310965
Far Cry 610598.6928782.351.52061821671581368718415113512610262
FIFA 22208
F1 202123121218311492.353.56105674522051599352240333016612573
Hitman 32721971791661156427122221020214582
Cyberpunk 2077 1.01269582.672.149.124.110910393.282.358.430.9
Yakuza Like a Dragon11411311610879.242.511911711611110055.2
Call of Duty Black Ops Cold War18513410583644125423816214487.652.9
Assassin´s Creed Valhalla128947970573613710488806643
Dirt 521713911596.382.554.118712810695.979.557
Watch Dogs Legion11711499.375.457.334.411311297.485.569.943.4
FIFA 21228227211210211205215215204203205203
Star Wars Squadrons448351307286201119440367334315232144
Mafia Definitive Edition152.5130.2118.188.848.5149.8133123.710963.4
Serious Sam 4134.4113.6107.7104.694.267.7138.2108.1106.499.192.471.2
Crysis Remastered24819199.478.948.830.627374.521211590.948.9
Flight Simulator 202087.376.263.147.240.224.9857562514832
Horizon Zero Dawn1581251139575441581421261099054
Death Stranding18916114814610560.3236235234233211118.121819918718213679
F1 202029725422516212777.2528446417294231140420333299216167102
Valorant341301283273262377348336307300
Gears Tactics323.2228.5151118.581.648.7325.9197.7146.9141.2105.356.3
Doom Eternal24222321921716386.8242246239236192105
Hunt Showdown25417014296.646.823519417112461.8
Escape from Tarkov12011811711190.253.712112112011911781.7
Red Dead Redemption 2144126936150.633142133110766341
Star Wars Jedi Fallen Order12212011810759.512712612311974
Need for Speed Heat114108100929056.51241191101009868
Call of Duty Modern Warfare 20192031911631441106522421319017013179
GRID 2019169148141118996422718916714712279
Ghost Recon Breakpoint1581271209065391651431311027950
FIFA 20269267254253252242266263247245245242
Borderlands 3150.3131.9108.29165.535.9209185160138110631781541311128547
Control240124956230.4240240200128612301771379247
F1 20192071911571571318217416314713413498
Total War: Three Kingdoms234.4149.2118.5916332234.7151.3123.8106.175.538.4
Rage 2229157136135914728217515815710654.6
Anno 18009088704239351019776444237
The Division 2182150129106794415714712811310262
Dirt Rally 2.02351861791291006120016616214813283
Anthem105103100958755.51019793929076
Far Cry New Dawn111989593906316514914212812810914912912411210780
Metro Exodus12510990796340281230173135111711911491251028455
Apex Legends14414414414414389144144144144143.8121.4
Just Cause 41941701321249353.420820115615167
Darksiders III21013613112410455.321414513813174
Battlefield V14612211013110868169.5163.2163.8160.497.3
Farming Simulator 1919115112211712285198157131125112
Hitman 29290817979688785787575
Call of Duty Black Ops 42281941911731346222520920520088
Assassin´s Creed Odyssey1089987685841114104957952
Forza Horizon 416814314213311781215188186170155113
FIFA 19271266258253249197286281254251213
Shadow of the Tomb Raider12511611511492493062472392171648719316415814911867
Strange Brigade44527722518914182710487403353252131492330281243184109
F1 20182191981511331207423420616014399
Monster Hunter World1411351341147637.614814214113654
The Crew 26060606060606060606060
Far Cry 51201091051061006119617416815515410717715514713812579
World of Tanks enCore22216078
X-Plane 11.1112611494701601311007614212810490
Kingdom Come: Deliverance160141112797039.51401271017949
Final Fantasy XV Benchmark159130101472312311691307519116612710462
Fortnite2972531851801276427416917613474
Call of Duty WWII23523417315413788255255185179127
Assassin´s Creed Origins10897948276531151041028765
Destiny 21511501491481337414915415015494
Middle-earth: Shadow of War13160
Playerunknown's Battlegrounds (PUBG)2021731681596820620216313696
Dirt 4289226197161102323254220192124
Rocket League249247248171248248248197
Ghost Recon Wildlands151.9122118.774.854.91401141128667
For Honor292.2222.8214.8169.878.8268245243213101
Watch Dogs 21211111058756.614112511210070
Dishonored 211911811611285120119119115104
Battlefield 119317816515293193.7179.9166.2154.2111.8
Deus Ex Mankind Divided146.5138.7120.58655157.8148.1128.7120.771.6
Overwatch300300300267152300300300298267
Doom178144141134114147139139144140
The Division189174.5149.1132.169.727724118816391
Far Cry Primal119106979074116104958888
Rise of the Tomb Raider2521831761657927219618918899
Rainbow Six Siege296.8255.6245.1236.1150327281275274177
Dota 2 Reborn156142138129116256206201183146179165159150144
The Witcher 329525919510979640488382209156125458371255138102
GTA V16916214184115187186182146130151185183177123113134
Battlefield 4200200200191126200200200200159
BioShock Infinite305270252196311.5287.3262.2212.8
NVIDIA GeForce RTX 2080 Super (Desktop)AMD Radeon RX 7900 GRENVIDIA Titan RTX
lowmed.highultraQHD4Klowmed.highultraQHD4Klowmed.highultraQHD4K
< 30 fps
< 60 fps
< 120 fps
≥ 120 fps


14
72

1
25
63

1
40
49
1
4
51
39
1
15
48
17
6
47
40
9
< 30 fps
< 60 fps
< 120 fps
≥ 120 fps


25


25


1
24


2
20


7
16

3
16
6
< 30 fps
< 60 fps
< 120 fps
≥ 120 fps

1
13
85

1
20
80

2
25
74

4
36
53
1
5
38
21
2
30
53
15

Eine Liste mit weiteren Spielen und allen Grafikkarten finden Sie auf unserer Seite: Welches Spiel ist mit welcher Grafikkarte spielbar?

v1.35
log 01. 03:10:08

#0 ran 0s before starting gpusingle class +0s ... 0s

#1 checking url part for id 9897 +0s ... 0s

#2 checking url part for id 11594 +0s ... 0s

#3 checking url part for id 9651 +0s ... 0s

#4 redirected to Ajax server, took 1767233407s time from redirect:0 +0s ... 0s

#5 did not recreate cache, as it is less than 5 days old! Created at Wed, 31 Dec 2025 05:19:26 +0100 +0s ... 0s

#6 composed specs +0.042s ... 0.042s

#7 did output specs +0s ... 0.042s

#8 start showIntegratedCPUs +0s ... 0.042s

#9 getting avg benchmarks for device 9897 +0.026s ... 0.069s

#10 got single benchmarks 9897 +0.008s ... 0.076s

#11 getting avg benchmarks for device 11594 +0.004s ... 0.081s

#12 got single benchmarks 11594 +0.007s ... 0.087s

#13 getting avg benchmarks for device 9651 +0.004s ... 0.092s

#14 got single benchmarks 9651 +0.038s ... 0.129s

#15 got avg benchmarks for devices +0s ... 0.129s

#16 min, max, avg, median took s +0.106s ... 0.236s

#17 before gaming benchmark output +0s ... 0.236s

#18 Got 3933 rows for game benchmarks. +0.087s ... 0.323s

#19 composed SQL query for gamebenchmarks +0s ... 0.323s

#20 got data and put it in $dataArray +0.022s ... 0.345s

#21 benchmarks composed for output. +0.078s ... 0.423s

#22 calculated avg scores. +0s ... 0.423s

#23 return log +0.005s ... 0.428s

Teilen Sie diesen Artikel, um uns zu unterstützen. Jeder Link hilft!
Mail Logo
> Notebook Test, Laptop Test und News > Benchmarks / Technik > Benchmarks / Technik > Grafikkarten Vergleich - Head 2 Head
Autor: Klaus Hinum,  8.09.2017 (Update:  1.07.2023)