|
|
NVIDIA GeForce GTX 980 SLI (Laptop)
MSI GT80S 6QF, Intel Core i7-6820HK | |
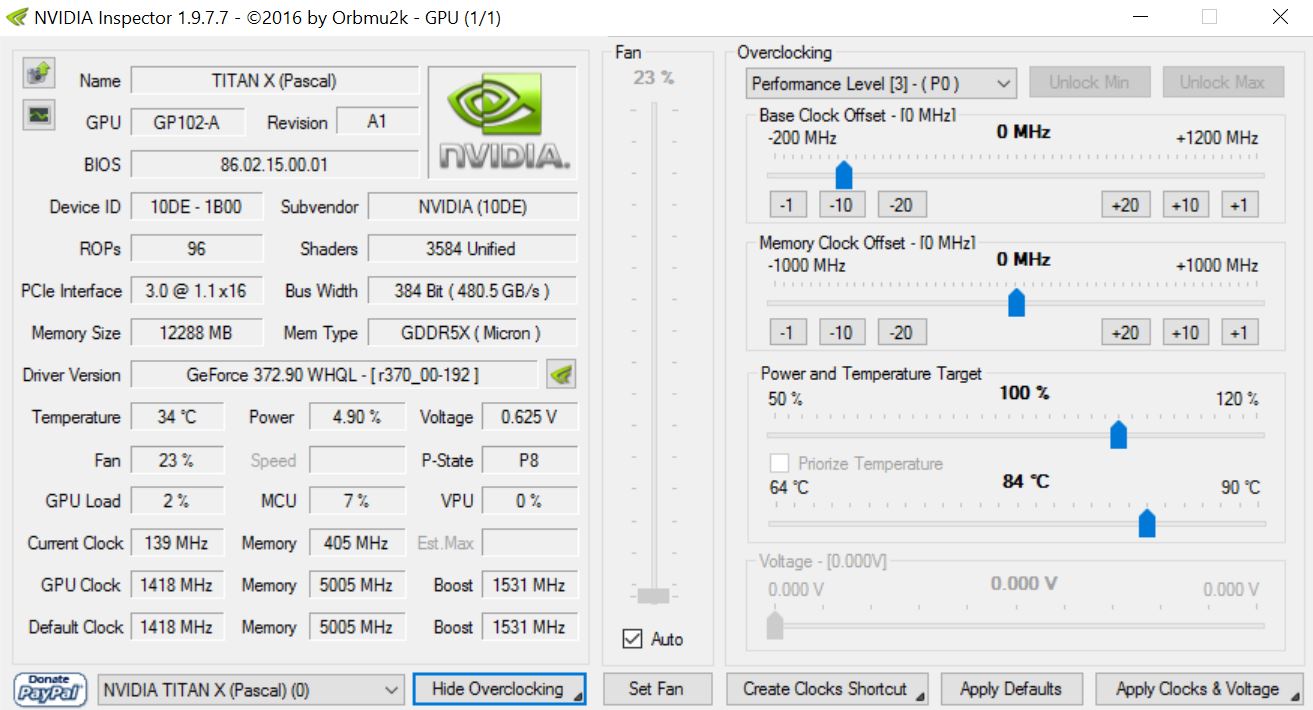
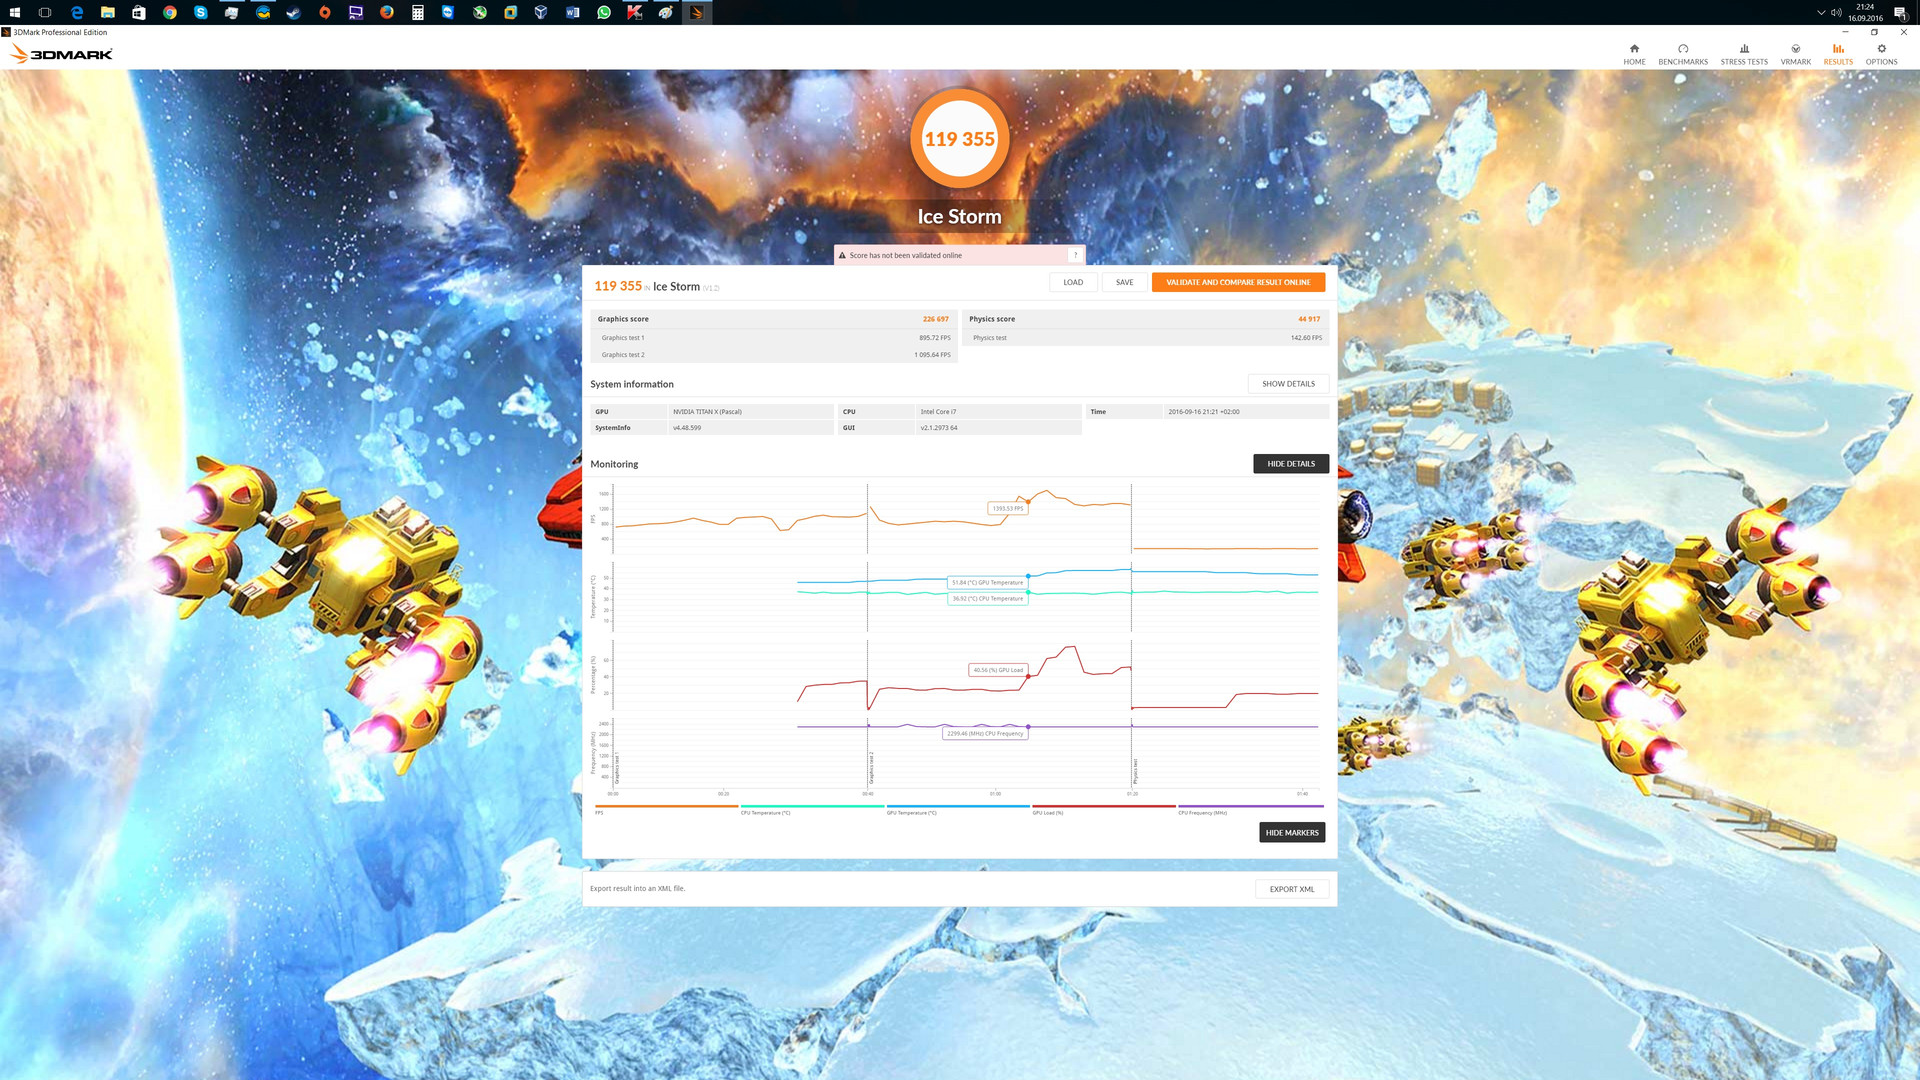
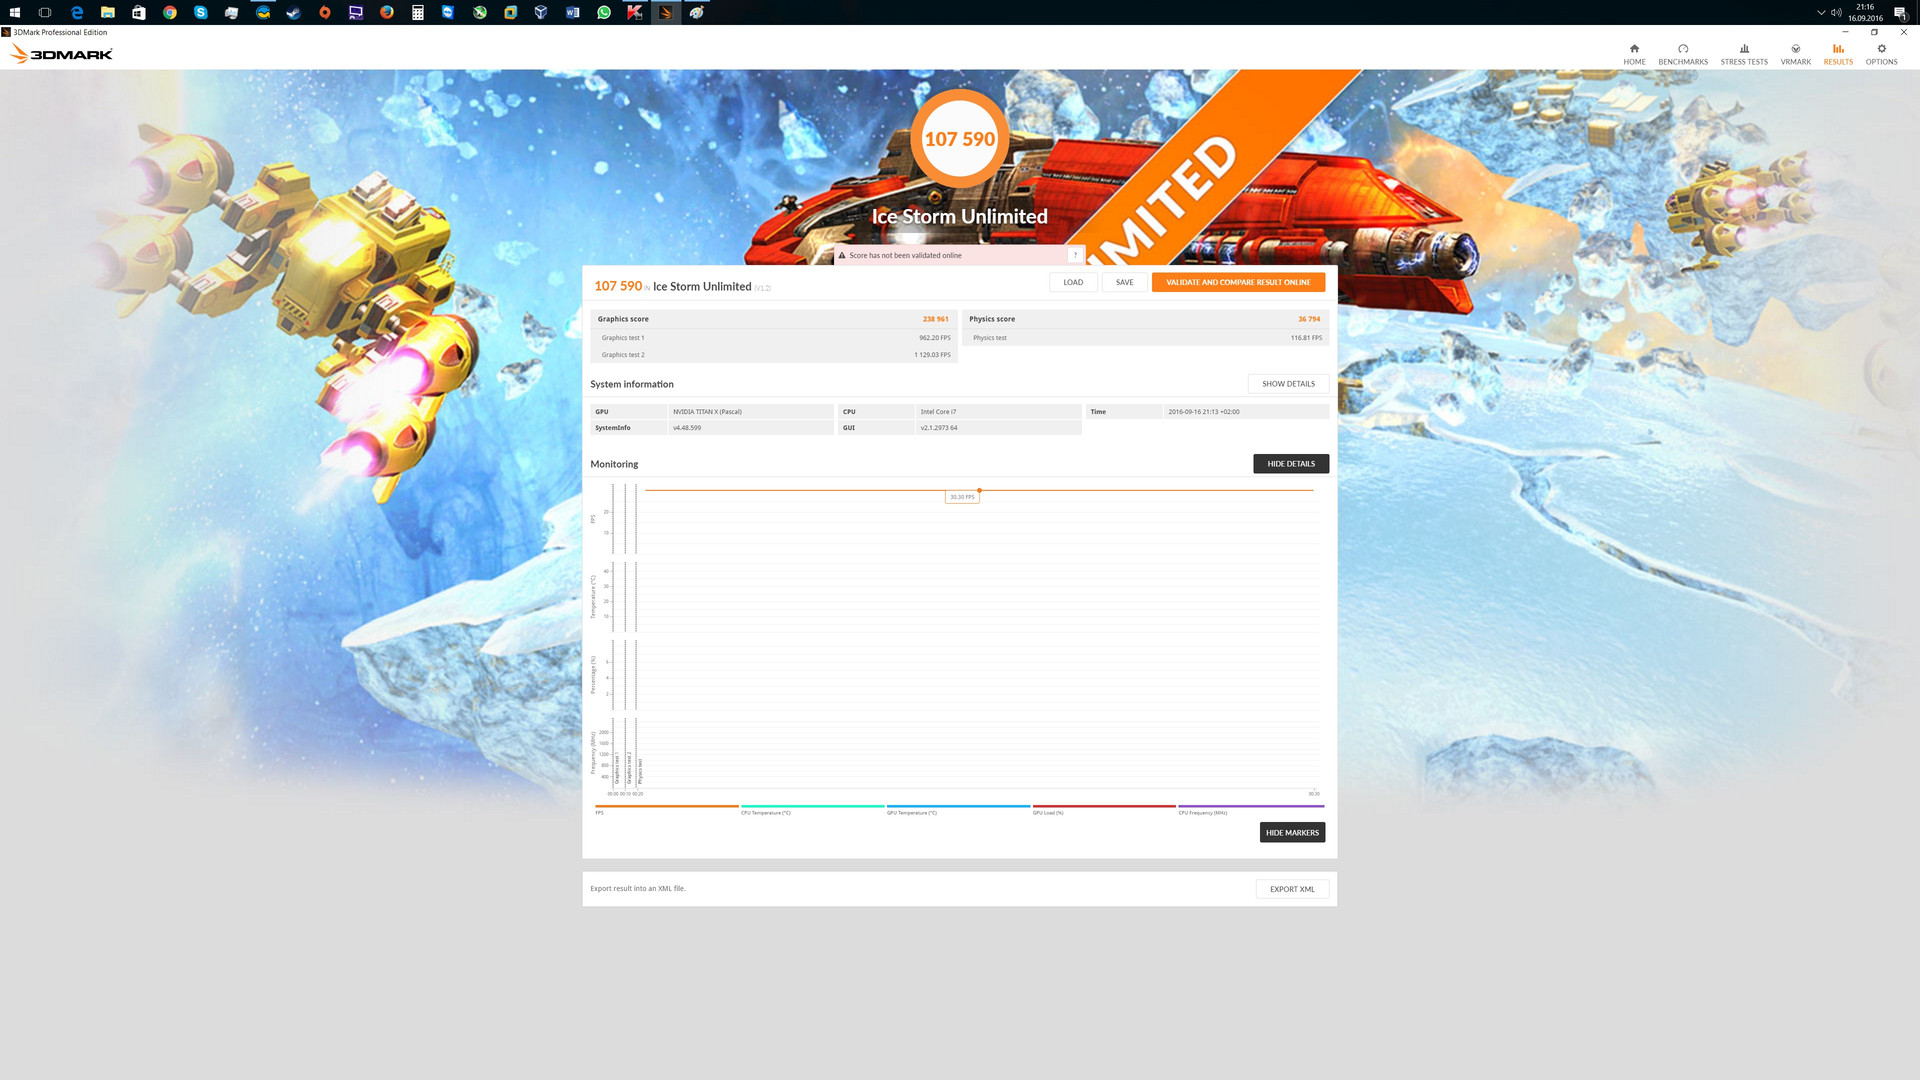
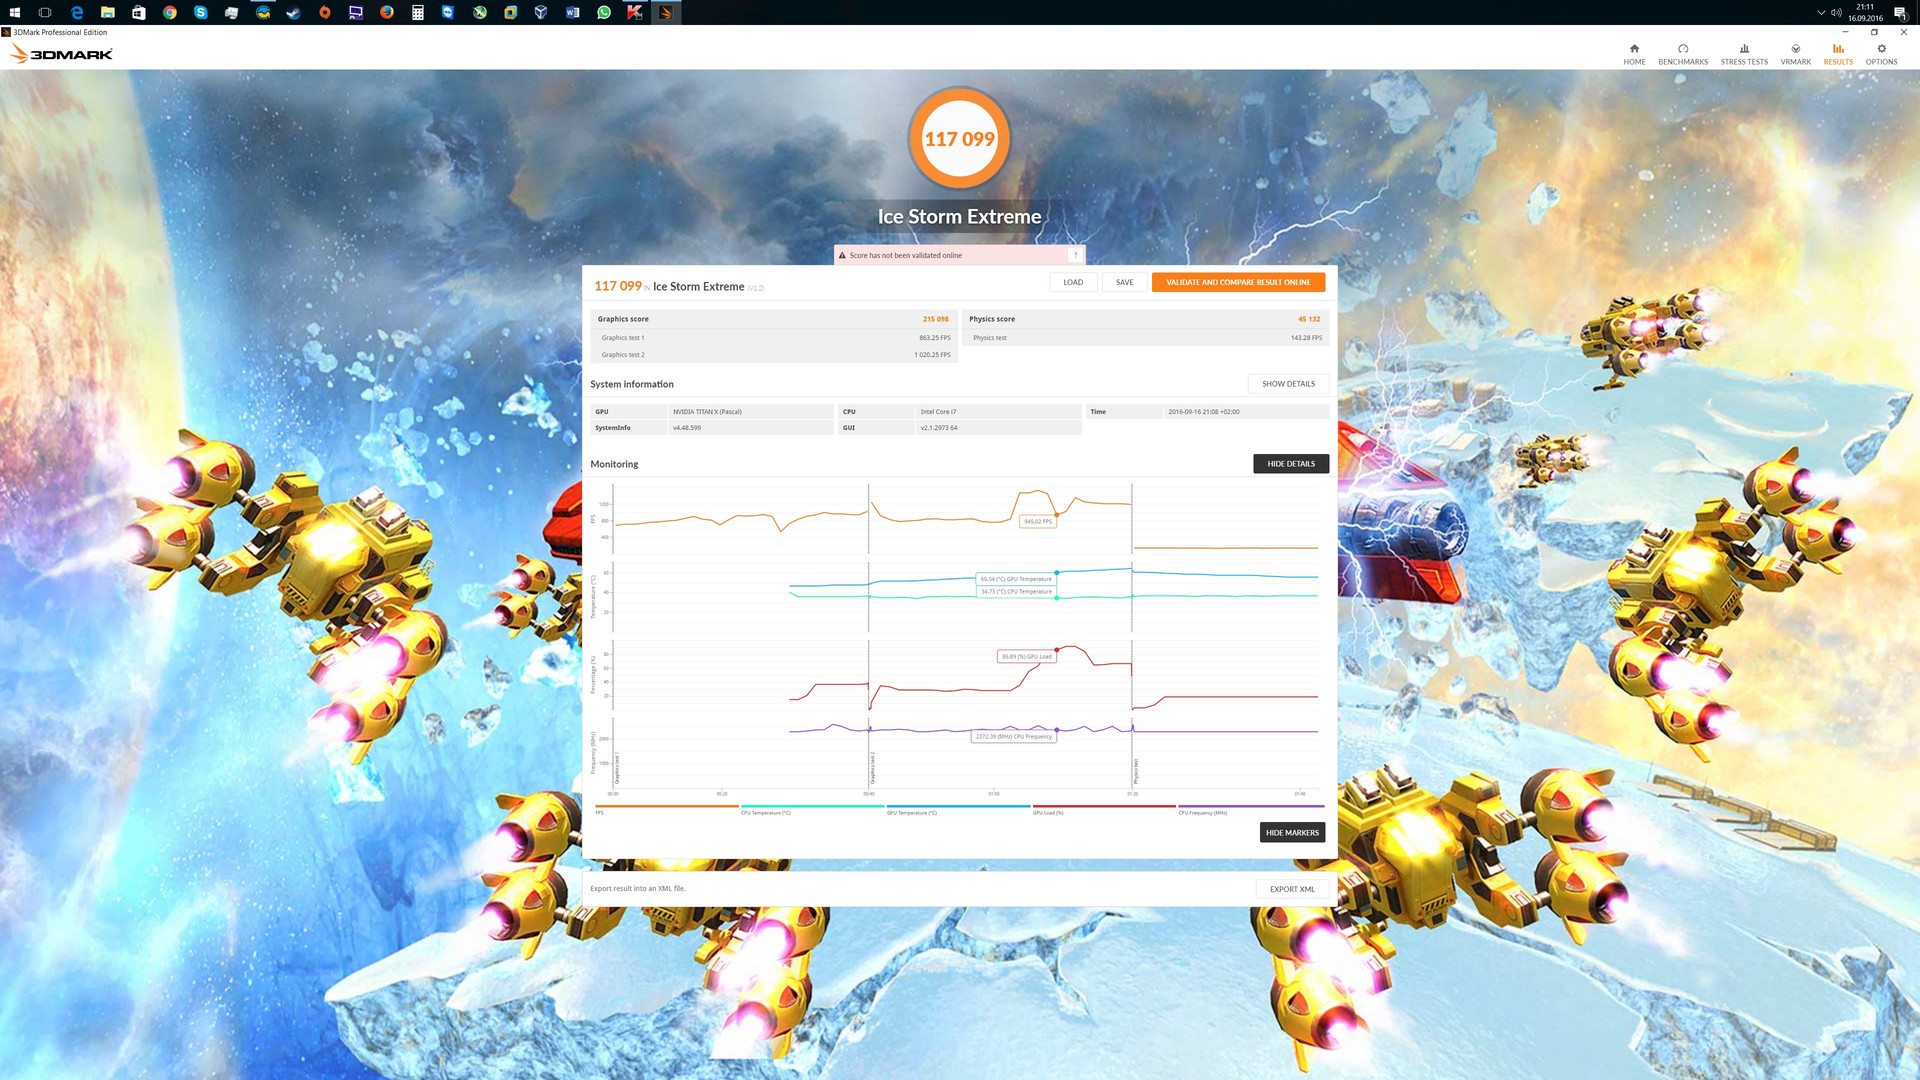
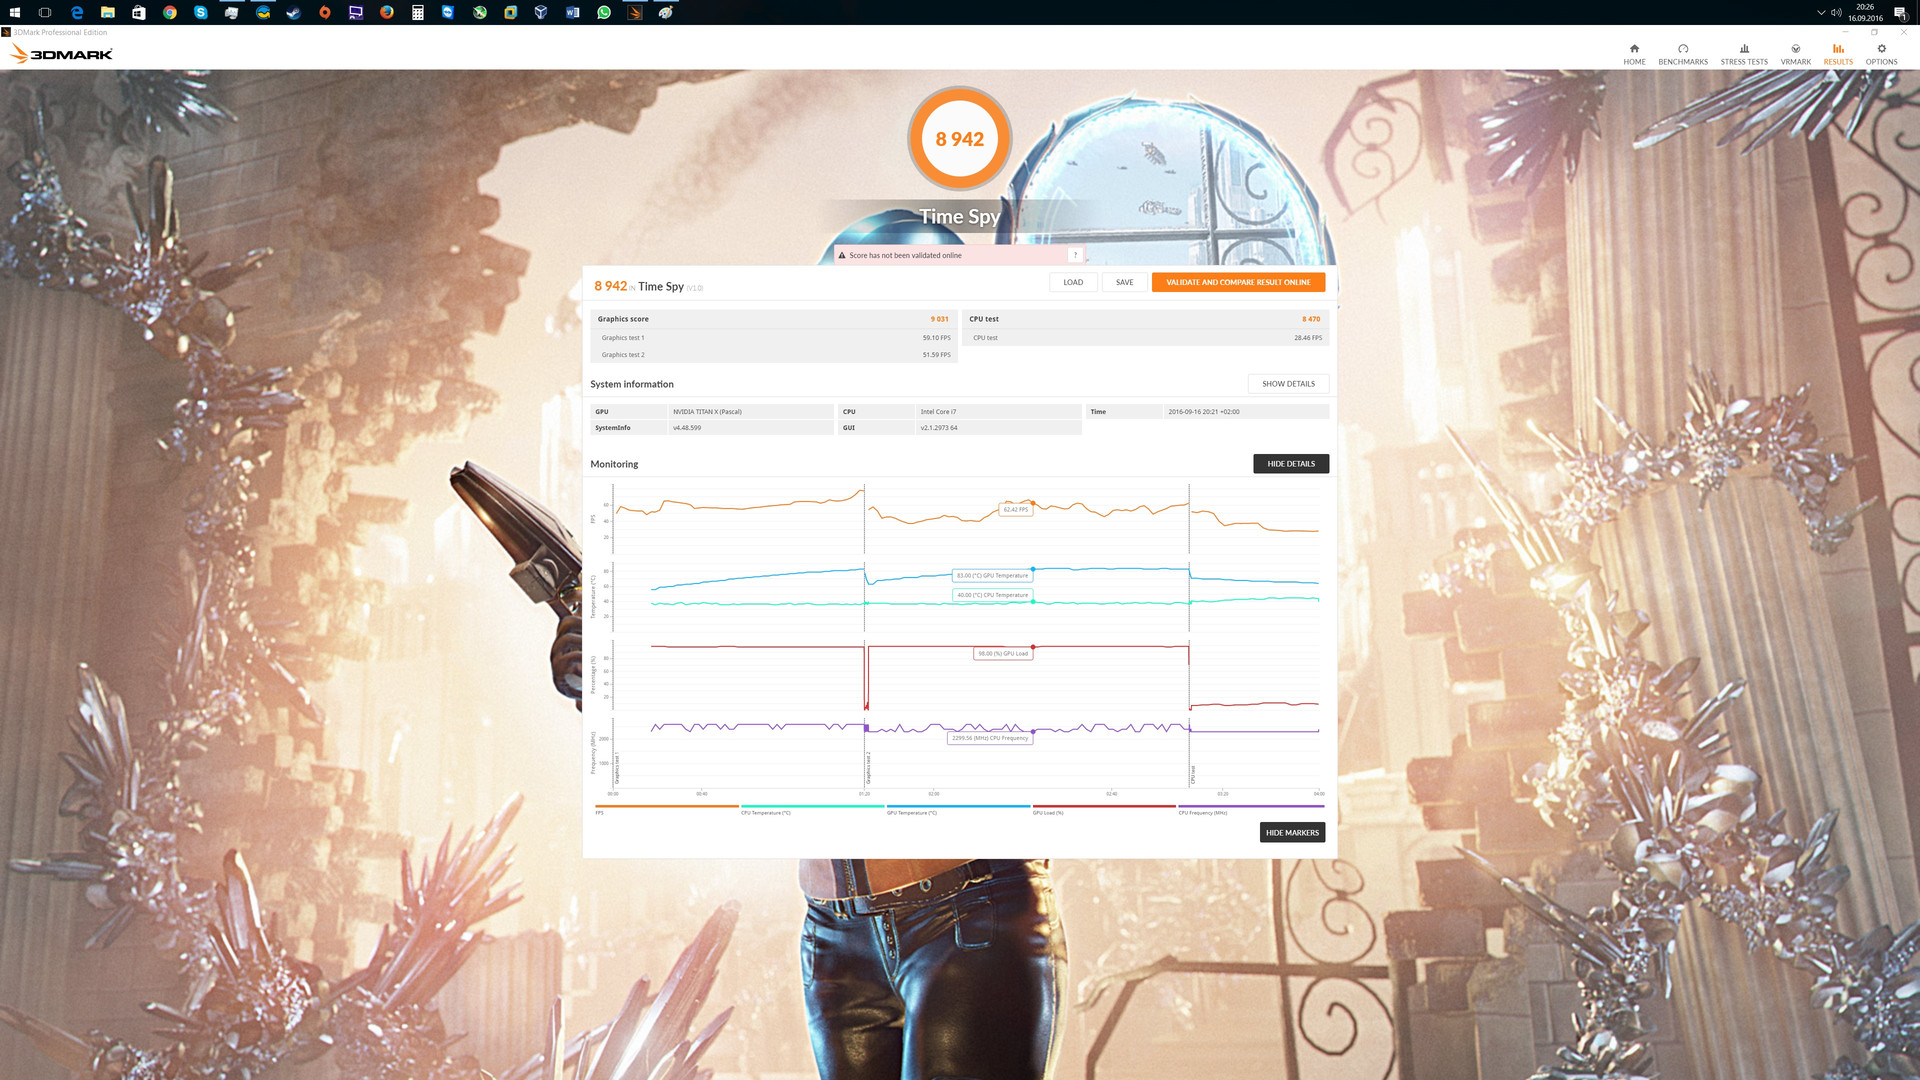
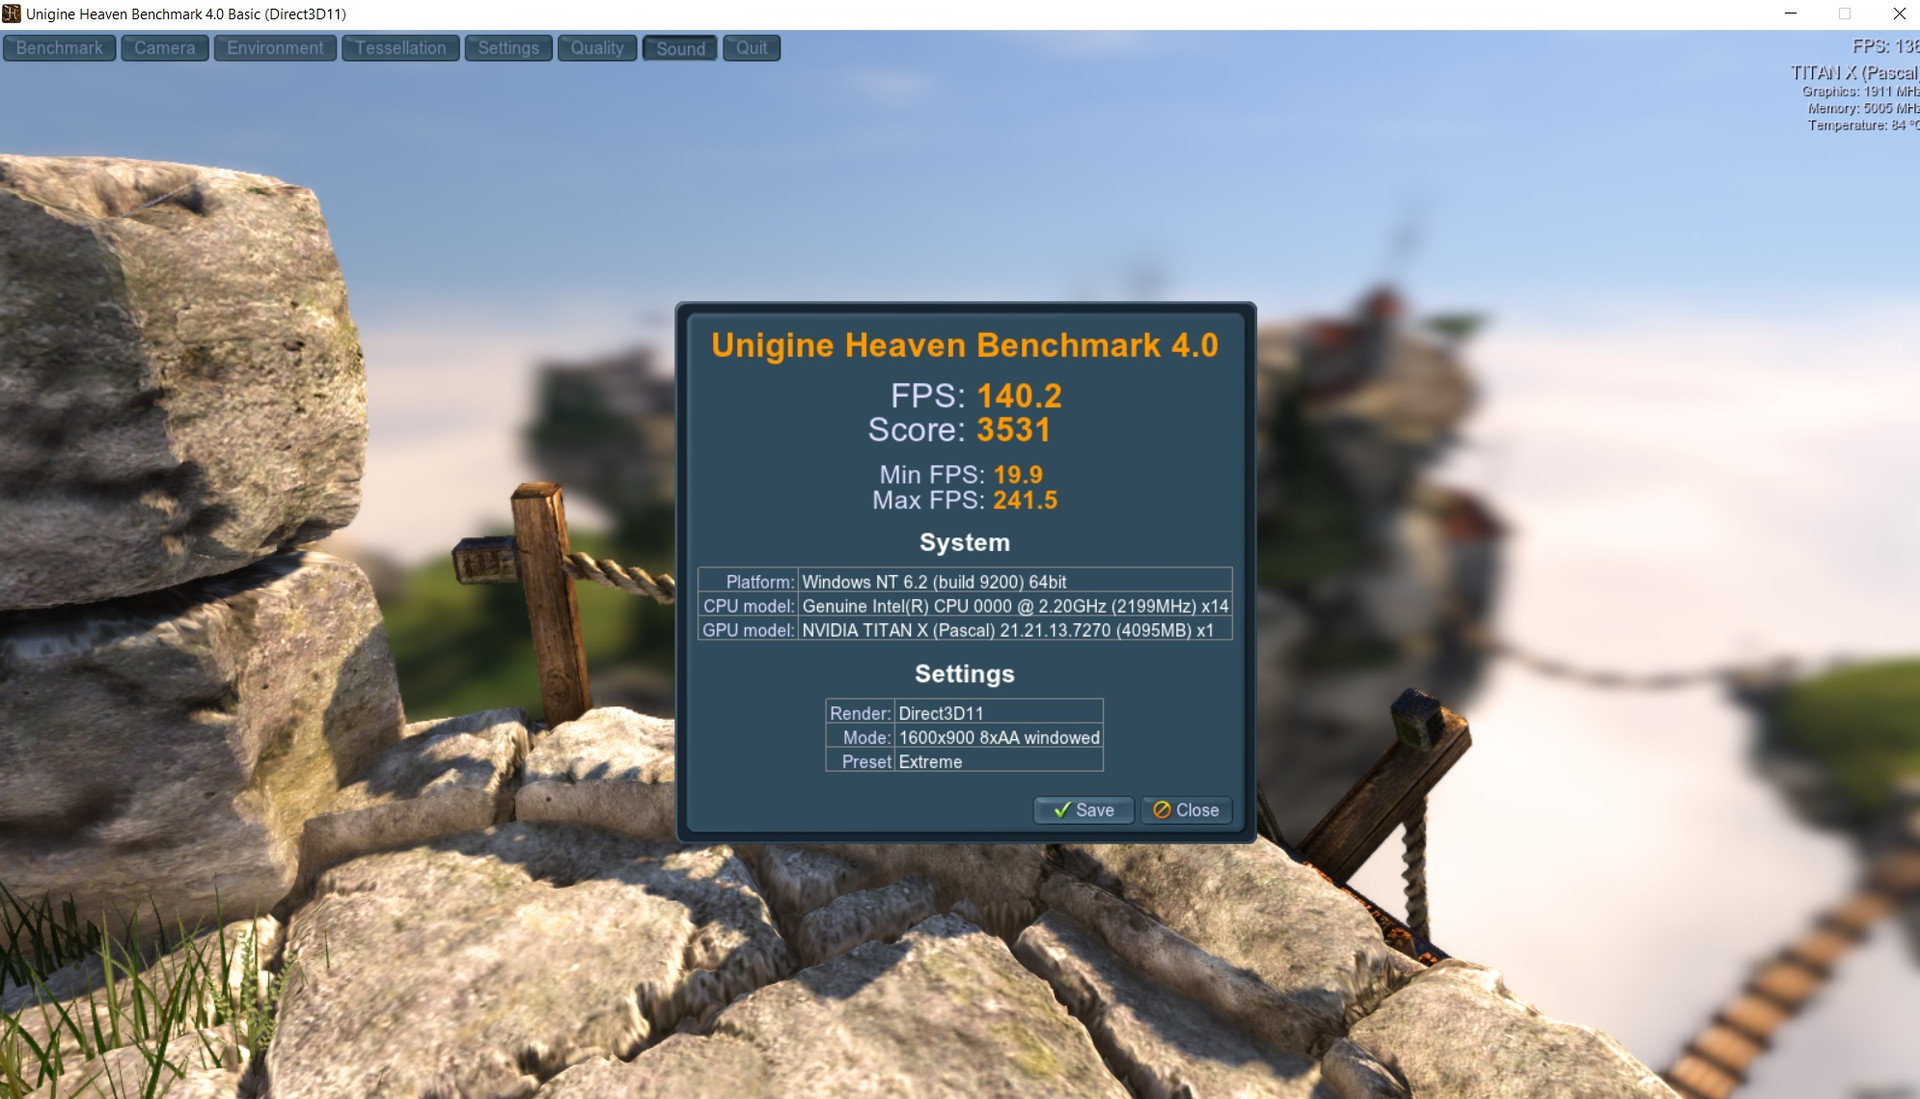
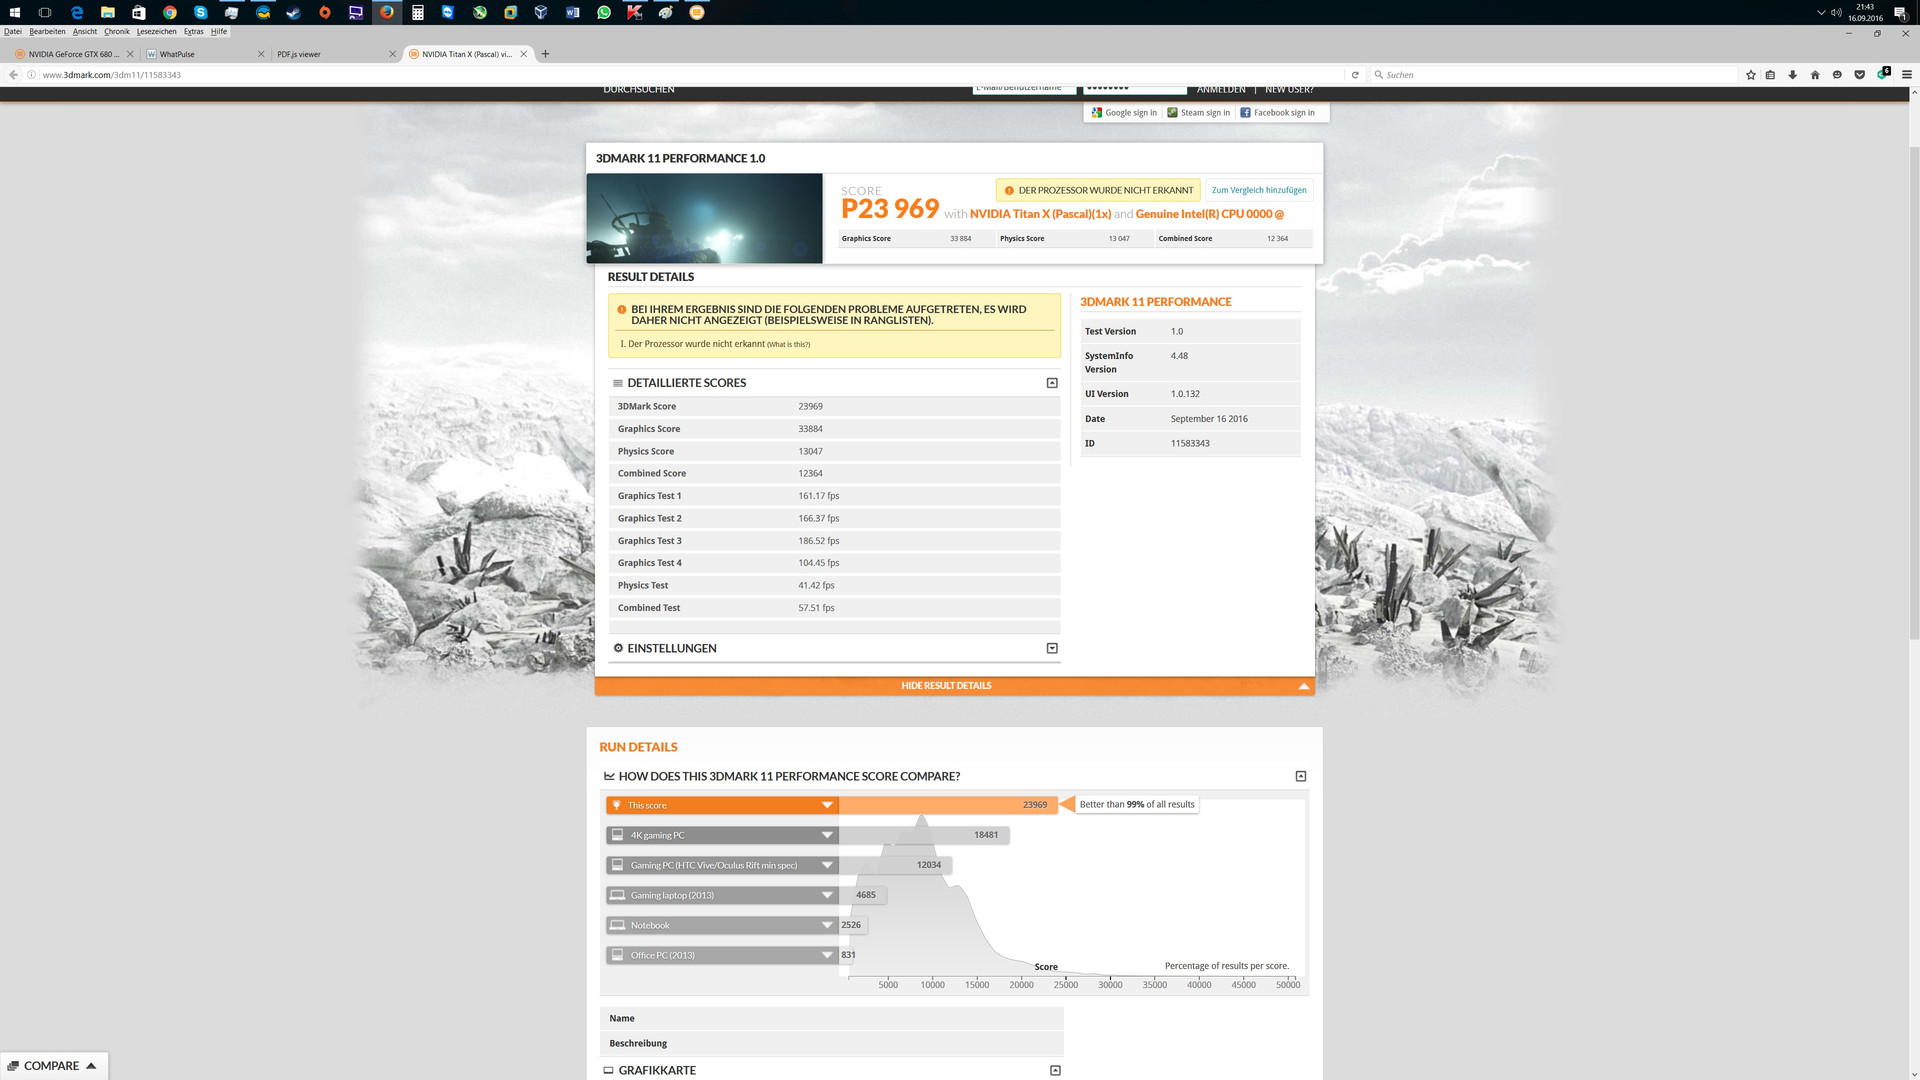
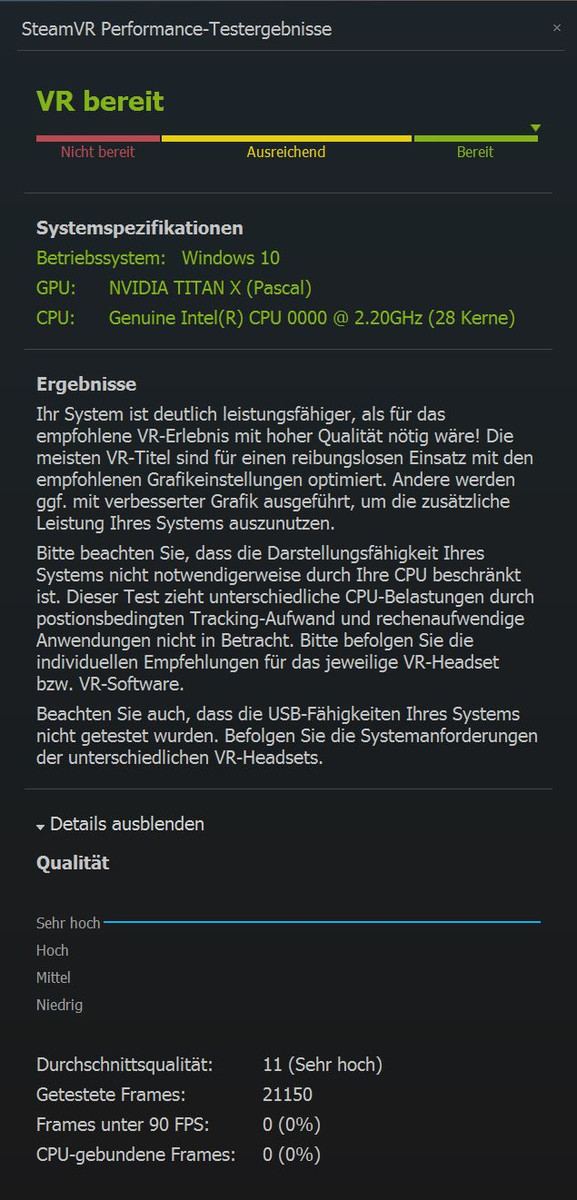
NVIDIA Titan X Pascal
Nvidia Titan X (Pascal), Intel Xeon E5-2680 v4 | |
NVIDIA GeForce GTX 980 Ti
Asus Strix GTX 980 Ti Desktop PC, Intel Core i7-4790K | |
NVIDIA GeForce GTX 1070 (Desktop)
Nvidia GeForce GTX 1070 Founders Edition, Intel Core i7-4790K | |
NVIDIA GeForce GTX 1080 (Desktop)
Nvidia GeForce GTX 1080 Founders Edition, Intel Core i7-4790K | |
NVIDIA GeForce GTX 980 (Laptop)
Eurocom Sky DLX7, Intel Core i7-6700K | |
AMD Radeon R9 Fury
XFX Radeon R9 Fury Pro, Intel Core i7-4790K | |
NVIDIA GeForce GTX 980M
DogHouse Systems Mobius SS, Intel Core i7-6700K | |
|
NVIDIA Titan X Pascal
Nvidia Titan X (Pascal), Intel Xeon E5-2680 v4 | |
NVIDIA GeForce GTX 980 SLI (Laptop)
MSI GT80S 6QF, Intel Core i7-6820HK | |
NVIDIA GeForce GTX 1070 (Desktop)
Nvidia GeForce GTX 1070 Founders Edition, Intel Core i7-4790K | |
NVIDIA GeForce GTX 1080 (Desktop)
Nvidia GeForce GTX 1080 Founders Edition, Intel Core i7-4790K | |
NVIDIA GeForce GTX 980 Ti
Asus Strix GTX 980 Ti Desktop PC, Intel Core i7-4790K | |
AMD Radeon R9 Fury
XFX Radeon R9 Fury Pro, Intel Core i7-4790K | |
NVIDIA GeForce GTX 980 (Laptop)
Eurocom Sky DLX7, Intel Core i7-6700K | |
NVIDIA GeForce GTX 980M
DogHouse Systems Mobius SS, Intel Core i7-6700K | |
|
|
NVIDIA Titan X Pascal
Nvidia Titan X (Pascal), Intel Xeon E5-2680 v4 | |
NVIDIA GeForce GTX 1080 (Desktop)
Nvidia GeForce GTX 1080 Founders Edition, Intel Core i7-4790K | |
NVIDIA GeForce GTX 1070 (Desktop)
Nvidia GeForce GTX 1070 Founders Edition, Intel Core i7-4790K | |
NVIDIA GeForce GTX 980 Ti
Asus Strix GTX 980 Ti Desktop PC, Intel Core i7-4790K | |
NVIDIA GeForce GTX 980 (Laptop)
Eurocom Sky DLX7, Intel Core i7-6700K | |
NVIDIA GeForce GTX 980 SLI (Laptop)
MSI GT80S 6QF, Intel Core i7-6820HK | |
AMD Radeon R9 Fury
XFX Radeon R9 Fury Pro, Intel Core i7-4790K | |
NVIDIA GeForce GTX 980M
DogHouse Systems Mobius SS, Intel Core i7-6700K | |
|
NVIDIA Titan X Pascal
Nvidia Titan X (Pascal), Intel Xeon E5-2680 v4 | |
NVIDIA GeForce GTX 1080 (Desktop)
Nvidia GeForce GTX 1080 Founders Edition, Intel Core i7-4790K | |
AMD Radeon R9 Fury
XFX Radeon R9 Fury Pro, Intel Core i7-4790K | |
NVIDIA GeForce GTX 1070 (Desktop)
Nvidia GeForce GTX 1070 Founders Edition, Intel Core i7-4790K | |
NVIDIA GeForce GTX 980 Ti
Asus Strix GTX 980 Ti Desktop PC, Intel Core i7-4790K | |
NVIDIA GeForce GTX 980 (Laptop)
Eurocom Sky DLX7, Intel Core i7-6700K | |
NVIDIA GeForce GTX 980 SLI (Laptop)
MSI GT80S 6QF, Intel Core i7-6820HK | |
NVIDIA GeForce GTX 980M
DogHouse Systems Mobius SS, Intel Core i7-6700K | |
|
NVIDIA Titan X Pascal
Nvidia Titan X (Pascal), Intel Xeon E5-2680 v4 | |
NVIDIA GeForce GTX 1080 (Desktop)
Nvidia GeForce GTX 1080 Founders Edition, Intel Core i7-4790K | |
NVIDIA GeForce GTX 1070 (Desktop)
Nvidia GeForce GTX 1070 Founders Edition, Intel Core i7-4790K | |
AMD Radeon R9 Fury
XFX Radeon R9 Fury Pro, Intel Core i7-4790K | |
NVIDIA GeForce GTX 980 Ti
Asus Strix GTX 980 Ti Desktop PC, Intel Core i7-4790K | |
NVIDIA GeForce GTX 980 (Laptop)
Eurocom Sky DLX7, Intel Core i7-6700K | |
NVIDIA GeForce GTX 980 SLI (Laptop)
MSI GT80S 6QF, Intel Core i7-6820HK | |
NVIDIA GeForce GTX 980M
DogHouse Systems Mobius SS, Intel Core i7-6700K | |
|
NVIDIA Titan X Pascal
Nvidia Titan X (Pascal), Intel Xeon E5-2680 v4 | |
NVIDIA GeForce GTX 1080 (Desktop)
Nvidia GeForce GTX 1080 Founders Edition, Intel Core i7-4790K | |
NVIDIA GeForce GTX 1070 (Desktop)
Nvidia GeForce GTX 1070 Founders Edition, Intel Core i7-4790K | |
NVIDIA GeForce GTX 980 Ti
Asus Strix GTX 980 Ti Desktop PC, Intel Core i7-4790K | |
AMD Radeon R9 Fury
XFX Radeon R9 Fury Pro, Intel Core i7-4790K | |
NVIDIA GeForce GTX 980 (Laptop)
Eurocom Sky DLX7, Intel Core i7-6700K | |
NVIDIA GeForce GTX 980 SLI (Laptop)
MSI GT80S 6QF, Intel Core i7-6820HK | |
NVIDIA GeForce GTX 980M
DogHouse Systems Mobius SS, Intel Core i7-6700K | |
|
NVIDIA Titan X Pascal
Nvidia Titan X (Pascal), Intel Xeon E5-2680 v4 | |
AMD Radeon R9 Fury
XFX Radeon R9 Fury Pro, Intel Core i7-4790K | |
NVIDIA GeForce GTX 1080 (Desktop)
Nvidia GeForce GTX 1080 Founders Edition, Intel Core i7-4790K | |
NVIDIA GeForce GTX 980 Ti
Asus Strix GTX 980 Ti Desktop PC, Intel Core i7-4790K | |
NVIDIA GeForce GTX 1070 (Desktop)
Nvidia GeForce GTX 1070 Founders Edition, Intel Core i7-4790K | |
NVIDIA GeForce GTX 980 SLI (Laptop)
MSI GT80S 6QF, Intel Core i7-6820HK | |
NVIDIA GeForce GTX 980 (Laptop)
Eurocom Sky DLX7, Intel Core i7-6700K | |
NVIDIA GeForce GTX 980M
DogHouse Systems Mobius SS, Intel Core i7-6700K | |
|
NVIDIA Titan X Pascal
Nvidia Titan X (Pascal), Intel Xeon E5-2680 v4 | |
NVIDIA GeForce GTX 1080 (Desktop)
Nvidia GeForce GTX 1080 Founders Edition, Intel Core i7-4790K | |
NVIDIA GeForce GTX 1070 (Desktop)
Nvidia GeForce GTX 1070 Founders Edition, Intel Core i7-4790K | |
NVIDIA GeForce GTX 980 Ti
Asus Strix GTX 980 Ti Desktop PC, Intel Core i7-4790K | |
AMD Radeon R9 Fury
XFX Radeon R9 Fury Pro, Intel Core i7-4790K | |
NVIDIA GeForce GTX 980 (Laptop)
Eurocom Sky DLX7, Intel Core i7-6700K | |
NVIDIA GeForce GTX 980 SLI (Laptop)
MSI GT80S 6QF, Intel Core i7-6820HK | |
NVIDIA GeForce GTX 980M
DogHouse Systems Mobius SS, Intel Core i7-6700K | |