NVIDIA GeForce RTX 4060 Laptop GPU
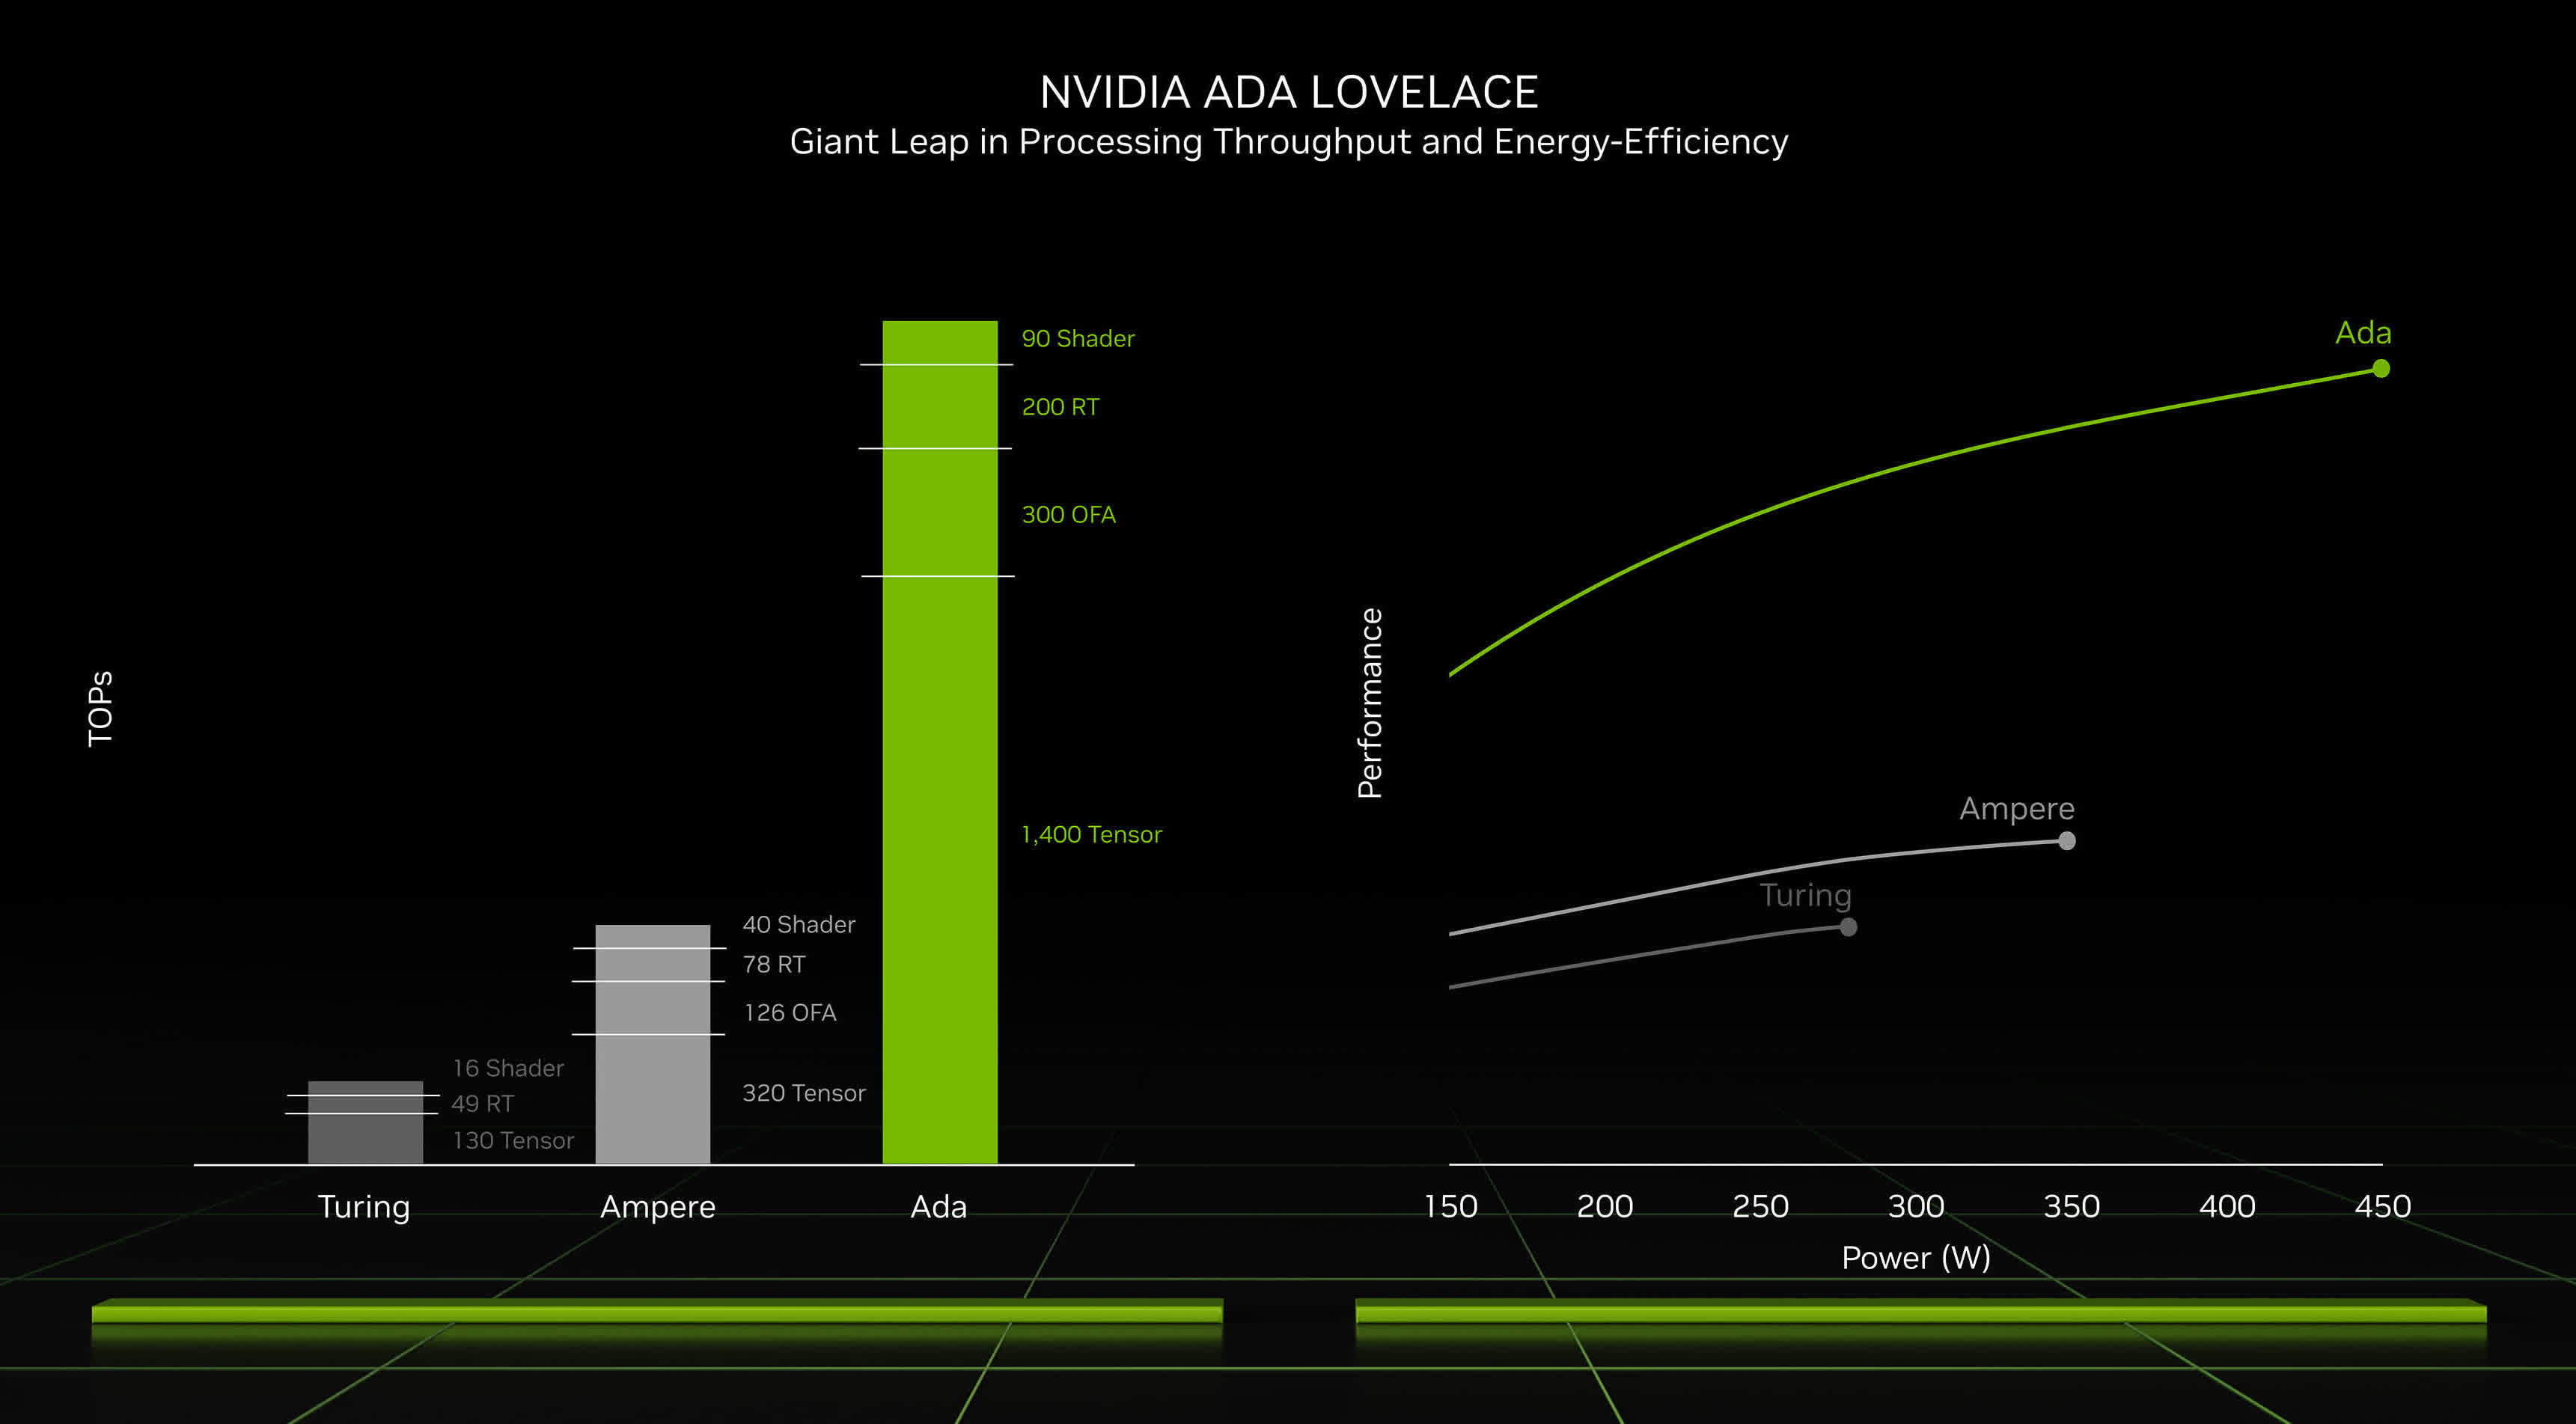
Die NVIDIA GeForce RTX 4060 Laptop GPU (Codename GN21-X4) ist eine High-End-Notebookgrafikkarte die Anfang 2023 vorgestellt wurde. Sie basiert auf den AD107 Chip (Ada Lovelace Architektur) und bietet wahrscheinlich 3.072 Shader und einen 128 Bit Speicherbus mit 8 GB GDDR6 Grafikspeicher und einer Taktung von effektiv 16 Gbps. Der TGP (Stromverbrauch kann von 35 bis 115 Watt rangieren plus zusätzlich etwa 15-25 Watt Dynamic Boost (von der CPU). Je nach TDP rangiert die maximale Taktrate von 1470 MHz (35 Watt) bis 2370 MHz (115 Watt).
In synthetischen Benchmarks kann sich die durchschnittliche RTX 4060 Laptop GPU zwischen einer RTX 3070 Laptop GPU und 3070 Ti Laptop GPU einordnen. Die Performance kann aber gerade bei geringen TDP-Varianten (z.B. mit nur 45 Watt) deutlich abweichen. In Spielen reicht die Performance meist für maximale Grafiksettings bei 1920x1080 für Frameraten > 60 fps (siehe unten). Weniger anspruchsvolle Spiele wie Baldurs Gate 3 sind auch in QHD flüssig spielbar (bei ausreichendem Power Limit der GPU).
Durch die 80 Tensor-Kerne unterstützt die RTX4060 auch DLSS3 inklusive Frame Generation. Die 20 Raytracing-Kerne werden jedoch nur selten genutzt werden, da die Leistung der RTX 4060 für maximale Details und Raytracing kaum ausreicht bei modernen Spielen.
Der AD107 Chip wird im 5nm Prozess bei TSMC gefertigt (4N).
GeForce RTX 4000 Laptop GPU Serie Codename GN21-X4 Architektur Ada Lovelace Pipelines 3072 - unified TMUs 96 ROPs 32 Raytracing Cores 20 Tensor / AI Cores 80 Kerntakt 2370 (Boost) MHz Theoretical Performance 11.6 TFLOPS FP16, 11.6 TFLOPS FP32, 0.181 TFLOPS FP64 Cache L2: 32 MB Speichertakt 16000 effective = 2000 MHz Speicherbandbreite 128 Bit Speichertyp GDDR6 Max. Speichergröße 8 GB Shared Memory nein Memory Bandwidth 256 GB/s API DirectX 12 Ultimate, Shader 6.7, OpenGL 4.6, OpenCL 3.0, Vulkan 1.3 Stromverbrauch 115 Watt (35 - 115 Watt TGP) Herstellungsprozess 5 nm Displays 4 Displays (max.), HDMI 2.1, DisplayPort 1.4a Notebookgröße groß (17" z.B.) Erscheinungsdatum 03.01.2023 Herstellerseite www.nvidia.com Predecessor GeForce RTX 3060 Laptop GPU
Benchmarks Performance Rating - 3DMark 11 + Fire Strike + Time Spy
12 pt (36%)
...
NVIDIA GeForce RTX 4060 Laptop GPU
...
max:
3DMark - 3DMark Time Spy Score
min: 7918 avg: 10135 median: 10555 (30%) max: 11738 Points
GPU TDP ? TDP 45 W TDP 55 W TDP 60 W TDP 65 W TDP 75 W TDP 80 W TDP 100 W TDP 105 W TDP 115 W TDP 120 W TDP 125 W TDP 140 W 95% 67% 73% 71% 72% 79% 81% 84% 88% 85% 92% 100% 92%
...
NVIDIA GeForce RTX 4060 Laptop GPU
...
max:
3DMark - 3DMark Time Spy Graphics
min: 7484 avg: 9785 median: 10304 (27%) max: 11267 Points
GPU TDP ? TDP 45 W TDP 55 W TDP 60 W TDP 65 W TDP 75 W TDP 80 W TDP 100 W TDP 105 W TDP 115 W TDP 120 W TDP 125 W TDP 140 W 96% 66% 72% 71% 71% 82% 83% 83% 90% 86% 92% 100% 92%
...
NVIDIA GeForce RTX 4060 Laptop GPU
...
max:
3DMark - 3DMark Ice Storm Unlimited Graphics
min: 582805 avg: 607958 median: 598142 (68%) max: 642928 Points
GPU TDP 60 W TDP 140 W 100% 92%
...
NVIDIA GeForce RTX 4060 Laptop GPU
max:
3DMark - 3DMark Ice Storm Extreme Graphics
min: 421941 avg: 447527 median: 459924 (59%) max: 460715 Points
GPU TDP 60 W TDP 140 W 100% 96%
...
NVIDIA GeForce RTX 4060 Laptop GPU
max:
3DMark - 3DMark Cloud Gate Score
min: 42137 avg: 59849 median: 60810.5 (65%) max: 67374 Points
GPU TDP ? TDP 45 W TDP 55 W TDP 60 W TDP 65 W TDP 75 W TDP 105 W TDP 115 W TDP 120 W TDP 140 W 100% 91% 93% 94% 95% 82% 95% 89% 99% 97%
...
NVIDIA GeForce RTX 4060 Laptop GPU
...
max:
3DMark - 3DMark Cloud Gate Graphics
min: 81407 avg: 146295 median: 151337 (40%) max: 180228 Points
GPU TDP ? TDP 45 W TDP 55 W TDP 60 W TDP 65 W TDP 75 W TDP 105 W TDP 115 W TDP 120 W TDP 140 W 90% 80% 69% 77% 71% 84% 100% 81% 89% 84%
...
NVIDIA GeForce RTX 4060 Laptop GPU
max:
3DMark - 3DMark Fire Strike Standard Score
min: 17076 avg: 22465 median: 23561 (42%) max: 25869 Points
GPU TDP ? TDP 45 W TDP 55 W TDP 60 W TDP 65 W TDP 75 W TDP 80 W TDP 100 W TDP 105 W TDP 115 W TDP 120 W TDP 125 W TDP 140 W 93% 71% 78% 77% 76% 80% 67% 89% 93% 85% 95% 100% 95%
...
NVIDIA GeForce RTX 4060 Laptop GPU
...
max:
3DMark - 3DMark Fire Strike Standard Graphics
min: 20533 avg: 25146 median: 26387 (30%) max: 27752 Points
GPU TDP ? TDP 45 W TDP 55 W TDP 60 W TDP 65 W TDP 75 W TDP 80 W TDP 100 W TDP 105 W TDP 115 W TDP 120 W TDP 125 W TDP 140 W 96% 77% 81% 79% 78% 90% 76% 89% 99% 91% 98% 100% 97%
...
NVIDIA GeForce RTX 4060 Laptop GPU
...
max:
3DMark - 3DMark Ice Storm Graphics
min: 148645 avg: 334998 median: 262337 (31%) max: 550328 Points
GPU TDP 55 W TDP 60 W TDP 105 W TDP 140 W 33% 100% 48% 61%
...
NVIDIA GeForce RTX 4060 Laptop GPU
...
max:
3DMark - 3DMark Wild Life Unlimited
min: 46622 avg: 57333 median: 57640 (29%) max: 67428 Points
GPU TDP 45 W TDP 60 W TDP 140 W 72% 69% 100%
...
NVIDIA GeForce RTX 4060 Laptop GPU
...
max:
3DMark - 3DMark Wild Life Extreme Unlimited
min: 13939 avg: 17749 median: 18027 (21%) max: 21662 Points
GPU TDP 45 W TDP 60 W TDP 80 W TDP 100 W TDP 115 W TDP 125 W TDP 140 W 64% 69% 70% 89% 78% 100% 92%
...
NVIDIA GeForce RTX 4060 Laptop GPU
...
max:
3DMark - 3DMark Night Raid
min: 43188 avg: 54267 median: 56795 (54%) max: 64551 Points
GPU TDP 55 W TDP 60 W TDP 140 W 76% 99% 100%
...
NVIDIA GeForce RTX 4060 Laptop GPU
max:
3DMark - 3DMark Night Raid Graphics Score
min: 69610 avg: 104557 median: 102266 (39%) max: 133202 Points
GPU TDP 55 W TDP 60 W TDP 140 W 60% 87% 100%
...
NVIDIA GeForce RTX 4060 Laptop GPU
max:
3DMark 11 - 3DM11 Performance Score
min: 25182 avg: 29817 median: 30686.5 (43%) max: 33427 Points
GPU TDP ? TDP 45 W TDP 55 W TDP 60 W TDP 65 W TDP 75 W TDP 80 W TDP 100 W TDP 105 W TDP 115 W TDP 120 W TDP 125 W TDP 140 W 90% 79% 82% 79% 83% 85% 77% 91% 94% 89% 96% 100% 95%
...
NVIDIA GeForce RTX 4060 Laptop GPU
max:
3DMark 11 - 3DM11 Performance GPU
min: 28136 avg: 34335 median: 35653 (31%) max: 37796 Points
GPU TDP ? TDP 45 W TDP 55 W TDP 60 W TDP 65 W TDP 75 W TDP 80 W TDP 100 W TDP 105 W TDP 115 W TDP 120 W TDP 125 W TDP 140 W 98% 75% 80% 77% 79% 90% 78% 90% 98% 90% 95% 100% 97%
...
NVIDIA GeForce RTX 4060 Laptop GPU
...
max:
3DMark Vantage + 3DMark Vantage - 3DM Vant. Perf. total
90275 Points (26%)
...
NVIDIA GeForce RTX 4060 Laptop GPU
max:
3DM Vant. Perf. GPU no PhysX + 3DMark Vantage - 3DM Vant. Perf. GPU no PhysX
96677 Points (55%)
...
NVIDIA GeForce RTX 4060 Laptop GPU
max:
3DMark 06 3DMark 06 - Standard 1280x1024 +
min: 45111 avg: 49877 median: 49745.5 (65%) max: 55811 Points
GPU TDP 45 W TDP 75 W TDP 105 W TDP 140 W 93% 87% 98% 100%
...
NVIDIA GeForce RTX 4060 Laptop GPU
max:
Blender - Blender 3.3 Classroom CUDA *
min: 40 avg: 44 median: 43 (6%) max: 53 Seconds
GPU TDP ? TDP 45 W TDP 55 W TDP 60 W TDP 65 W TDP 75 W TDP 80 W TDP 100 W TDP 105 W TDP 115 W TDP 120 W TDP 125 W TDP 140 W 102% 100% 100% 100% 100% 101% 101% 101% 101% 102% 101% 102% 101%
...
NVIDIA GeForce RTX 4060 Laptop GPU
...
Blender - Blender 3.3 Classroom OPTIX *
min: 19 avg: 23.4 median: 23.5 (9%) max: 28 Seconds
GPU TDP ? TDP 45 W TDP 55 W TDP 60 W TDP 65 W TDP 75 W TDP 80 W TDP 100 W TDP 105 W TDP 115 W TDP 120 W TDP 125 W TDP 140 W 103% 100% 100% 100% 100% 101% 101% 101% 102% 102% 102% 102% 102%
...
NVIDIA GeForce RTX 4060 Laptop GPU
...
SPECviewperf 13 specvp13 sw-04 + SPECviewperf 13 - specvp13 sw-04
min: 95.91 avg: 102 median: 102 (27%) max: 108.18 fps
GPU TDP 105 W TDP 140 W 100% 89%
...
NVIDIA GeForce RTX 4060 Laptop GPU
...
max:
specvp13 snx-03 + SPECviewperf 13 - specvp13 snx-03
min: 21.83 avg: 22.5 median: 22.5 (3%) max: 23.23 fps
GPU TDP 105 W TDP 140 W 94% 100%
...
NVIDIA GeForce RTX 4060 Laptop GPU
...
max:
specvp13 showcase-02 + SPECviewperf 13 - specvp13 showcase-02
min: 105.23 avg: 106.4 median: 106.4 (23%) max: 107.6 fps
GPU TDP 105 W TDP 140 W 98% 100%
...
NVIDIA GeForce RTX 4060 Laptop GPU
...
max:
specvp13 medical-02 + SPECviewperf 13 - specvp13 medical-02
min: 65.6 avg: 66.7 median: 66.7 (14%) max: 67.75 fps
GPU TDP 105 W TDP 140 W 100% 97%
...
NVIDIA GeForce RTX 4060 Laptop GPU
...
max:
specvp13 maya-05 + SPECviewperf 13 - specvp13 maya-05
min: 297.59 avg: 298.6 median: 298.6 (34%) max: 299.64 fps
GPU TDP 105 W TDP 140 W 100% 99%
...
NVIDIA GeForce RTX 4060 Laptop GPU
max:
specvp13 energy-02 + SPECviewperf 13 - specvp13 energy-02
min: 35.21 avg: 35.5 median: 35.5 (11%) max: 35.73 fps
GPU TDP 105 W TDP 140 W 99% 100%
...
NVIDIA GeForce RTX 4060 Laptop GPU
...
specvp13 creo-02 + SPECviewperf 13 - specvp13 creo-02
min: 196.58 avg: 198 median: 198 (29%) max: 199.33 fps
GPU TDP 105 W TDP 140 W 100% 99%
...
NVIDIA GeForce RTX 4060 Laptop GPU
...
max:
specvp13 catia-05 + SPECviewperf 13 - specvp13 catia-05
min: 145.01 avg: 145.3 median: 145.3 (16%) max: 145.49 fps
GPU TDP 105 W TDP 140 W 100% 100%
...
NVIDIA GeForce RTX 4060 Laptop GPU
...
max:
specvp13 3dsmax-06 + SPECviewperf 13 - specvp13 3dsmax-06
min: 206.17 avg: 207.3 median: 207.3 (36%) max: 208.46 fps
GPU TDP 105 W TDP 140 W 99% 100%
...
NVIDIA GeForce RTX 4060 Laptop GPU
...
max:
SPECviewperf 2020 specvp2020 solidworks-05 1080p + SPECviewperf 2020 - specvp2020 solidworks-05 1080p
min: 223.55 avg: 229.2 median: 228 (44%) max: 235.4 fps
GPU TDP 75 W TDP 105 W TDP 140 W 95% 100% 97%
...
NVIDIA GeForce RTX 4060 Laptop GPU
specvp2020 snx-04 1080p + SPECviewperf 2020 - specvp2020 snx-04 1080p
min: 20.7 avg: 22.6 median: 22.9 (4%) max: 24.1 fps
GPU TDP 75 W TDP 105 W TDP 140 W 100% 95% 99%
...
NVIDIA GeForce RTX 4060 Laptop GPU
...
max:
specvp2020 medical-03 1080p + SPECviewperf 2020 - specvp2020 medical-03 1080p
min: 28.8 avg: 30.2 median: 29.8 (21%) max: 32.2 fps
GPU TDP 75 W TDP 105 W TDP 140 W 89% 100% 93%
...
NVIDIA GeForce RTX 4060 Laptop GPU
...
max:
specvp2020 maya-06 1080p + SPECviewperf 2020 - specvp2020 maya-06 1080p
min: 324.49 avg: 366.2 median: 366.4 (53%) max: 409.5 fps
GPU TDP 75 W TDP 105 W TDP 140 W 97% 100% 99%
...
NVIDIA GeForce RTX 4060 Laptop GPU
max:
specvp2020 energy-03 1080p + SPECviewperf 2020 - specvp2020 energy-03 1080p
min: 34.1 avg: 35.7 median: 35.9 (29%) max: 36.7 fps
GPU TDP 75 W TDP 105 W TDP 140 W 99% 94% 100%
...
NVIDIA GeForce RTX 4060 Laptop GPU
...
max:
specvp2020 creo-03 1080p + SPECviewperf 2020 - specvp2020 creo-03 1080p
min: 88.4 avg: 95.6 median: 95.3 (47%) max: 100.7 fps
GPU TDP 75 W TDP 105 W TDP 140 W 94% 100% 95%
...
NVIDIA GeForce RTX 4060 Laptop GPU
...
max:
specvp2020 catia-06 1080p + SPECviewperf 2020 - specvp2020 catia-06 1080p
min: 56.1 avg: 59 median: 58.7 (38%) max: 61 fps
GPU TDP 75 W TDP 105 W TDP 140 W 96% 100% 96%
...
NVIDIA GeForce RTX 4060 Laptop GPU
...
max:
specvp2020 3dsmax-07 1080p + SPECviewperf 2020 - specvp2020 3dsmax-07 1080p
min: 89.6 avg: 91.5 median: 90.7 (41%) max: 94.5 fps
GPU TDP 75 W TDP 105 W TDP 140 W 100% 97% 99%
...
NVIDIA GeForce RTX 4060 Laptop GPU
...
max:
specvp2020 solidworks-05 4k + SPECviewperf 2020 - specvp2020 solidworks-05 4k
97.2 fps (29%)
...
NVIDIA GeForce RTX 4060 Laptop GPU
...
max:
specvp2020 snx-04 4k + SPECviewperf 2020 - specvp2020 snx-04 4k
17.5 fps (2%)
...
NVIDIA GeForce RTX 4060 Laptop GPU
...
max:
specvp2020 medical-03 4k + SPECviewperf 2020 - specvp2020 medical-03 4k
10.9 fps (10%)
...
NVIDIA GeForce RTX 4060 Laptop GPU
...
max:
specvp2020 maya-06 4k + SPECviewperf 2020 - specvp2020 maya-06 4k
188 fps (31%)
...
NVIDIA GeForce RTX 4060 Laptop GPU
max:
specvp2020 energy-03 4k + SPECviewperf 2020 - specvp2020 energy-03 4k
20 fps (4%)
...
NVIDIA GeForce RTX 4060 Laptop GPU
...
max:
specvp2020 creo-03 4k + SPECviewperf 2020 - specvp2020 creo-03 4k
78 fps (37%)
...
NVIDIA GeForce RTX 4060 Laptop GPU
max:
specvp2020 catia-06 4k + SPECviewperf 2020 - specvp2020 catia-06 4k
33.8 fps (22%)
...
NVIDIA GeForce RTX 4060 Laptop GPU
...
max:
specvp2020 3dsmax-07 4k + SPECviewperf 2020 - specvp2020 3dsmax-07 4k
61.6 fps (26%)
...
NVIDIA GeForce RTX 4060 Laptop GPU
...
max:
Cinebench R10 Cinebench R10 Shading (32bit) + Cinebench R10 - Cinebench R10 Shading (32bit)
min: 15515 avg: 15794 median: 15793.5 (11%) max: 16072 Punkte
GPU TDP 105 W TDP 125 W 100% 97%
...
NVIDIA GeForce RTX 4060 Laptop GPU
...
Cinebench R11.5 Cinebench R11.5 OpenGL 64 Bit + Cinebench R11.5 - Cinebench R11.5 OpenGL 64 Bit
min: 3.27 avg: 26.8 median: 26.7 (9%) max: 50.22 fps
GPU TDP 105 W TDP 125 W 7% 100%
...
NVIDIA GeForce RTX 4060 Laptop GPU
...
max:
Cinebench R15 + Cinebench R15 - Cinebench R15 OpenGL 64 Bit
min: 134 avg: 214.5 median: 212.3 (12%) max: 276 fps
GPU TDP ? TDP 45 W TDP 55 W TDP 60 W TDP 65 W TDP 75 W TDP 80 W TDP 100 W TDP 105 W TDP 115 W TDP 120 W TDP 125 W TDP 140 W 100% 78% 92% 83% 75% 63% 81% 75% 78% 75% 89% 97% 89%
...
NVIDIA GeForce RTX 4060 Laptop GPU
...
Cinebench R15 OpenGL Ref. Match 64 Bit + Cinebench R15 - Cinebench R15 OpenGL Ref. Match 64 Bit
99.6 % (100%)
GPU TDP ? TDP 45 W TDP 55 W TDP 60 W TDP 65 W TDP 75 W TDP 80 W TDP 100 W TDP 105 W TDP 115 W TDP 120 W TDP 125 W TDP 140 W 100% 100% 100% 100% 100% 100% 100% 100% 100% 100% 100% 100% 100%
...
NVIDIA GeForce RTX 4060 Laptop GPU
...
GFXBench - GFXBench 5.0 4K Aztec Ruins High Tier Offscreen
107 fps (43%)
...
NVIDIA GeForce RTX 4060 Laptop GPU
GFXBench - GFXBench 5.0 Aztec Ruins High Tier Offscreen
248.5 fps (45%)
...
NVIDIA GeForce RTX 4060 Laptop GPU
GFXBench - GFXBench 5.0 Aztec Ruins Normal Tier Offscreen
666 fps (49%)
...
NVIDIA GeForce RTX 4060 Laptop GPU
GFXBench - GFXBench Car Chase Offscreen
548 fps (62%)
...
NVIDIA GeForce RTX 4060 Laptop GPU
GFXBench 3.1 - GFXBench Manhattan ES 3.1 Offscreen
663 fps (14%)
...
NVIDIA GeForce RTX 4060 Laptop GPU
...
GFXBench 3.0 - GFXBench 3.0 Manhattan Offscreen
845 fps (49%)
...
NVIDIA GeForce RTX 4060 Laptop GPU
...
GFXBench (DX / GLBenchmark) 2.7 + GFXBench (DX / GLBenchmark) 2.7 - GFXBench T-Rex HD Offscreen C24Z16
2508 fps (20%)
...
NVIDIA GeForce RTX 4060 Laptop GPU
...
Basemark GPU 1.2 - Basemark GPU 1.2 Vulkan Official Medium Offscreen 1080
min: 65.1 avg: 315.9 median: 104.6 (1%) max: 1248 fps
GPU TDP 55 W TDP 60 W TDP 65 W TDP 80 W TDP 100 W TDP 105 W TDP 115 W TDP 120 W TDP 125 W TDP 140 W 87% 52% 9% 26% 15% 9% 19% 100% 6% 20%
...
NVIDIA GeForce RTX 4060 Laptop GPU
...
max:
Basemark GPU 1.2 - Basemark GPU 1.2 Vulkan Official High Offscreen 2160
min: 3.64 avg: 4.5 median: 3.6 (1%) max: 9.1 fps
GPU TDP 60 W TDP 65 W TDP 100 W TDP 105 W TDP 140 W 68% 68% 68% 68% 100%
...
NVIDIA GeForce RTX 4060 Laptop GPU
...
Geekbench 6.2 - Geekbench 6.2 GPU OpenCL
min: 4321 avg: 86874 median: 90431 (26%) max: 99975 Punkte
GPU TDP ? TDP 60 W TDP 65 W TDP 75 W TDP 80 W TDP 100 W TDP 105 W TDP 115 W TDP 125 W TDP 140 W 100% 83% 78% 90% 94% 89% 95% 91% 4% 97%
...
NVIDIA GeForce RTX 4060 Laptop GPU
...
max:
Geekbench 6.2 - Geekbench 6.2 GPU Vulkan
min: 4286 avg: 44016 median: 30559 (10%) max: 92895 Punkte
GPU TDP 60 W TDP 65 W TDP 75 W TDP 80 W TDP 100 W TDP 105 W TDP 115 W TDP 125 W TDP 140 W 89% 89% 5% 24% 25% 100% 29% 5% 43%
...
NVIDIA GeForce RTX 4060 Laptop GPU
...
max:
LuxMark v2.0 64Bit - LuxMark v2.0 Room GPU
0 Samples/s (0%)
...
NVIDIA GeForce RTX 4060 Laptop GPU
...
max:
LuxMark v2.0 64Bit - LuxMark v2.0 Sala GPU
0 Samples/s (0%)
...
NVIDIA GeForce RTX 4060 Laptop GPU
...
max:
ComputeMark v2.1 - ComputeMark v2.1 Result
20014 Punkte (22%)
...
NVIDIA GeForce RTX 4060 Laptop GPU
...
max:
Power Consumption - Furmark Stress Test Power Consumption - external Monitor *
min: 71.2 avg: 149.5 median: 151.5 (22%) max: 228 Watt
GPU TDP 45 W TDP 55 W TDP 60 W TDP 65 W TDP 75 W TDP 80 W TDP 100 W TDP 105 W TDP 115 W TDP 120 W TDP 125 W TDP 140 W 126% 123% 121% 123% 117% 119% 116% 111% 115% 113% 100% 104%
...
NVIDIA GeForce RTX 4060 Laptop GPU
...
max:
0 15 30 45 60 75 90 105 120 135 150 165 180 195 210 225 Tooltip MSI Cyborg 15 A12VF: Ø71.2 (67.9-78.6)
Asus ROG Flow Z13 GZ301V: Ø93.7 (85.04-94.38)
Asus ROG Flow X13 GV302XV: Ø87.7 (82.9-89.3)
Asus ZenBook Pro 14 Duo UX8402VV-P1021W: Ø87.8 (22.6-100.8)
Honor MagicBook Pro 16 2024: Ø95.9 (89.9-103)
Dell Inspiron 16 Plus 7630: Ø103.6 (98.1-126.3)
Microsoft Surface Laptop Studio 2 RTX 4060: Ø106.5 (103.2-120.5)
Lenovo Legion Slim 5 16APH8: Ø107.8 (105.6-113.8)
Gigabyte G5 KF: Ø117.2 (114.1-122.37)
Lenovo Legion Slim 7 16APH8: Ø117.8 (107.6-120.1)
Lenovo Yoga Pro 9 16-IRP G8: Ø134.7 (126.9-145.4)
Asus ROG Flow X16 GV601V: Ø136.7 (133.9-140.46)
MSI Katana 17 B13VFK: Ø137.7 (133.7-144)
Gigabyte G6X 9KG (2024): Ø144.8 (120.1-153.6)
SCHENKER XMG Apex 17 (Late 23): Ø151 (146.1-164.8)
Captiva Advanced Gaming I74-121: Ø152.5 (144.19-164.31)
Lenovo Legion Slim 5 14APH8: Ø153.2 (142.9-168.1)
Lenovo LOQ 16IRH8: Ø156.2 (147.38-160.57)
Asus Vivobook Pro 16X K6604JV-MX016W: Ø163.3 (154.8-190.8)
Acer Nitro 17 AN17-51-71ER: Ø166.5 (59.244-199.7)
Medion Erazer Defender P40: Ø176 (168.3-181)
Dell G15 5530: Ø190.7 (183.8-198.1)
Dell G16, i7-13650HX, RTX 4060: Ø190.7 (177.31-196.21)
Acer Predator Helios 16 PH16-71-731Q: Ø196.6 (191.53-202.17)
Alienware m16 R1 Intel: Ø199.4 (195.6-203)
Lenovo Legion Pro 5 16IRX8: Ø199.7 (192.6-206)
Lenovo Legion 5 16IRX G9: Ø202 (191.3-206)
SCHENKER XMG Pro 15 (E23): Ø215 (177.98-228.01)
Colorful EVOL X15 AT 23: Ø213 (195.1-223)
MSI Raider GE68HX 13VF: Ø228 (216-237)
Power Consumption - The Witcher 3 Power Consumption - external Monitor *
min: 86.8 avg: 142.5 median: 150.5 (21%) max: 185.8 Watt
GPU TDP 45 W TDP 55 W TDP 60 W TDP 65 W TDP 75 W TDP 80 W TDP 100 W TDP 105 W TDP 115 W TDP 120 W TDP 125 W TDP 140 W 118% 115% 114% 117% 111% 114% 109% 105% 110% 108% 100% 104%
...
NVIDIA GeForce RTX 4060 Laptop GPU
...
max:
0 15 30 45 60 75 90 105 120 135 150 165 180 195 Tooltip MSI Cyborg 15 A12VF: Ø86.8 (63.9-121.5)
Asus ROG Flow X13 GV302XV: Ø87.9 (86.2-90.5)
Asus ROG Flow Z13 GZ301V: Ø89.9 (84.1-92.53)
Asus ZenBook Pro 14 Duo UX8402VV-P1021W: Ø99.2 (95.4-103.6)
Honor MagicBook Pro 16 2024: Ø99.6 (97.3-101.9)
Captiva Advanced Gaming I74-121: Ø105.3 (101.65-111.16)
Microsoft Surface Laptop Studio 2 RTX 4060: Ø106.5 (101.3-115.3)
Lenovo Legion Slim 5 16APH8: Ø112.1 (104.8-138.2)
Dell Inspiron 16 Plus 7630: Ø120.7 (116.9-127.8)
Gigabyte G5 KF: Ø123.7 (119.28-130.58)
Lenovo Legion Slim 7 16APH8: Ø126.8 (116-135.3)
Asus ROG Flow X16 GV601V: Ø139 (136.06-146.73)
Asus Vivobook Pro 16X K6604JV-MX016W: Ø140.4 (133.2-144.3)
MSI Katana 17 B13VFK: Ø146.1 (136.9-154.4)
Acer Nitro 17 AN17-51-71ER: Ø149.7 (139.79-174.2)
Lenovo Yoga Pro 9 16-IRP G8: Ø150.9 (140.3-166.1)
SCHENKER XMG Apex 17 (Late 23): Ø151.5 (144-167.5)
Lenovo Legion Slim 5 14APH8: Ø153.7 (145.8-169.9)
Lenovo LOQ 16IRH8: Ø158.2 (150.28-166.33)
Gigabyte G6X 9KG (2024): Ø158.5 (150.3-168.6)
Dell G16, i7-13650HX, RTX 4060: Ø164.8 (155.54-171.38)
Medion Erazer Defender P40: Ø168.6 (163.4-181.1)
Acer Predator Helios 16 PH16-71-731Q: Ø171.3 (164.72-183.28)
Lenovo Legion Pro 5 16IRX8: Ø176.3 (173.5-204)
Alienware m16 R1 Intel: Ø178 (168.9-189.6)
Lenovo Legion 5 16IRX G9: Ø181.4 (174.6-188.3)
Colorful EVOL X15 AT 23: Ø181.5 (174.2-193.3)
Dell G15 5530: Ø181.9 (176.7-192.6)
SCHENKER XMG Pro 15 (E23): Ø183.4 (179.28-187.29)
MSI Raider GE68HX 13VF: Ø185.8 (182.5-205)
Power Consumption - Witcher 3 Power Consumption *
min: 87.8 avg: 149.6 median: 153 (34%) max: 191.3 Watt
GPU TDP 45 W TDP 55 W TDP 60 W TDP 65 W TDP 75 W TDP 80 W TDP 100 W TDP 105 W TDP 115 W TDP 120 W TDP 125 W TDP 140 W 138% 134% 132% 139% 124% 129% 121% 113% 120% 119% 100% 108%
...
NVIDIA GeForce RTX 4060 Laptop GPU
...
0 15 30 45 60 75 90 105 120 135 150 165 180 195 210 225 Tooltip Asus ROG Flow Z13 GZ301V: Ø87.8 (74.06-115.04)
MSI Cyborg 15 A12VF: Ø90.3 (84.9-100)
Asus ROG Flow X13 GV302XV: Ø92.6 (91.4-94.7)
Asus ZenBook Pro 14 Duo UX8402VV-P1021W: Ø101.2 (98.3-104.6)
Honor MagicBook Pro 16 2024: Ø107.6 (105.7-111.4)
Lenovo Legion Slim 5 16APH8: Ø112.9 (102.3-131.3)
Microsoft Surface Laptop Studio 2 RTX 4060: Ø113.9 (98.1-123.1)
Dell Inspiron 16 Plus 7630: Ø121.7 (116-127.6)
Gigabyte G5 KF: Ø130.3 (124.42-160.72)
Lenovo Legion Slim 7 16APH8: Ø131 (121.3-141.9)
Asus ROG Flow X16 GV601V: Ø141.9 (136.9-151.47)
SCHENKER XMG Apex 17 (Late 23): Ø147.6 (139.5-156.9)
Asus Vivobook Pro 16X K6604JV-MX016W: Ø147.8 (144.8-151.5)
MSI Katana 17 B13VFK: Ø151.1 (140.5-158.2)
Lenovo Legion Slim 5 14APH8: Ø152 (139.6-157.8)
Acer Nitro 17 AN17-51-71ER: Ø154.4 (142.88-198.5)
Lenovo Yoga Pro 9 16-IRP G8: Ø159.5 (149.6-168)
Captiva Advanced Gaming I74-121: Ø165.1 (153.47-206.55)
Gigabyte G6X 9KG (2024): Ø167.8 (161.9-178.7)
Lenovo LOQ 16IRH8: Ø169 (127.61-225.97)
Acer Predator Helios 16 PH16-71-731Q: Ø175 (162.7-214.92)
Lenovo Legion Pro 5 16IRX8: Ø178.6 (171.9-199.5)
Medion Erazer Defender P40: Ø180.8 (177-192)
Dell G16, i7-13650HX, RTX 4060: Ø185.5 (167.71-218.98)
MSI Raider GE68HX 13VF: Ø185.5 (180.5-193.4)
Dell G15 5530: Ø186 (180.3-205)
Alienware m16 R1 Intel: Ø186.7 (180.6-202)
SCHENKER XMG Pro 15 (E23): Ø188.8 (168.85-204.21)
Colorful EVOL X15 AT 23: Ø189.6 (179.6-207)
Lenovo Legion 5 16IRX G9: Ø191.3 (185.1-199.6)
Power Consumption - Witcher 3 ultra Power Efficiency
min: 0.508 avg: 0.7 median: 0.6 (61%) max: 0.945 fps per Watt
GPU TDP 45 W TDP 60 W TDP 65 W TDP 80 W TDP 100 W TDP 105 W TDP 115 W TDP 120 W TDP 125 W TDP 140 W 91% 89% 100% 76% 60% 69% 73% 79% 54% 64%
...
NVIDIA GeForce RTX 4060 Laptop GPU
...
Power Consumption - Witcher 3 ultra Power Efficiency - external Monitor
min: 0.536 avg: 0.7 median: 0.7 (55%) max: 0.994 fps per Watt
GPU TDP 45 W TDP 60 W TDP 65 W TDP 80 W TDP 100 W TDP 105 W TDP 115 W TDP 120 W TDP 125 W TDP 140 W 97% 95% 100% 83% 65% 73% 80% 83% 58% 72%
...
NVIDIA GeForce RTX 4060 Laptop GPU
...
Emissions Witcher 3 Fan Noise + Emissions - Witcher 3 Fan Noise
min: 41.24 avg: 51.1 median: 52.2 (83%) max: 57 dB(A)
GPU TDP 60 W TDP 65 W TDP 75 W TDP 80 W TDP 100 W TDP 105 W TDP 115 W TDP 120 W TDP 125 W TDP 140 W 89% 80% 100% 94% 97% 97% 87% 92% 96% 94%
...
NVIDIA GeForce RTX 4060 Laptop GPU
...
Clock Speed - GPU Clock Witcher 3 ultra
min: 2370 avg: 2430 median: 2370 (93%) max: 2550 MHz
GPU TDP 105 W TDP 140 W 96% 100%
...
NVIDIA GeForce RTX 4060 Laptop GPU
...
- Bereich der Benchmarkergebnisse für diese Grafikkarte
- Durchschnittliche Benchmarkergebnisse für diese Grafikkarte
* Smaller numbers mean a higher performance
Spiele-Benchmarks Die folgenden Benchmarks basieren auf unseren Spieletests mit Testnotebooks. Die Performance dieser Grafikkarte bei den gelisteten Spielen ist abhängig von der verwendeten CPU, Speicherausstattung, Treiber und auch Betriebssystem. Dadurch müssen die untenstehenden Werte nicht repräsentativ sein. Detaillierte Informationen über das verwendete System sehen Sie nach einem Klick auf den fps-Wert.
NVIDIA GeForce RTX 4060 Laptop GPU
max:
NVIDIA GeForce RTX 4060 Laptop GPU
...
max:
NVIDIA GeForce RTX 4060 Laptop GPU
max:
NVIDIA GeForce RTX 4060 Laptop GPU
max:
NVIDIA GeForce RTX 4060 Laptop GPU
max:
» In Detailstufe hoch mit allen getesteten Notebooks spielbar
NVIDIA GeForce RTX 4060 Laptop GPU
max:
NVIDIA GeForce RTX 4060 Laptop GPU
...
max:
60.6 [X] Razer Blade 14 Mid 23 AMD Ryzen 9 7940HS 4GHz
NVIDIA GeForce RTX 4060 Laptop GPU
min:
45.5 fps, P0.1:
47.5 fps, P1:
50.2 fps, max:
85.8 fps
65.1 [X] SCHENKER XMG Fusion 15 Engineering Sample Intel Core i9-14900HX 1.6GHz
NVIDIA GeForce RTX 4060 Laptop GPU
P0.1:
51 fpsP1:
54.5 fps
~ 63 fps
+ Vergleich
- Vergleich einklappen
+ 📈 Graph
- 📈 Hide Graph
NVIDIA GeForce RTX 4060 Laptop GPU
...
max:
47 [X] Razer Blade 14 Mid 23 AMD Ryzen 9 7940HS 4GHz
NVIDIA GeForce RTX 4060 Laptop GPU
min:
36.8 fps, P0.1:
36.9 fps, P1:
39.3 fps, max:
62.4 fps
47.9 [X] SCHENKER XMG Fusion 15 Engineering Sample Intel Core i9-14900HX 1.6GHz
NVIDIA GeForce RTX 4060 Laptop GPU
P0.1:
36.8 fpsP1:
41.3 fps
~ 47 fps
+ Vergleich
- Vergleich einklappen
+ 📈 Graph
- 📈 Hide Graph
NVIDIA GeForce RTX 4060 Laptop GPU
...
max:
20.1 [X] SCHENKER XMG Fusion 15 Engineering Sample Intel Core i9-14900HX 1.6GHz
NVIDIA GeForce RTX 4060 Laptop GPU
P0.1:
10.8 fpsP1:
15.6 fps
27.6 [X] Razer Blade 14 Mid 23 AMD Ryzen 9 7940HS 4GHz
NVIDIA GeForce RTX 4060 Laptop GPU
min:
23.6 fps, P0.1:
23.6 fps, P1:
24.3 fps, max:
35.5 fps
~ 24 fps
+ Vergleich
- Vergleich einklappen
+ 📈 Graph
- 📈 Hide Graph
NVIDIA GeForce RTX 4060 Laptop GPU
max:
NVIDIA GeForce RTX 4060 Laptop GPU
max:
» In Detailstufe max. mit allen getesteten Notebooks spielbar
NVIDIA GeForce RTX 4060 Laptop GPU
...
max:
NVIDIA GeForce RTX 4060 Laptop GPU
...
max:
NVIDIA GeForce RTX 4060 Laptop GPU
...
max:
NVIDIA GeForce RTX 4060 Laptop GPU
...
max:
NVIDIA GeForce RTX 4060 Laptop GPU
max:
NVIDIA GeForce RTX 4060 Laptop GPU
max:
NVIDIA GeForce RTX 4060 Laptop GPU
max:
» In Detailstufe max. mit allen getesteten Notebooks spielbar
0 100 200 Tooltip G6X 9KG (2024): Ø195.5 (178.3-230)
...
NVIDIA GeForce RTX 4060 Laptop GPU
max:
0 100 200 300 400 500 600 700 800 Tooltip : Ø208 (156.293-817)
G6X 9KG (2024): Ø184.7 (172.6-204)
...
NVIDIA GeForce RTX 4060 Laptop GPU
...
max:
0 100 Tooltip : Ø159.8 (149.13-172.89)
G6X 9KG (2024): Ø164.2 (152.5-186.5)
...
NVIDIA GeForce RTX 4060 Laptop GPU
max:
0 100 Tooltip : Ø121.8 (113.117-126.498)
G6X 9KG (2024): Ø122.8 (114-133.7)
...
NVIDIA GeForce RTX 4060 Laptop GPU
max:
NVIDIA GeForce RTX 4060 Laptop GPU
max:
NVIDIA GeForce RTX 4060 Laptop GPU
max:
» In Detailstufe max. mit allen getesteten Notebooks spielbar
Additional Benchmarks
Very Low Preset 1280x720
218 [X] Gigabyte G6X 9KG (2024) Intel Core i7-13650HX 1.9GHz
NVIDIA GeForce RTX 4060 Laptop GPU
min:
16.9 fps, P0.1:
23.4 fps, P1:
140.5 fps, max:
556 fps
...
NVIDIA GeForce RTX 4060 Laptop GPU
max:
...
NVIDIA GeForce RTX 4060 Laptop GPU
...
max:
...
NVIDIA GeForce RTX 4060 Laptop GPU
...
max:
...
NVIDIA GeForce RTX 4060 Laptop GPU
...
max:
NVIDIA GeForce RTX 4060 Laptop GPU
max:
NVIDIA GeForce RTX 4060 Laptop GPU
max:
NVIDIA GeForce RTX 4060 Laptop GPU
max:
» In Detailstufe max. mit allen getesteten Notebooks spielbar
Additional Benchmarks
Low Preset TAA 1280x720
0 100 Tooltip : Ø119.4 (103.305-131.68)
G6X 9KG (2024): Ø123.8 (116.4-135.4)
...
NVIDIA GeForce RTX 4060 Laptop GPU
max:
0 100 Tooltip : Ø95.9 (87.402-113.3)
G6X 9KG (2024): Ø97.2 (91.3-107.2)
...
NVIDIA GeForce RTX 4060 Laptop GPU
max:
0 100 Tooltip : Ø86.8 (80.141-101.7)
G6X 9KG (2024): Ø88.1 (83-100.8)
...
NVIDIA GeForce RTX 4060 Laptop GPU
max:
0 Tooltip : Ø83.9 (76.343-94.568)
G6X 9KG (2024): Ø85.3 (80.5-96.3)
...
NVIDIA GeForce RTX 4060 Laptop GPU
max:
NVIDIA GeForce RTX 4060 Laptop GPU
max:
NVIDIA GeForce RTX 4060 Laptop GPU
max:
» In Detailstufe max. mit allen getesteten Notebooks spielbar
Additional Benchmarks
Low Preset 1280x720
130 [X] Gigabyte G6X 9KG (2024) Intel Core i7-13650HX 1.9GHz
NVIDIA GeForce RTX 4060 Laptop GPU
min:
43.4 fps, P0.1:
49.2 fps, P1:
64.1 fps, max:
176.8 fps
...
NVIDIA GeForce RTX 4060 Laptop GPU
max:
...
NVIDIA GeForce RTX 4060 Laptop GPU
max:
...
NVIDIA GeForce RTX 4060 Laptop GPU
max:
NVIDIA GeForce RTX 4060 Laptop GPU
max:
NVIDIA GeForce RTX 4060 Laptop GPU
max:
NVIDIA GeForce RTX 4060 Laptop GPU
max:
» In Detailstufe max. mit allen getesteten Notebooks spielbar
...
NVIDIA GeForce RTX 4060 Laptop GPU
max:
...
NVIDIA GeForce RTX 4060 Laptop GPU
max:
...
NVIDIA GeForce RTX 4060 Laptop GPU
max:
NVIDIA GeForce RTX 4060 Laptop GPU
max:
NVIDIA GeForce RTX 4060 Laptop GPU
max:
NVIDIA GeForce RTX 4060 Laptop GPU
max:
» In Detailstufe max. mit allen getesteten Notebooks spielbar
...
NVIDIA GeForce RTX 4060 Laptop GPU
max:
...
NVIDIA GeForce RTX 4060 Laptop GPU
max:
...
NVIDIA GeForce RTX 4060 Laptop GPU
max:
0 100 200 300 400 500 600 700 Tooltip
NVIDIA GeForce RTX 4060 Laptop GPU
max:
NVIDIA GeForce RTX 4060 Laptop GPU
max:
» In Detailstufe max. mit allen getesteten Notebooks spielbar
0 100 200 Tooltip G6X 9KG (2024): Ø217 (166.9-271)
...
NVIDIA GeForce RTX 4060 Laptop GPU
max:
0 100 200 300 Tooltip G6X 9KG (2024): Ø152.2 (118.8-193.4)
: Ø201 (157.97-302.7)
...
NVIDIA GeForce RTX 4060 Laptop GPU
max:
0 100 200 Tooltip G6X 9KG (2024): Ø147.3 (123.3-182.9)
: Ø175.8 (129.098-220.4)
...
NVIDIA GeForce RTX 4060 Laptop GPU
max:
0 100 Tooltip G6X 9KG (2024): Ø131.3 (112.9-152.7)
: Ø135.4 (99.48-156.46)
...
NVIDIA GeForce RTX 4060 Laptop GPU
...
max:
NVIDIA GeForce RTX 4060 Laptop GPU
max:
NVIDIA GeForce RTX 4060 Laptop GPU
max:
NVIDIA GeForce RTX 4060 Laptop GPU
max:
» In Detailstufe max. mit allen getesteten Notebooks spielbar
...
NVIDIA GeForce RTX 4060 Laptop GPU
max:
...
NVIDIA GeForce RTX 4060 Laptop GPU
...
max:
...
NVIDIA GeForce RTX 4060 Laptop GPU
max:
NVIDIA GeForce RTX 4060 Laptop GPU
max:
NVIDIA GeForce RTX 4060 Laptop GPU
max:
NVIDIA GeForce RTX 4060 Laptop GPU
max:
» In Detailstufe max. mit allen getesteten Notebooks spielbar
Additional Benchmarks
Epic Preset + Epic RTX Global Illumination 1920x1080
121.1 [X] Razer Blade 14 Mid 23 AMD Ryzen 9 7940HS 4GHz
NVIDIA GeForce RTX 4060 Laptop GPU
min:
60.6 fps, P0.1:
76.7 fps, P1:
91 fps, max:
169 fps
0 Tooltip EVOL X15 AT 23: Ø77.3 (51-95)
...
NVIDIA GeForce RTX 4060 Laptop GPU
max:
0 Tooltip EVOL X15 AT 23: Ø71.1 (43-92)
...
NVIDIA GeForce RTX 4060 Laptop GPU
max:
0 Tooltip EVOL X15 AT 23: Ø60.8 (38-79)
...
NVIDIA GeForce RTX 4060 Laptop GPU
max:
0 Tooltip EVOL X15 AT 23: Ø45.2 (30-58)
...
NVIDIA GeForce RTX 4060 Laptop GPU
max:
0 Tooltip EVOL X15 AT 23: Ø29.8 (20-36)
NVIDIA GeForce RTX 4060 Laptop GPU
max:
NVIDIA GeForce RTX 4060 Laptop GPU
max:
NVIDIA GeForce RTX 4060 Laptop GPU
max:
» In Detailstufe max. mit den meisten getesteten Laptops spielbar
Additional Benchmarks
Low Preset TAA 1280x720
...
NVIDIA GeForce RTX 4060 Laptop GPU
max:
...
NVIDIA GeForce RTX 4060 Laptop GPU
max:
NVIDIA GeForce RTX 4060 Laptop GPU
max:
65 75 86 91 [X] Razer Blade 14 Mid 23 AMD Ryzen 9 7940HS 4GHz
NVIDIA GeForce RTX 4060 Laptop GPU
min:
69 fps
97 [X] SCHENKER XMG Fusion 15 Engineering Sample Intel Core i9-14900HX 1.6GHz
NVIDIA GeForce RTX 4060 Laptop GPU
~ 83 fps
+ Vergleich
- Vergleich einklappen
NVIDIA GeForce RTX 4060 Laptop GPU
max:
51 56 58 66 [X] Razer Blade 14 Mid 23 AMD Ryzen 9 7940HS 4GHz
NVIDIA GeForce RTX 4060 Laptop GPU
min:
49 fps
69 [X] SCHENKER XMG Fusion 15 Engineering Sample Intel Core i9-14900HX 1.6GHz
NVIDIA GeForce RTX 4060 Laptop GPU
~ 60 fps
+ Vergleich
- Vergleich einklappen
NVIDIA GeForce RTX 4060 Laptop GPU
max:
40 [X] Razer Blade 14 Mid 23 AMD Ryzen 9 7940HS 4GHz
NVIDIA GeForce RTX 4060 Laptop GPU
min:
27 fps
43 [X] SCHENKER XMG Fusion 15 Engineering Sample Intel Core i9-14900HX 1.6GHz
NVIDIA GeForce RTX 4060 Laptop GPU
~ 42 fps
+ Vergleich
- Vergleich einklappen
NVIDIA GeForce RTX 4060 Laptop GPU
max:
NVIDIA GeForce RTX 4060 Laptop GPU
max:
» In Detailstufe max. mit allen getesteten Notebooks spielbar
Additional Benchmarks
Minimum Preset 1280x720
...
NVIDIA GeForce RTX 4060 Laptop GPU
max:
...
NVIDIA GeForce RTX 4060 Laptop GPU
max:
...
NVIDIA GeForce RTX 4060 Laptop GPU
max:
NVIDIA GeForce RTX 4060 Laptop GPU
max:
NVIDIA GeForce RTX 4060 Laptop GPU
max:
NVIDIA GeForce RTX 4060 Laptop GPU
max:
» In Detailstufe max. mit allen getesteten Notebooks spielbar
...
NVIDIA GeForce RTX 4060 Laptop GPU
max:
0 100 200 300 Tooltip Legion Slim 7 16APH8: Ø76 (53.38-326)
: Ø65.8 (52.641-94.9)
...
NVIDIA GeForce RTX 4060 Laptop GPU
max:
0 100 Tooltip Legion Slim 7 16APH8: Ø54.9 (43.019-63.35)
: Ø63.5 (53.998-137.6)
...
NVIDIA GeForce RTX 4060 Laptop GPU
max:
0 100 200 300 Tooltip Legion Slim 7 16APH8: Ø48.1 (27.077-368)
: Ø38.9 (34.722-59.3)
NVIDIA GeForce RTX 4060 Laptop GPU
max:
15 [X] SCHENKER XMG Fusion 15 Engineering Sample Intel Core i9-14900HX 1.6GHz
NVIDIA GeForce RTX 4060 Laptop GPU
P0.1:
5.7 fpsP1:
7.9 fps
16.4 [X] XMG Pro 15 E23 Intel Core i9-13900HX 1.6GHz
NVIDIA GeForce RTX 4060 Laptop GPU
min:
12 fps, P0.1:
12 fps, P1:
12.4 fps, max:
27.4 fps
~ 16 fps
+ Vergleich
- Vergleich einklappen
+ 📈 Graph
- 📈 Hide Graph
NVIDIA GeForce RTX 4060 Laptop GPU
max:
NVIDIA GeForce RTX 4060 Laptop GPU
max:
» In Detailstufe hoch mit allen getesteten Notebooks spielbar
Additional Benchmarks
High Preset + High Ray Tracing 1920x1080
26.3 [X] XMG Pro 15 E23 Intel Core i9-13900HX 1.6GHz
NVIDIA GeForce RTX 4060 Laptop GPU
min:
16.9 fps, P0.1:
17.8 fps, P1:
20.8 fps, max:
40.9 fps
0 100 Tooltip G5 KF: Ø84.8 (72.264-137.2)
...
NVIDIA GeForce RTX 4060 Laptop GPU
max:
0 100 200 300 Tooltip G5 KF: Ø78.9 (59.097-372)
Legion Slim 7 16APH8: Ø72.4 (61.118-119.5)
: Ø83.7 (68.65-216.9)
...
NVIDIA GeForce RTX 4060 Laptop GPU
max:
0 Tooltip G5 KF: Ø52.2 (45.089-85.3)
Legion Slim 7 16APH8: Ø50.2 (44.041-62.3)
: Ø60.2 (50.016-93.4)
...
NVIDIA GeForce RTX 4060 Laptop GPU
...
max:
0 100 200 Tooltip G5 KF: Ø49.6 (30.448-246)
Legion Slim 7 16APH8: Ø40 (31.043-89.4)
: Ø40.2 (35.49-50.4)
...
NVIDIA GeForce RTX 4060 Laptop GPU
max:
0 100 Tooltip Legion Slim 7 16APH8: Ø29.1 (20.214-188.7)
: Ø31 (24.011-124.3)
NVIDIA GeForce RTX 4060 Laptop GPU
max:
NVIDIA GeForce RTX 4060 Laptop GPU
max:
NVIDIA GeForce RTX 4060 Laptop GPU
max:
» In Detailstufe hoch mit allen getesteten Notebooks spielbar
Additional Benchmarks
Low Preset 1280x720
101.6 [X] Gigabyte G5 KF Intel Core i5-12500H 1.8GHz
NVIDIA GeForce RTX 4060 Laptop GPU
min:
36.1 fps, P0.1:
37.7 fps, P1:
73.6 fps, max:
125.9 fps
...
NVIDIA GeForce RTX 4060 Laptop GPU
max:
...
NVIDIA GeForce RTX 4060 Laptop GPU
max:
...
NVIDIA GeForce RTX 4060 Laptop GPU
max:
...
NVIDIA GeForce RTX 4060 Laptop GPU
max:
NVIDIA GeForce RTX 4060 Laptop GPU
max:
» In Detailstufe max. mit allen getesteten Notebooks spielbar
...
NVIDIA GeForce RTX 4060 Laptop GPU
max:
...
NVIDIA GeForce RTX 4060 Laptop GPU
max:
...
NVIDIA GeForce RTX 4060 Laptop GPU
max:
65 83 [X] Gigabyte G5 KF Intel Core i5-12500H 1.8GHz
NVIDIA GeForce RTX 4060 Laptop GPU
min:
17 fps, max:
116 fps
88 [X] SCHENKER XMG Fusion 15 Engineering Sample Intel Core i9-14900HX 1.6GHz
NVIDIA GeForce RTX 4060 Laptop GPU
min:
2 fps, max:
164 fps
89 92 [X] XMG Pro 15 E23 Intel Core i9-13900HX 1.6GHz
NVIDIA GeForce RTX 4060 Laptop GPU
min:
4 fps
93 ~ 85 fps
+ Vergleich
- Vergleich einklappen
...
NVIDIA GeForce RTX 4060 Laptop GPU
...
max:
64 65 68 [X] SCHENKER XMG Fusion 15 Engineering Sample Intel Core i9-14900HX 1.6GHz
NVIDIA GeForce RTX 4060 Laptop GPU
min:
3 fps, max:
176 fps
69 [X] XMG Pro 15 E23 Intel Core i9-13900HX 1.6GHz
NVIDIA GeForce RTX 4060 Laptop GPU
min:
5 fps
72 ~ 68 fps
+ Vergleich
- Vergleich einklappen
...
NVIDIA GeForce RTX 4060 Laptop GPU
max:
37 [X] XMG Pro 15 E23 Intel Core i9-13900HX 1.6GHz
NVIDIA GeForce RTX 4060 Laptop GPU
min:
19 fps
40 [X] SCHENKER XMG Fusion 15 Engineering Sample Intel Core i9-14900HX 1.6GHz
NVIDIA GeForce RTX 4060 Laptop GPU
min:
4 fps, max:
139 fps
~ 39 fps
+ Vergleich
- Vergleich einklappen
NVIDIA GeForce RTX 4060 Laptop GPU
max:
NVIDIA GeForce RTX 4060 Laptop GPU
max:
» In Detailstufe max. mit allen getesteten Notebooks spielbar
Additional Benchmarks
Low Preset (Adaptive Quality Off) 1280x720
122 [X] Gigabyte G5 KF Intel Core i5-12500H 1.8GHz
NVIDIA GeForce RTX 4060 Laptop GPU
min:
7 fps, max:
182 fps
0 100 200 300 400 500 600 700 800 900 1000 1100 1200 1300 1400 1500 1600 1700 1800 1900 2000 2100 2200 2300 2400 2500 2600 2700 2800 2900 3000 3100 3200 3300 3400 3500 3600 3700 3800 3900 4000 4100 4200 4300 4400 4500 4600 4700 4800 4900 5000 5100 5200 5300 5400 5500 5600 5700 5800 5900 6000 6100 6200 6300 6400 6500 6600 6700 6800 6900 7000 7100 7200 7300 7400 7500 7600 7700 7800 7900 8000 8100 8200 Tooltip G5 KF: Ø320 (129.921-8291)
...
NVIDIA GeForce RTX 4060 Laptop GPU
max:
0 100 200 300 Tooltip G5 KF: Ø181.9 (166.163-392)
: Ø169.6 (133.985-235.5)
Legion Slim 7 16APH8: Ø192.2 (177.06-250.7)
NVIDIA GeForce RTX 4060 Laptop GPU
max:
0 100 200 300 400 500 600 700 800 Tooltip G5 KF: Ø163.8 (135.417-858)
: Ø165.9 (134.36-787)
Legion Slim 7 16APH8: Ø157.7 (136.984-171.503)
NVIDIA GeForce RTX 4060 Laptop GPU
max:
0 100 200 300 Tooltip Legion Slim 7 16APH8: Ø144.5 (4.097-202.1)
: Ø133.2 (108.31-152.034)
G5 KF: Ø142.5 (120.407-310.1)
...
NVIDIA GeForce RTX 4060 Laptop GPU
...
max:
0 100 Tooltip Legion Slim 7 16APH8: Ø111.1 (94.148-160)
: Ø124.3 (100.49-156.1)
NVIDIA GeForce RTX 4060 Laptop GPU
max:
NVIDIA GeForce RTX 4060 Laptop GPU
max:
» In Detailstufe max. mit allen getesteten Notebooks spielbar
...
NVIDIA GeForce RTX 4060 Laptop GPU
max:
...
NVIDIA GeForce RTX 4060 Laptop GPU
max:
...
NVIDIA GeForce RTX 4060 Laptop GPU
max:
NVIDIA GeForce RTX 4060 Laptop GPU
max:
NVIDIA GeForce RTX 4060 Laptop GPU
max:
» In Detailstufe max. mit allen getesteten Notebooks spielbar
...
NVIDIA GeForce RTX 4060 Laptop GPU
...
max:
...
NVIDIA GeForce RTX 4060 Laptop GPU
...
max:
...
NVIDIA GeForce RTX 4060 Laptop GPU
...
max:
...
NVIDIA GeForce RTX 4060 Laptop GPU
max:
...
NVIDIA GeForce RTX 4060 Laptop GPU
max:
13.8 23.4 [X] XMG Pro 15 E23 Intel Core i9-13900HX 1.6GHz
NVIDIA GeForce RTX 4060 Laptop GPU
min:
19 fps
23.9 [X] SCHENKER XMG Fusion 15 Engineering Sample Intel Core i9-14900HX 1.6GHz
NVIDIA GeForce RTX 4060 Laptop GPU
min:
20.03 fps, max:
33.16 fps
~ 20 fps
+ Vergleich
- Vergleich einklappen
NVIDIA GeForce RTX 4060 Laptop GPU
max:
NVIDIA GeForce RTX 4060 Laptop GPU
max:
» In Detailstufe max. mit allen getesteten Notebooks spielbar
Additional Benchmarks
Low Preset (FSR off) 1280x720
106.6 [X] Gigabyte G5 KF Intel Core i5-12500H 1.8GHz
NVIDIA GeForce RTX 4060 Laptop GPU
min:
57.1 fps, max:
148.7 fps
Ray Tracing Ultra Preset (DLSS off) 1920x1080
35.8 [X] XMG Pro 15 E23 Intel Core i9-13900HX 1.6GHz
NVIDIA GeForce RTX 4060 Laptop GPU
min:
26 fps
30 [X] Gigabyte G5 KF Intel Core i5-12500H 1.8GHz
NVIDIA GeForce RTX 4060 Laptop GPU
min:
22.5 fps, max:
39.6 fps
Steam Deck 1280x720
Ultra Preset (FSR on) 1920x1080
Ray Tracing Ultra Preset (DLSS off, no Path Tracing) 3840x2160
0 100 200 Tooltip G5 KF: Ø164.4 (144.019-262.3)
XMG Apex 17 (Late 23): Ø191.6 (171.03-241.1)
...
NVIDIA GeForce RTX 4060 Laptop GPU
max:
0 100 200 Tooltip G5 KF: Ø147.6 (129.026-247.7)
XMG Apex 17 (Late 23): Ø166.6 (147.172-200)
: Ø165.7 (145.142-195.38)
...
NVIDIA GeForce RTX 4060 Laptop GPU
max:
0 100 200 Tooltip G5 KF: Ø130 (114.513-167.3)
: Ø144.8 (127.668-174.62)
XMG Apex 17 (Late 23): Ø147.5 (130.05-202.4)
...
NVIDIA GeForce RTX 4060 Laptop GPU
...
max:
0 100 Tooltip G5 KF: Ø107.8 (98.362-127.53)
: Ø129.8 (113.44-175.5)
XMG Apex 17 (Late 23): Ø132.2 (113.225-162.4)
...
NVIDIA GeForce RTX 4060 Laptop GPU
max:
0 100 Tooltip : Ø88.3 (77.61-132)
XMG Apex 17 (Late 23): Ø87.8 (78.011-117.7)
NVIDIA GeForce RTX 4060 Laptop GPU
...
max:
NVIDIA GeForce RTX 4060 Laptop GPU
max:
NVIDIA GeForce RTX 4060 Laptop GPU
max:
» In Detailstufe max. mit allen getesteten Notebooks spielbar
Additional Benchmarks
Low Preset 1280x720
205 [X] Gigabyte G5 KF Intel Core i5-12500H 1.8GHz
NVIDIA GeForce RTX 4060 Laptop GPU
min:
22 fps, P0.1:
59.3 fps, P1:
121.6 fps, max:
280 fps
...
NVIDIA GeForce RTX 4060 Laptop GPU
...
NVIDIA GeForce RTX 4060 Laptop GPU
...
max:
...
NVIDIA GeForce RTX 4060 Laptop GPU
...
max:
...
NVIDIA GeForce RTX 4060 Laptop GPU
max:
NVIDIA GeForce RTX 4060 Laptop GPU
...
max:
NVIDIA GeForce RTX 4060 Laptop GPU
max:
» In Detailstufe max. mit allen getesteten Notebooks spielbar
Additional Benchmarks
Low Preset 1280x720
0 100 Tooltip XMG Apex 17 (Late 23): Ø77.1 (64.617-161.7)
G5 KF: Ø71.3 (64.188-97.77)
...
NVIDIA GeForce RTX 4060 Laptop GPU
max:
0 Tooltip : Ø61.1 (53.152-73.6)
G5 KF: Ø66.3 (54.434-94.6)
XMG Apex 17 (Late 23): Ø63.9 (54.71-87.45)
...
NVIDIA GeForce RTX 4060 Laptop GPU
max:
0 100 Tooltip : Ø48.3 (39.313-63.3)
G5 KF: Ø54 (40.25-133.7)
XMG Apex 17 (Late 23): Ø50.7 (40.038-97.5)
...
NVIDIA GeForce RTX 4060 Laptop GPU
max:
0 100 200 300 400 500 600 700 800 900 1000 1100 1200 1300 1400 1500 1600 1700 1800 1900 2000 2100 2200 2300 2400 2500 2600 2700 2800 2900 3000 3100 3200 3300 3400 3500 3600 3700 3800 3900 4000 4100 4200 4300 4400 4500 4600 4700 4800 4900 5000 5100 5200 5300 5400 5500 5600 5700 5800 5900 6000 6100 6200 6300 6400 6500 6600 6700 6800 6900 7000 7100 7200 7300 7400 7500 7600 7700 7800 7900 8000 8100 8200 8300 8400 8500 8600 8700 8800 8900 9000 9100 9200 9300 9400 9500 9600 9700 9800 9900 Tooltip XMG Apex 17 (Late 23): Ø5370 (34.621-106575)
G5 KF: Ø70.2 (36.857-604)
: Ø51.9 (36.264-164.5)
...
NVIDIA GeForce RTX 4060 Laptop GPU
max:
0 Tooltip : Ø34 (30.137-43.91)
XMG Apex 17 (Late 23): Ø36.1 (28.062-56.2)
NVIDIA GeForce RTX 4060 Laptop GPU
max:
NVIDIA GeForce RTX 4060 Laptop GPU
max:
» In Detailstufe max. mit allen getesteten Notebooks spielbar
Additional Benchmarks
Low Preset 1280x720
96.4 [X] Gigabyte G5 KF Intel Core i5-12500H 1.8GHz
NVIDIA GeForce RTX 4060 Laptop GPU
min:
35.8 fps, P0.1:
43.2 fps, P1:
65.6 fps, max:
138 fps
0 100 Tooltip XMG Apex 17 (Late 23): Ø112.8 (97.585-125.1)
...
NVIDIA GeForce RTX 4060 Laptop GPU
max:
0 100 200 300 400 500 600 700 800 900 1000 1100 1200 1300 1400 1500 1600 1700 1800 Tooltip : Ø104.2 (85.795-131.1)
Legion Slim 7 16APH8: Ø108.3 (87.699-154.5)
XMG Apex 17 (Late 23): Ø182.3 (95.678-1873)
...
NVIDIA GeForce RTX 4060 Laptop GPU
max:
0 100 Tooltip : Ø103.4 (79.138-151.1)
Legion Slim 7 16APH8: Ø105.9 (86.332-124.46)
XMG Apex 17 (Late 23): Ø114.9 (96.715-190.4)
...
NVIDIA GeForce RTX 4060 Laptop GPU
max:
0 100 Tooltip Legion Slim 7 16APH8: Ø99.8 (84.12-133.2)
: Ø105.5 (81.268-152)
XMG Apex 17 (Late 23): Ø105.9 (93.12-151.8)
...
NVIDIA GeForce RTX 4060 Laptop GPU
max:
0 100 Tooltip Legion Slim 7 16APH8: Ø69.5 (61.271-125.1)
: Ø76.8 (70.126-98)
XMG Apex 17 (Late 23): Ø76.6 (67.265-88.78)
NVIDIA GeForce RTX 4060 Laptop GPU
max:
NVIDIA GeForce RTX 4060 Laptop GPU
max:
» In Detailstufe max. mit allen getesteten Notebooks spielbar
Additional Benchmarks
Low Preset 1280x720
0 100 200 300 400 Tooltip m16 R1 Intel: Ø69.3 (49.022-238.8)
XMG Apex 17 (Late 23): Ø78.9 (54.117-473)
...
NVIDIA GeForce RTX 4060 Laptop GPU
max:
0 100 200 Tooltip XMG Apex 17 (Late 23): Ø60.4 (43.968-166.2)
: Ø60.8 (42.769-208.8)
m16 R1 Intel: Ø57.3 (42.958-94.1)
...
NVIDIA GeForce RTX 4060 Laptop GPU
max:
0 100 200 300 Tooltip : Ø55.2 (36.114-348)
XMG Apex 17 (Late 23): Ø47.5 (36.136-65)
m16 R1 Intel: Ø57.6 (39.17-304)
...
NVIDIA GeForce RTX 4060 Laptop GPU
max:
0 Tooltip : Ø32.7 (25.247-68.5)
XMG Apex 17 (Late 23): Ø32.9 (25.12-58.2)
m16 R1 Intel: Ø35.4 (27.216-59.5)
NVIDIA GeForce RTX 4060 Laptop GPU
max:
NVIDIA GeForce RTX 4060 Laptop GPU
max:
NVIDIA GeForce RTX 4060 Laptop GPU
max:
» In Detailstufe max. mit den meisten getesteten Laptops spielbar
Additional Benchmarks
Low 1280x720
96 [X] Alienware m16 R1 Intel Intel Core i7-13700HX 1.5GHz
NVIDIA GeForce RTX 4060 Laptop GPU
min:
18 fps, P0.1:
30.2 fps, P1:
58.7 fps, max:
166.1 fps
0 100 200 Tooltip m16 R1 Intel: Ø151.3 (138.28-196.6)
XMG Apex 17 (Late 23): Ø153.8 (132.763-230.6)
...
NVIDIA GeForce RTX 4060 Laptop GPU
max:
0 100 200 Tooltip : Ø115 (89.066-298)
m16 R1 Intel: Ø144.3 (131.025-240.2)
XMG Apex 17 (Late 23): Ø146.9 (128.02-176.7)
...
NVIDIA GeForce RTX 4060 Laptop GPU
max:
0 100 Tooltip : Ø98.2 (80.059-176)
m16 R1 Intel: Ø135.2 (122.179-157.9)
XMG Apex 17 (Late 23): Ø139.5 (119.11-173.4)
...
NVIDIA GeForce RTX 4060 Laptop GPU
max:
0 100 Tooltip : Ø95.8 (78.591-168.9)
XMG Apex 17 (Late 23): Ø116 (104.72-134.6)
m16 R1 Intel: Ø115.5 (108.141-131.48)
...
NVIDIA GeForce RTX 4060 Laptop GPU
max:
0 100 200 300 400 Tooltip : Ø88.9 (70.17-227)
XMG Apex 17 (Late 23): Ø97.9 (72.55-454)
m16 R1 Intel: Ø80.6 (74.426-88.176)
NVIDIA GeForce RTX 4060 Laptop GPU
max:
NVIDIA GeForce RTX 4060 Laptop GPU
max:
» In Detailstufe max. mit allen getesteten Notebooks spielbar
Additional Benchmarks
Low Preset 1280x720
160.7 [X] Alienware m16 R1 Intel Intel Core i7-13700HX 1.5GHz
NVIDIA GeForce RTX 4060 Laptop GPU
min:
30 fps, P0.1:
64.7 fps, P1:
124.5 fps, max:
206 fps
0 100 Tooltip G5 KF: Ø117.7 (103.347-149.6)
...
NVIDIA GeForce RTX 4060 Laptop GPU
max:
0 100 200 300 400 Tooltip G5 KF: Ø104.5 (85.383-237.8)
Legion Slim 7 16APH8: Ø101.2 (93.99-118.2)
: Ø134.1 (99.47-470)
...
NVIDIA GeForce RTX 4060 Laptop GPU
...
max:
0 100 Tooltip G5 KF: Ø85.8 (71.174-190.6)
Legion Slim 7 16APH8: Ø86.7 (81.356-99)
: Ø97.1 (86.594-199.2)
...
NVIDIA GeForce RTX 4060 Laptop GPU
...
max:
0 100 200 Tooltip G5 KF: Ø80.3 (68.209-158.4)
Legion Slim 7 16APH8: Ø87 (78.41-139.1)
: Ø97.3 (83.011-229.8)
...
NVIDIA GeForce RTX 4060 Laptop GPU
...
max:
0 100 Tooltip Legion Slim 7 16APH8: Ø61.1 (46.548-148)
: Ø63 (56.038-85.3)
NVIDIA GeForce RTX 4060 Laptop GPU
...
max:
NVIDIA GeForce RTX 4060 Laptop GPU
...
max:
NVIDIA GeForce RTX 4060 Laptop GPU
max:
» In Detailstufe max. mit allen getesteten Notebooks spielbar
0 100 200 300 Tooltip XMG Apex 17 (Late 23): Ø90.5 (74.709-142)
m16 R1 Intel: Ø100 (72.117-368)
...
NVIDIA GeForce RTX 4060 Laptop GPU
max:
0 100 Tooltip : Ø80.6 (64.135-180.2)
m16 R1 Intel: Ø77.2 (67.905-99.6)
XMG Apex 17 (Late 23): Ø78.2 (67.085-118.1)
...
NVIDIA GeForce RTX 4060 Laptop GPU
max:
0 Tooltip : Ø62.5 (47.847-82.6)
m16 R1 Intel: Ø63.3 (50.055-81.8)
XMG Apex 17 (Late 23): Ø62.7 (48.313-80.3)
...
NVIDIA GeForce RTX 4060 Laptop GPU
max:
0 100 Tooltip : Ø57.1 (45.81-73.9)
XMG Apex 17 (Late 23): Ø57.2 (45.28-80.3)
m16 R1 Intel: Ø59.1 (46.055-104)
...
NVIDIA GeForce RTX 4060 Laptop GPU
max:
0 100 200 300 400 500 600 700 800 900 1000 1100 Tooltip XMG Apex 17 (Late 23): Ø95.7 (39.142-1186)
: Ø49.3 (38.12-79.1)
m16 R1 Intel: Ø48.5 (39.6-58.55)
NVIDIA GeForce RTX 4060 Laptop GPU
max:
NVIDIA GeForce RTX 4060 Laptop GPU
...
max:
» In Detailstufe max. mit allen getesteten Notebooks spielbar
Additional Benchmarks
Very Low Preset 1280x720
111.2 [X] Alienware m16 R1 Intel Intel Core i7-13700HX 1.5GHz
NVIDIA GeForce RTX 4060 Laptop GPU
min:
49.4 fps, P0.1:
58.1 fps, P1:
99.1 fps, max:
133.3 fps
Very High Preset + Very High Raytracing TAA 1920x1080
44.5 [X] XMG Pro 15 E23 Intel Core i9-13900HX 1.6GHz
NVIDIA GeForce RTX 4060 Laptop GPU
min:
1.318 fps, P0.1:
20.1 fps, P1:
23.2 fps, max:
70.7 fps
42.1 [X] Alienware m16 R1 Intel Intel Core i7-13700HX 1.5GHz
NVIDIA GeForce RTX 4060 Laptop GPU
min:
21 fps, P0.1:
23.8 fps, P1:
27.2 fps, max:
68.1 fps
Very High Preset + Very High Raytracing + DLSS Quality + FG 3840x2160
12 [X] XMG Pro 15 E23 Intel Core i9-13900HX 1.6GHz
NVIDIA GeForce RTX 4060 Laptop GPU
min:
4.07 fps, P0.1:
4.33 fps, P1:
5.25 fps
177.9 213 [X] Gigabyte G5 KF 1030131
Intel Core i5-12500H 1.8GHz
NVIDIA GeForce RTX 4060 Laptop GPU
min:
171 fps, P1:
136 fps, max:
240 fps
221 227 248 [X] Colorful EVOL X15 AT 23 1042581
Intel Core i7-13700HX 1.5GHz
NVIDIA GeForce RTX 4060 Laptop GPU
min:
200 fps, P1:
136 fps, max:
279 fps
249 283 [X] SCHENKER XMG Fusion 15 Engineering Sample 1082038
Intel Core i9-14900HX 1.6GHz
NVIDIA GeForce RTX 4060 Laptop GPU
min:
206 fps, P1:
176 fps, max:
328 fps
291 [X] Alienware m16 R1 Intel 1016022
Intel Core i7-13700HX 1.5GHz
NVIDIA GeForce RTX 4060 Laptop GPU
min:
248 fps, P1:
189 fps, max:
344 fps
306 [X] Lenovo Legion 5 16IRX G9 1057599
Intel Core i7-14650HX 1.6GHz
NVIDIA GeForce RTX 4060 Laptop GPU
min:
251 fps, P1:
194 fps, max:
346 fps
~ 246 fps
+ Vergleich
- Vergleich einklappen
...
NVIDIA GeForce RTX 4060 Laptop GPU
max:
180.7 211 [X] Gigabyte G5 KF 1030131
Intel Core i5-12500H 1.8GHz
NVIDIA GeForce RTX 4060 Laptop GPU
min:
173 fps, P1:
141 fps, max:
235 fps
225 225 234 [X] XMG Pro 15 E23 Intel Core i9-13900HX 1.6GHz
NVIDIA GeForce RTX 4060 Laptop GPU
min:
202 fps
244 250 [X] Colorful EVOL X15 AT 23 1042581
Intel Core i7-13700HX 1.5GHz
NVIDIA GeForce RTX 4060 Laptop GPU
min:
196 fps, P1:
154 fps, max:
281 fps
272 [X] Alienware m16 R1 Intel 1016022
Intel Core i7-13700HX 1.5GHz
NVIDIA GeForce RTX 4060 Laptop GPU
min:
225 fps, P1:
202 fps, max:
312 fps
275 [X] SCHENKER XMG Fusion 15 Engineering Sample 1082038
Intel Core i9-14900HX 1.6GHz
NVIDIA GeForce RTX 4060 Laptop GPU
min:
214 fps, P1:
191 fps, max:
309 fps
292 [X] Lenovo Legion 5 16IRX G9 1057599
Intel Core i7-14650HX 1.6GHz
NVIDIA GeForce RTX 4060 Laptop GPU
min:
214 fps, P1:
199 fps, max:
336 fps
~ 241 fps
+ Vergleich
- Vergleich einklappen
...
NVIDIA GeForce RTX 4060 Laptop GPU
max:
143.7 149.2 157.4 [X] Gigabyte G5 KF 1030131
Intel Core i5-12500H 1.8GHz
NVIDIA GeForce RTX 4060 Laptop GPU
min:
135 fps, P1:
121 fps, max:
173 fps
168.1 169 [X] XMG Pro 15 E23 Intel Core i9-13900HX 1.6GHz
NVIDIA GeForce RTX 4060 Laptop GPU
min:
145 fps
172.7 184 184.1 [X] Colorful EVOL X15 AT 23 1042581
Intel Core i7-13700HX 1.5GHz
NVIDIA GeForce RTX 4060 Laptop GPU
min:
159 fps, P1:
141 fps, max:
204 fps
186.2 187.6 [X] Alienware m16 R1 Intel 1016022
Intel Core i7-13700HX 1.5GHz
NVIDIA GeForce RTX 4060 Laptop GPU
min:
163 fps, P1:
156 fps, max:
208 fps
190.8 [X] SCHENKER XMG Fusion 15 Engineering Sample 1082038
Intel Core i9-14900HX 1.6GHz
NVIDIA GeForce RTX 4060 Laptop GPU
min:
166 fps, P1:
157 fps, max:
210 fps
207 [X] Lenovo Legion 5 16IRX G9 1057599
Intel Core i7-14650HX 1.6GHz
NVIDIA GeForce RTX 4060 Laptop GPU
min:
180 fps, P1:
170 fps, max:
227 fps
~ 175 fps
+ Vergleich
- Vergleich einklappen
...
NVIDIA GeForce RTX 4060 Laptop GPU
max:
43.8 45 51.7 51.8 [X] Gigabyte G5 KF 1038401
Intel Core i5-12500H 1.8GHz
NVIDIA GeForce RTX 4060 Laptop GPU
min:
40 fps, P1:
40 fps, max:
60 fps
54 [X] XMG Pro 15 E23 Intel Core i9-13900HX 1.6GHz
NVIDIA GeForce RTX 4060 Laptop GPU
min:
45 fps
54.1 58.3 [X] Colorful EVOL X15 AT 23 1042581
Intel Core i7-13700HX 1.5GHz
NVIDIA GeForce RTX 4060 Laptop GPU
min:
41 fps, P1:
45 fps, max:
68 fps
59 59.7 [X] SCHENKER XMG Fusion 15 Engineering Sample 1082038
Intel Core i9-14900HX 1.6GHz
NVIDIA GeForce RTX 4060 Laptop GPU
min:
31 fps, P1:
46 fps, max:
70 fps
60.1 63.7 [X] Lenovo Legion 5 16IRX G9 1057599
Intel Core i7-14650HX 1.6GHz
NVIDIA GeForce RTX 4060 Laptop GPU
min:
50 fps, P1:
49 fps, max:
74 fps
119.9 [X] Alienware m16 R1 Intel 1016022
Intel Core i7-13700HX 1.5GHz
NVIDIA GeForce RTX 4060 Laptop GPU
min:
97 fps, P1:
95 fps, max:
136 fps
~ 60 fps
+ Vergleich
- Vergleich einklappen
...
NVIDIA GeForce RTX 4060 Laptop GPU
max:
NVIDIA GeForce RTX 4060 Laptop GPU
max:
17.6 [X] SCHENKER XMG Fusion 15 Engineering Sample 1082038
Intel Core i9-14900HX 1.6GHz
NVIDIA GeForce RTX 4060 Laptop GPU
min:
14 fps, P1:
14 fps, max:
20 fps
18 [X] XMG Pro 15 E23 Intel Core i9-13900HX 1.6GHz
NVIDIA GeForce RTX 4060 Laptop GPU
min:
14 fps
34.2 [X] SCHENKER XMG Fusion 15 Engineering Sample 1082038
Intel Core i9-14900HX 1.6GHz
NVIDIA GeForce RTX 4060 Laptop GPU
min:
19 fps, P1:
26 fps, max:
40 fps
~ 23 fps
+ Vergleich
- Vergleich einklappen
NVIDIA GeForce RTX 4060 Laptop GPU
...
max:
NVIDIA GeForce RTX 4060 Laptop GPU
max:
» In Detailstufe max. mit allen getesteten Notebooks spielbar
Additional Benchmarks
Ultra Low Preset TAA 1280x720
211 [X] Gigabyte G5 KF Intel Core i5-12500H 1.8GHz
NVIDIA GeForce RTX 4060 Laptop GPU
min:
179 fps, P1:
136 fps, max:
242 fps
289 [X] SCHENKER XMG Fusion 15 Engineering Sample Intel Core i9-14900HX 1.6GHz
NVIDIA GeForce RTX 4060 Laptop GPU
min:
222 fps, P1:
186 fps, max:
345 fps
0 100 200 300 400 500 Tooltip G5 KF: Ø241 (194.92-511)
: Ø255 (198.231-309.5)
...
NVIDIA GeForce RTX 4060 Laptop GPU
max:
0 100 200 Tooltip G5 KF: Ø207 (171.08-235.59)
: Ø226 (188.81-251.21)
...
NVIDIA GeForce RTX 4060 Laptop GPU
max:
0 100 200 Tooltip G5 KF: Ø183.4 (147.03-234.8)
: Ø198.4 (162.53-240.4)
...
NVIDIA GeForce RTX 4060 Laptop GPU
max:
0 100 200 300 Tooltip G5 KF: Ø163.8 (124.33-353)
: Ø170.1 (135.268-204.2)
...
NVIDIA GeForce RTX 4060 Laptop GPU
max:
NVIDIA GeForce RTX 4060 Laptop GPU
max:
NVIDIA GeForce RTX 4060 Laptop GPU
max:
NVIDIA GeForce RTX 4060 Laptop GPU
max:
» In Detailstufe max. mit allen getesteten Notebooks spielbar
0 100 200 Tooltip Erazer Defender P40: Ø90.8 (62.946-290)
m16 R1 Intel: Ø89.2 (66.09-105.3)
...
NVIDIA GeForce RTX 4060 Laptop GPU
max:
0 100 200 Tooltip Erazer Defender P40: Ø79 (54.035-280)
m16 R1 Intel: Ø78.7 (64.371-102.2)
: Ø101.2 (73.46-192)
...
NVIDIA GeForce RTX 4060 Laptop GPU
max:
0 100 200 300 400 500 600 700 800 900 1000 1100 1200 1300 Tooltip Erazer Defender P40: Ø67.4 (54.483-86.9)
m16 R1 Intel: Ø117.4 (57.67-1341)
: Ø84.8 (64-185.6)
...
NVIDIA GeForce RTX 4060 Laptop GPU
...
max:
0 Tooltip Erazer Defender P40: Ø64.5 (48.053-92.2)
: Ø65.7 (52.42-81.1)
m16 R1 Intel: Ø67.8 (53.259-74.85)
...
NVIDIA GeForce RTX 4060 Laptop GPU
max:
0 100 Tooltip Erazer Defender P40: Ø40.2 (30.442-53.3)
: Ø44.8 (33.959-148.2)
m16 R1 Intel: Ø47.2 (36.064-92.2)
NVIDIA GeForce RTX 4060 Laptop GPU
...
max:
NVIDIA GeForce RTX 4060 Laptop GPU
max:
» In Detailstufe max. mit allen getesteten Notebooks spielbar
Additional Benchmarks
Low Preset 1280x720
129 [X] Alienware m16 R1 Intel Intel Core i7-13700HX 1.5GHz
NVIDIA GeForce RTX 4060 Laptop GPU
min:
15.9 fps, P0.1:
52.1 fps, P1:
85.3 fps, max:
164.8 fps
Epic Preset + Ray Tracing 1920x1080
48.9 [X] XMG Pro 15 E23 Intel Core i9-13900HX 1.6GHz
NVIDIA GeForce RTX 4060 Laptop GPU
min:
11.8 fps, P0.1:
14.6 fps, P1:
35.6 fps, max:
89.4 fps
52.8 [X] Alienware m16 R1 Intel Intel Core i7-13700HX 1.5GHz
NVIDIA GeForce RTX 4060 Laptop GPU
min:
16.8 fps, P0.1:
22.8 fps, P1:
38 fps, max:
87.2 fps
0 100 200 300 Tooltip Erazer Defender P40: Ø195 (139.928-316.6)
...
NVIDIA GeForce RTX 4060 Laptop GPU
max:
0 100 200 Tooltip Erazer Defender P40: Ø182.4 (147.472-235.9)
: Ø209 (180.27-257.681)
...
NVIDIA GeForce RTX 4060 Laptop GPU
max:
0 100 200 Tooltip Erazer Defender P40: Ø153.8 (122.17-189.5)
: Ø178.7 (149.785-241.3)
...
NVIDIA GeForce RTX 4060 Laptop GPU
max:
0 100 200 Tooltip Erazer Defender P40: Ø155.2 (114.532-208.8)
: Ø169.8 (137.574-282.9)
...
NVIDIA GeForce RTX 4060 Laptop GPU
max:
0 100 Tooltip Erazer Defender P40: Ø98.3 (86.225-108.34)
: Ø105.1 (94.82-131.7)
NVIDIA GeForce RTX 4060 Laptop GPU
max:
NVIDIA GeForce RTX 4060 Laptop GPU
max:
» In Detailstufe max. mit allen getesteten Notebooks spielbar
Additional Benchmarks
Low Preset Low TAA 1280x720
0 100 200 300 Tooltip Cyborg 15 A12VF: Ø86.4 (62.053-310)
...
NVIDIA GeForce RTX 4060 Laptop GPU
...
max:
0 Tooltip Cyborg 15 A12VF: Ø64.6 (53.017-84.38)
...
NVIDIA GeForce RTX 4060 Laptop GPU
...
max:
0 100 Tooltip Cyborg 15 A12VF: Ø61 (48.312-159.5)
...
NVIDIA GeForce RTX 4060 Laptop GPU
max:
0 100 200 300 Tooltip Cyborg 15 A12VF: Ø54.3 (39.019-315)
...
NVIDIA GeForce RTX 4060 Laptop GPU
max:
NVIDIA GeForce RTX 4060 Laptop GPU
...
max:
» In Detailstufe max. mit allen getesteten Notebooks spielbar
0 100 Tooltip Cyborg 15 A12VF: Ø116.2 (97.104-167.2)
Erazer Defender P40: Ø144.8 (91.205-171.2)
...
NVIDIA GeForce RTX 4060 Laptop GPU
max:
0 100 Tooltip Cyborg 15 A12VF: Ø79.5 (68.157-129.8)
Legion Slim 7 16APH8: Ø101.2 (91.386-131.7)
Erazer Defender P40: Ø109.8 (97.454-135.5)
...
NVIDIA GeForce RTX 4060 Laptop GPU
...
max:
0 100 200 300 400 500 Tooltip Cyborg 15 A12VF: Ø89.1 (61.488-587)
Legion Slim 7 16APH8: Ø95 (84.046-111.77)
Erazer Defender P40: Ø102.7 (88.209-138)
...
NVIDIA GeForce RTX 4060 Laptop GPU
...
max:
0 100 200 Tooltip Cyborg 15 A12VF: Ø59.6 (43.25-258)
Legion Slim 7 16APH8: Ø65.9 (59.174-74.07)
Erazer Defender P40: Ø74 (67.4-89.2)
...
NVIDIA GeForce RTX 4060 Laptop GPU
max:
0 100 Tooltip Erazer Defender P40: Ø61 (48.082-193.1)
Legion Slim 7 16APH8: Ø54.4 (45.183-92.9)
NVIDIA GeForce RTX 4060 Laptop GPU
max:
» In Detailstufe max. mit allen getesteten Notebooks spielbar
Additional Benchmarks
Prioritize Performance Preset 1280x720
144.8 [X] MSI Cyborg 15 A12VF Intel Core i7-12650H 1.7GHz
NVIDIA GeForce RTX 4060 Laptop GPU
min:
10.9 fps, P0.1:
40.3 fps, P1:
55 fps, max:
216 fps
...
NVIDIA GeForce RTX 4060 Laptop GPU
max:
...
NVIDIA GeForce RTX 4060 Laptop GPU
max:
...
NVIDIA GeForce RTX 4060 Laptop GPU
max:
...
NVIDIA GeForce RTX 4060 Laptop GPU
max:
NVIDIA GeForce RTX 4060 Laptop GPU
max:
» In Detailstufe max. mit allen getesteten Notebooks spielbar
Additional Benchmarks
Minimum Settings 1280x720
0 100 200 300 400 Tooltip Cyborg 15 A12VF: Ø96.5 (63.172-458)
Katana 17 B13VFK: Ø93.2 (65.079-315)
...
NVIDIA GeForce RTX 4060 Laptop GPU
max:
0 100 200 300 Tooltip Cyborg 15 A12VF: Ø69.6 (48.235-178)
Katana 17 B13VFK: Ø92.6 (63.114-396)
Legion Slim 7 16APH8: Ø88.7 (67.34-178.1)
...
NVIDIA GeForce RTX 4060 Laptop GPU
max:
0 100 200 Tooltip Cyborg 15 A12VF: Ø63.8 (46.033-115.6)
Katana 17 B13VFK: Ø80.9 (62.064-191.5)
Legion Slim 7 16APH8: Ø94.3 (67.214-201.9)
...
NVIDIA GeForce RTX 4060 Laptop GPU
...
max:
0 100 Tooltip Cyborg 15 A12VF: Ø59.7 (46.024-75.3)
Katana 17 B13VFK: Ø76.4 (59.96-101.6)
Legion Slim 7 16APH8: Ø84.9 (65.388-188.4)
...
NVIDIA GeForce RTX 4060 Laptop GPU
max:
0 Tooltip Legion Slim 7 16APH8: Ø60.3 (49.419-89.4)
NVIDIA GeForce RTX 4060 Laptop GPU
max:
» In Detailstufe max. mit allen getesteten Notebooks spielbar
Additional Benchmarks
Ultra Low Preset 1280x720
89.5 [X] MSI Katana 17 B13VFK Intel Core i7-13620H 1.8GHz
NVIDIA GeForce RTX 4060 Laptop GPU
min:
5.74 fps, P0.1:
32 fps, P1:
57.4 fps, max:
175.8 fps
90.6 [X] MSI Cyborg 15 A12VF Intel Core i7-12650H 1.7GHz
NVIDIA GeForce RTX 4060 Laptop GPU
min:
5.11 fps, P0.1:
29.4 fps, P1:
61.8 fps, max:
151.3 fps
0 100 200 Tooltip Cyborg 15 A12VF: Ø136.6 (123.298-186.5)
Katana 17 B13VFK: Ø171.8 (154.182-221.2)
...
NVIDIA GeForce RTX 4060 Laptop GPU
...
max:
0 100 200 Tooltip Cyborg 15 A12VF: Ø108 (95.442-251.6)
Legion Slim 7 16APH8: Ø125.7 (115.734-175.9)
Katana 17 B13VFK: Ø132.3 (105.14-157.6)
...
NVIDIA GeForce RTX 4060 Laptop GPU
...
max:
0 100 Tooltip Cyborg 15 A12VF: Ø67.1 (59.113-186.5)
Katana 17 B13VFK: Ø85.5 (72.314-123.5)
Legion Slim 7 16APH8: Ø87.2 (74.4-127.2)
...
NVIDIA GeForce RTX 4060 Laptop GPU
max:
0 100 Tooltip Cyborg 15 A12VF: Ø51.6 (45.082-76.4)
Legion Slim 7 16APH8: Ø70 (58.014-163.2)
Katana 17 B13VFK: Ø71.4 (60.033-115.9)
...
NVIDIA GeForce RTX 4060 Laptop GPU
...
max:
0 100 Tooltip Legion Slim 7 16APH8: Ø52 (43.083-170.2)
NVIDIA GeForce RTX 4060 Laptop GPU
max:
» In Detailstufe max. mit allen getesteten Notebooks spielbar
Additional Benchmarks
Low Preset 1280x720
172.5 [X] MSI Katana 17 B13VFK Intel Core i7-13620H 1.8GHz
NVIDIA GeForce RTX 4060 Laptop GPU
min:
41.9 fps, P0.1:
64.3 fps, P1:
125.3 fps, max:
206 fps
171.7 [X] MSI Cyborg 15 A12VF Intel Core i7-12650H 1.7GHz
NVIDIA GeForce RTX 4060 Laptop GPU
min:
22.8 fps, P0.1:
122.1 fps, P1:
139.2 fps, max:
225 fps
0 100 Tooltip Predator Helios 16 PH16-71-731Q: Ø84.4 (42-176)
...
NVIDIA GeForce RTX 4060 Laptop GPU
max:
0 100 Tooltip Predator Helios 16 PH16-71-731Q: Ø77.9 (42-149)
...
NVIDIA GeForce RTX 4060 Laptop GPU
...
max:
0 100 Tooltip Predator Helios 16 PH16-71-731Q: Ø72.6 (38-154)
...
NVIDIA GeForce RTX 4060 Laptop GPU
...
max:
0 100 Tooltip Predator Helios 16 PH16-71-731Q: Ø67 (34-140)
...
NVIDIA GeForce RTX 4060 Laptop GPU
...
max:
0 100 Tooltip Predator Helios 16 PH16-71-731Q: Ø59.4 (32-119)
NVIDIA GeForce RTX 4060 Laptop GPU
...
max:
NVIDIA GeForce RTX 4060 Laptop GPU
...
max:
» In Detailstufe max. mit allen getesteten Notebooks spielbar
Additional Benchmarks
Low Preset 1280x720
Epic Preset + Epic Ray-Tracing 1920x1080
0 100 Tooltip Cyborg 15 A12VF: Ø115.1 (96.474-189.1)
Katana 17 B13VFK: Ø152.5 (141.411-180.6)
...
NVIDIA GeForce RTX 4060 Laptop GPU
max:
0 100 Tooltip Cyborg 15 A12VF: Ø90.4 (78.6-101.69)
Katana 17 B13VFK: Ø128.5 (115.079-139.04)
...
NVIDIA GeForce RTX 4060 Laptop GPU
max:
0 100 Tooltip Cyborg 15 A12VF: Ø76.7 (67.152-93.6)
Katana 17 B13VFK: Ø111.4 (97.385-129.8)
...
NVIDIA GeForce RTX 4060 Laptop GPU
max:
0 100 Tooltip Cyborg 15 A12VF: Ø65.9 (52.059-80.4)
Katana 17 B13VFK: Ø95.3 (81.41-119.5)
...
NVIDIA GeForce RTX 4060 Laptop GPU
max:
...
NVIDIA GeForce RTX 4060 Laptop GPU
max:
» In Detailstufe max. mit allen getesteten Notebooks spielbar
Additional Benchmarks
Low Preset Low TAA 1280x720
211 [X] MSI Katana 17 B13VFK Intel Core i7-13620H 1.8GHz
NVIDIA GeForce RTX 4060 Laptop GPU
min:
46.7 fps, P0.1:
62.1 fps, P1:
127 fps, max:
1765 fps
159.8 [X] MSI Cyborg 15 A12VF Intel Core i7-12650H 1.7GHz
NVIDIA GeForce RTX 4060 Laptop GPU
min:
16.8 fps, P0.1:
49.4 fps, P1:
98.1 fps, max:
389 fps
Ultra Preset + Full Ray Tracing High TAA 1920x1080
36.8 [X] MSI Katana 17 B13VFK Intel Core i7-13620H 1.8GHz
NVIDIA GeForce RTX 4060 Laptop GPU
min:
9.9 fps, P0.1:
10.5 fps, P1:
15.5 fps, max:
76.1 fps
26.8 [X] MSI Cyborg 15 A12VF Intel Core i7-12650H 1.7GHz
NVIDIA GeForce RTX 4060 Laptop GPU
min:
12.4 fps, P0.1:
13.8 fps, P1:
15.8 fps, max:
78.5 fps
0 100 Tooltip Cyborg 15 A12VF: Ø64.9 (54.9-84.3)
Erazer Defender P40: Ø89.8 (74.366-108.89)
...
NVIDIA GeForce RTX 4060 Laptop GPU
max:
0 100 200 Tooltip Cyborg 15 A12VF: Ø62.9 (52.335-81.9)
Erazer Defender P40: Ø98.1 (74.45-234.7)
...
NVIDIA GeForce RTX 4060 Laptop GPU
max:
0 100 Tooltip Cyborg 15 A12VF: Ø60.6 (46.405-119.8)
Erazer Defender P40: Ø78.1 (61.437-138.2)
...
NVIDIA GeForce RTX 4060 Laptop GPU
max:
0 100 200 300 400 500 600 700 800 900 1000 1100 1200 Tooltip Cyborg 15 A12VF: Ø116.8 (46.086-1219)
Katana 17 B13VFK: Ø72.4 (59.488-100)
Erazer Defender P40: Ø71.9 (60.05-92.5)
...
NVIDIA GeForce RTX 4060 Laptop GPU
max:
0 100 200 300 400 500 600 700 800 900 1000 1100 1200 1300 1400 1500 1600 1700 1800 1900 2000 2100 2200 2300 2400 2500 2600 2700 2800 2900 3000 3100 3200 3300 3400 3500 3600 3700 3800 3900 4000 4100 4200 4300 4400 4500 4600 4700 4800 4900 5000 5100 5200 5300 5400 5500 5600 5700 5800 5900 6000 6100 6200 6300 6400 6500 6600 6700 6800 6900 7000 7100 7200 7300 7400 7500 7600 7700 7800 7900 8000 8100 8200 8300 8400 8500 8600 8700 8800 8900 9000 9100 9200 9300 9400 9500 9600 9700 9800 9900 Tooltip Katana 17 B13VFK: Ø1722 (38.155-31809)
Erazer Defender P40: Ø234 (39.059-3778)
NVIDIA GeForce RTX 4060 Laptop GPU
max:
0 Tooltip Katana 17 B13VFK: Ø29.7 (18.6-96.4)
...
NVIDIA GeForce RTX 4060 Laptop GPU
max:
» In Detailstufe max. mit allen getesteten Notebooks spielbar
Additional Benchmarks
Low Preset TAA 1280x720
81.3 [X] MSI Cyborg 15 A12VF Intel Core i7-12650H 1.7GHz
NVIDIA GeForce RTX 4060 Laptop GPU
min:
18.5 fps, P0.1:
19.3 fps, P1:
22.7 fps, max:
423 fps
0 100 200 Tooltip Cyborg 15 A12VF: Ø154.7 (136.02-242.3)
Erazer Defender P40: Ø215 (167.18-273.3)
...
NVIDIA GeForce RTX 4060 Laptop GPU
max:
0 100 Tooltip Cyborg 15 A12VF: Ø120.5 (106.495-160.7)
Erazer Defender P40: Ø174.3 (154.108-191.5)
...
NVIDIA GeForce RTX 4060 Laptop GPU
max:
0 100 Tooltip Cyborg 15 A12VF: Ø62.4 (54.173-110.9)
Erazer Defender P40: Ø90.6 (78.08-181.1)
...
NVIDIA GeForce RTX 4060 Laptop GPU
...
max:
0 100 Tooltip Cyborg 15 A12VF: Ø53 (45.495-70.5)
Katana 17 B13VFK: Ø68.9 (59.04-121.6)
Erazer Defender P40: Ø77.9 (64.613-160.8)
...
NVIDIA GeForce RTX 4060 Laptop GPU
...
max:
0 100 Tooltip Katana 17 B13VFK: Ø42.7 (37.137-58.1)
Erazer Defender P40: Ø49.2 (41.503-105.5)
NVIDIA GeForce RTX 4060 Laptop GPU
...
max:
0 Tooltip Katana 17 B13VFK: Ø23.6 (19.003-36.2)
NVIDIA GeForce RTX 4060 Laptop GPU
max:
» In Detailstufe max. mit allen getesteten Notebooks spielbar
Additional Benchmarks
Low Preset / Off 1280x720
201 [X] MSI Cyborg 15 A12VF Intel Core i7-12650H 1.7GHz
NVIDIA GeForce RTX 4060 Laptop GPU
min:
11.3 fps, P0.1:
81.7 fps, P1:
138 fps, max:
291 fps
RT Ultra Preset / On FXAA 1920x1080
22.3 [X] MSI Cyborg 15 A12VF Intel Core i7-12650H 1.7GHz
NVIDIA GeForce RTX 4060 Laptop GPU
min:
10.7 fps, P0.1:
12 fps, P1:
14.9 fps, max:
61.9 fps
0 100 200 300 400 500 Tooltip Cyborg 15 A12VF: Ø170.7 (128.35-272.4)
Katana 17 B13VFK: Ø234 (170.752-526)
...
NVIDIA GeForce RTX 4060 Laptop GPU
max:
0 100 200 300 400 Tooltip Cyborg 15 A12VF: Ø126 (92.28-167.724)
Katana 17 B13VFK: Ø178 (110.005-413)
...
NVIDIA GeForce RTX 4060 Laptop GPU
max:
0 100 Tooltip Cyborg 15 A12VF: Ø95.5 (72.22-124.1)
Katana 17 B13VFK: Ø128.6 (83.994-164.2)
...
NVIDIA GeForce RTX 4060 Laptop GPU
max:
0 100 Tooltip Cyborg 15 A12VF: Ø73.2 (53.58-108)
Katana 17 B13VFK: Ø103.2 (66.972-127.6)
...
NVIDIA GeForce RTX 4060 Laptop GPU
max:
» In Detailstufe max. mit allen getesteten Notebooks spielbar
Additional Benchmarks
Low Preset 1280x720
258 [X] MSI Katana 17 B13VFK Intel Core i7-13620H 1.8GHz
NVIDIA GeForce RTX 4060 Laptop GPU
min:
43 fps, P0.1:
65.4 fps, P1:
146.2 fps, max:
400 fps
221 [X] MSI Cyborg 15 A12VF Intel Core i7-12650H 1.7GHz
NVIDIA GeForce RTX 4060 Laptop GPU
min:
36.1 fps, P0.1:
69.1 fps, P1:
134.1 fps, max:
378 fps
...
NVIDIA GeForce RTX 4060 Laptop GPU
max:
...
NVIDIA GeForce RTX 4060 Laptop GPU
max:
...
NVIDIA GeForce RTX 4060 Laptop GPU
...
max:
...
NVIDIA GeForce RTX 4060 Laptop GPU
...
max:
...
NVIDIA GeForce RTX 4060 Laptop GPU
...
max:
NVIDIA GeForce RTX 4060 Laptop GPU
...
max:
» In Detailstufe max. mit allen getesteten Notebooks spielbar
Additional Benchmarks
Low Preset (without FSR Upscaling) 1280x720
Ultra Preset (without FSR Upscaling) + Full Ray-Tracing 1920x1080
0 100 200 300 Tooltip Cyborg 15 A12VF: Ø120.7 (91.136-351)
Katana 17 B13VFK: Ø130.3 (111.03-163.3)
...
NVIDIA GeForce RTX 4060 Laptop GPU
max:
0 100 Tooltip Cyborg 15 A12VF: Ø95.2 (85.541-107.16)
Katana 17 B13VFK: Ø118.7 (106.03-131.78)
...
NVIDIA GeForce RTX 4060 Laptop GPU
max:
0 100 200 300 Tooltip Cyborg 15 A12VF: Ø88.5 (65.71-373)
Katana 17 B13VFK: Ø110 (86.491-286.3)
...
NVIDIA GeForce RTX 4060 Laptop GPU
max:
0 100 Tooltip Cyborg 15 A12VF: Ø69.3 (56.011-100.3)
Katana 17 B13VFK: Ø101.9 (88.05-135.7)
...
NVIDIA GeForce RTX 4060 Laptop GPU
max:
» In Detailstufe max. mit allen getesteten Notebooks spielbar
Additional Benchmarks
Low Preset 1280x720
131.7 [X] MSI Cyborg 15 A12VF Intel Core i7-12650H 1.7GHz
NVIDIA GeForce RTX 4060 Laptop GPU
min:
23.5 fps, P0.1:
80.2 fps, P1:
99.3 fps, max:
185.5 fps
0 100 Tooltip Cyborg 15 A12VF: Ø91.1 (81.57-119.878)
XMG Apex 17 (Late 23): Ø126 (118.207-139.3)
...
NVIDIA GeForce RTX 4060 Laptop GPU
max:
0 100 Tooltip Cyborg 15 A12VF: Ø83.2 (73.191-104.965)
XMG Apex 17 (Late 23): Ø120.8 (103.36-159.8)
...
NVIDIA GeForce RTX 4060 Laptop GPU
max:
0 100 Tooltip Cyborg 15 A12VF: Ø78.6 (68.033-167.8)
XMG Apex 17 (Late 23): Ø112.8 (106.111-121.3)
...
NVIDIA GeForce RTX 4060 Laptop GPU
max:
0 100 Tooltip Cyborg 15 A12VF: Ø69.4 (61.326-109.9)
Katana 17 B13VFK: Ø78.3 (63.046-92.19)
XMG Apex 17 (Late 23): Ø107.7 (95.278-148.6)
...
NVIDIA GeForce RTX 4060 Laptop GPU
max:
0 100 Tooltip Katana 17 B13VFK: Ø64 (55.27-112.9)
XMG Apex 17 (Late 23): Ø80.8 (71.772-126.7)
...
NVIDIA GeForce RTX 4060 Laptop GPU
...
max:
0 Tooltip Katana 17 B13VFK: Ø39.8 (32.29-62.6)
NVIDIA GeForce RTX 4060 Laptop GPU
...
max:
» In Detailstufe max. mit allen getesteten Notebooks spielbar
Additional Benchmarks
Very Low Preset 1280x720
115.8 [X] MSI Cyborg 15 A12VF Intel Core i7-12650H 1.7GHz
NVIDIA GeForce RTX 4060 Laptop GPU
min:
18.1 fps, P0.1:
22.2 fps, P1:
54.5 fps, max:
215 fps
Very High Preset + Ray-Tracing TAA 1920x0180
35.8 [X] MSI Cyborg 15 A12VF Intel Core i7-12650H 1.7GHz
NVIDIA GeForce RTX 4060 Laptop GPU
min:
12.6 fps, P0.1:
14.4 fps, P1:
23.2 fps, max:
99.2 fps
...
NVIDIA GeForce RTX 4060 Laptop GPU
max:
...
NVIDIA GeForce RTX 4060 Laptop GPU
...
max:
...
NVIDIA GeForce RTX 4060 Laptop GPU
...
max:
...
NVIDIA GeForce RTX 4060 Laptop GPU
max:
NVIDIA GeForce RTX 4060 Laptop GPU
...
max:
NVIDIA GeForce RTX 4060 Laptop GPU
max:
NVIDIA GeForce RTX 4060 Laptop GPU
max:
» In Detailstufe max. mit allen getesteten Notebooks spielbar
Additional Benchmarks
Basic Quality Preset T2X SMAA 1280x720
0 100 200 300 400 500 Tooltip Cyborg 15 A12VF: Ø80 (63.003-175.8)
Katana 17 B13VFK: Ø124.6 (84.025-506)
...
NVIDIA GeForce RTX 4060 Laptop GPU
max:
0 100 Tooltip Cyborg 15 A12VF: Ø72.4 (65.718-83.7)
Katana 17 B13VFK: Ø86.9 (79.048-100.53)
...
NVIDIA GeForce RTX 4060 Laptop GPU
max:
0 Tooltip Cyborg 15 A12VF: Ø69.7 (61.64-78.83)
Katana 17 B13VFK: Ø79.9 (74.105-87.2)
...
NVIDIA GeForce RTX 4060 Laptop GPU
max:
0 100 Tooltip Cyborg 15 A12VF: Ø73.1 (59.631-129.4)
Katana 17 B13VFK: Ø82.2 (71.679-118.9)
...
NVIDIA GeForce RTX 4060 Laptop GPU
max:
» In Detailstufe max. mit allen getesteten Notebooks spielbar
0 100 200 Tooltip Katana 17 B13VFK: Ø106.4 (88.393-209)
...
NVIDIA GeForce RTX 4060 Laptop GPU
max:
0 100 Tooltip Katana 17 B13VFK: Ø88 (74.12-120.1)
...
NVIDIA GeForce RTX 4060 Laptop GPU
max:
0 100 Tooltip Katana 17 B13VFK: Ø76.7 (62.423-121.3)
...
NVIDIA GeForce RTX 4060 Laptop GPU
max:
0 100 Tooltip Katana 17 B13VFK: Ø67.8 (56.299-156.3)
...
NVIDIA GeForce RTX 4060 Laptop GPU
...
max:
» In Detailstufe max. mit allen getesteten Notebooks spielbar
0 100 200 Tooltip Cyborg 15 A12VF: Ø119.5 (100.118-150.93)
Katana 17 B13VFK: Ø160.1 (126.68-212)
...
NVIDIA GeForce RTX 4060 Laptop GPU
max:
0 100 200 300 400 500 600 700 800 900 1000 1100 1200 1300 1400 1500 1600 1700 1800 1900 2000 2100 2200 2300 2400 2500 2600 2700 2800 2900 3000 3100 3200 3300 3400 3500 3600 3700 3800 3900 4000 4100 4200 4300 4400 4500 4600 4700 4800 4900 5000 5100 5200 5300 5400 5500 5600 5700 5800 5900 6000 6100 6200 6300 6400 6500 6600 6700 6800 6900 7000 7100 7200 7300 7400 7500 7600 7700 7800 7900 8000 8100 8200 8300 8400 8500 8600 8700 8800 Tooltip Cyborg 15 A12VF: Ø90.4 (75.258-117.32)
Katana 17 B13VFK: Ø335 (98.7-8891)
...
NVIDIA GeForce RTX 4060 Laptop GPU
max:
0 100 200 300 Tooltip Cyborg 15 A12VF: Ø76.2 (61.233-98.9)
Katana 17 B13VFK: Ø108.7 (83.75-301)
...
NVIDIA GeForce RTX 4060 Laptop GPU
max:
0 100 Tooltip Cyborg 15 A12VF: Ø60.4 (50.037-79.4)
Katana 17 B13VFK: Ø80.7 (68.032-103.5)
...
NVIDIA GeForce RTX 4060 Laptop GPU
max:
» In Detailstufe max. mit allen getesteten Notebooks spielbar
Additional Benchmarks
Low Preset 1280x720
209 [X] MSI Katana 17 B13VFK Intel Core i7-13620H 1.8GHz
NVIDIA GeForce RTX 4060 Laptop GPU
min:
16.4 fps, P0.1:
47.9 fps, P1:
123.8 fps, max:
333 fps
159.8 [X] MSI Cyborg 15 A12VF Intel Core i7-12650H 1.7GHz
NVIDIA GeForce RTX 4060 Laptop GPU
min:
15.8 fps, P0.1:
45.5 fps, P1:
103.1 fps, max:
255 fps
169.8 [X] MSI Cyborg 15 A12VF 959964
Intel Core i7-12650H 1.7GHz
NVIDIA GeForce RTX 4060 Laptop GPU
min:
134 fps, P1:
48 fps, max:
208 fps
197.8 198.3 199.2 203 205 218 220 233 243 244 [X] Dell G15 5530 959964
Intel Core i7-13650HX 1.9GHz
NVIDIA GeForce RTX 4060 Laptop GPU
min:
201 fps, P1:
141 fps, max:
295 fps
245 247 [X] MSI Katana 17 B13VFK 946728
Intel Core i7-13620H 1.8GHz
NVIDIA GeForce RTX 4060 Laptop GPU
min:
179 fps, P1:
135 fps, max:
311 fps
253 [X] Colorful EVOL X15 AT 23 959964
Intel Core i7-13700HX 1.5GHz
NVIDIA GeForce RTX 4060 Laptop GPU
min:
189 fps, P1:
126 fps, max:
314 fps
256 257 [X] Asus ROG Flow X16 GV601V 959964
Intel Core i9-13900H 1.9GHz
NVIDIA GeForce RTX 4060 Laptop GPU
min:
195 fps, P1:
164 fps, max:
280 fps
276 288 [X] MSI Raider GE68HX 13VF 959964
Intel Core i9-13950HX 1.6GHz
NVIDIA GeForce RTX 4060 Laptop GPU
min:
235 fps, P1:
161 fps, max:
345 fps
296 [X] Lenovo Legion 5 16IRX G9 959964
Intel Core i7-14650HX 1.6GHz
NVIDIA GeForce RTX 4060 Laptop GPU
min:
217 fps, P1:
162 fps, max:
372 fps
~ 234 fps
+ Vergleich
- Vergleich einklappen
...
NVIDIA GeForce RTX 4060 Laptop GPU
...
max:
162.3 [X] MSI Cyborg 15 A12VF 959964
Intel Core i7-12650H 1.7GHz
NVIDIA GeForce RTX 4060 Laptop GPU
min:
130 fps, P1:
58 fps, max:
189 fps
184.8 189.2 194.8 199.2 201 217 218 [X] Asus ROG Flow X16 GV601V 959964
Intel Core i9-13900H 1.9GHz
NVIDIA GeForce RTX 4060 Laptop GPU
min:
152 fps, P1:
117 fps, max:
250 fps
218 226 232 235 [X] Dell G15 5530 959964
Intel Core i7-13650HX 1.9GHz
NVIDIA GeForce RTX 4060 Laptop GPU
min:
193 fps, P1:
132 fps, max:
271 fps
235 240 [X] MSI Katana 17 B13VFK 946728
Intel Core i7-13620H 1.8GHz
NVIDIA GeForce RTX 4060 Laptop GPU
min:
188 fps, P1:
131 fps, max:
286 fps
244 253 [X] Colorful EVOL X15 AT 23 959964
Intel Core i7-13700HX 1.5GHz
NVIDIA GeForce RTX 4060 Laptop GPU
min:
196 fps, P1:
129 fps, max:
292 fps
271 [X] MSI Raider GE68HX 13VF 959964
Intel Core i9-13950HX 1.6GHz
NVIDIA GeForce RTX 4060 Laptop GPU
min:
217 fps, P1:
166 fps, max:
306 fps
274 287 [X] Lenovo Legion 5 16IRX G9 959964
Intel Core i7-14650HX 1.6GHz
NVIDIA GeForce RTX 4060 Laptop GPU
min:
232 fps, P1:
168 fps, max:
337 fps
~ 225 fps
+ Vergleich
- Vergleich einklappen
...
NVIDIA GeForce RTX 4060 Laptop GPU
...
max:
124.7 [X] MSI Cyborg 15 A12VF 959964
Intel Core i7-12650H 1.7GHz
NVIDIA GeForce RTX 4060 Laptop GPU
min:
90 fps, P1:
46 fps, max:
149 fps
145.5 146.4 146.8 148.4 148.7 152.8 160 166.8 177.7 [X] Dell G15 5530 959964
Intel Core i7-13650HX 1.9GHz
NVIDIA GeForce RTX 4060 Laptop GPU
min:
158 fps, P1:
104 fps, max:
203 fps
178 179.2 [X] MSI Katana 17 B13VFK 946728
Intel Core i7-13620H 1.8GHz
NVIDIA GeForce RTX 4060 Laptop GPU
min:
145 fps, P1:
66 fps, max:
211 fps
179.8 183.9 [X] Asus ROG Flow X16 GV601V 959964
Intel Core i9-13900H 1.9GHz
NVIDIA GeForce RTX 4060 Laptop GPU
min:
139 fps, P1:
94 fps, max:
216 fps
193.1 194.5 [X] Colorful EVOL X15 AT 23 959964
Intel Core i7-13700HX 1.5GHz
NVIDIA GeForce RTX 4060 Laptop GPU
min:
166 fps, P1:
103 fps, max:
226 fps
196.5 198.4 206 [X] MSI Raider GE68HX 13VF 959964
Intel Core i9-13950HX 1.6GHz
NVIDIA GeForce RTX 4060 Laptop GPU
min:
177 fps, P1:
135 fps, max:
238 fps
208 217 [X] Lenovo Legion 5 16IRX G9 959964
Intel Core i7-14650HX 1.6GHz
NVIDIA GeForce RTX 4060 Laptop GPU
min:
187 fps, P1:
135 fps, max:
248 fps
~ 174 fps
+ Vergleich
- Vergleich einklappen
...
NVIDIA GeForce RTX 4060 Laptop GPU
...
max:
48.7 [X] MSI Cyborg 15 A12VF 959964
Intel Core i7-12650H 1.7GHz
NVIDIA GeForce RTX 4060 Laptop GPU
min:
41 fps, P1:
38 fps, max:
57 fps
49 52.4 52.9 53.8 54.8 55.1 56.7 62.7 64.2 64.8 65.2 65.4 [X] MSI Katana 17 B13VFK 946728
Intel Core i7-13620H 1.8GHz
NVIDIA GeForce RTX 4060 Laptop GPU
min:
52 fps, P1:
44 fps, max:
76 fps
65.5 [X] MSI Raider GE68HX 13VF 959964
Intel Core i9-13950HX 1.6GHz
NVIDIA GeForce RTX 4060 Laptop GPU
min:
56 fps, P1:
53 fps, max:
77 fps
65.7 65.8 65.8 [X] Colorful EVOL X15 AT 23 959964
Intel Core i7-13700HX 1.5GHz
NVIDIA GeForce RTX 4060 Laptop GPU
min:
56 fps, P1:
53 fps, max:
77 fps
66.1 [X] Dell G15 5530 959964
Intel Core i7-13650HX 1.9GHz
NVIDIA GeForce RTX 4060 Laptop GPU
min:
53 fps, P1:
40 fps, max:
78 fps
66.4 70.1 71.4 ~ 61 fps
+ Vergleich
- Vergleich einklappen
...
NVIDIA GeForce RTX 4060 Laptop GPU
...
max:
...
NVIDIA GeForce RTX 4060 Laptop GPU
...
max:
...
NVIDIA GeForce RTX 4060 Laptop GPU
...
max:
» In Detailstufe max. mit allen getesteten Notebooks spielbar
Additional Benchmarks
Ultra Low Preset 16xAF TAA 1280x720
265 [X] MSI Cyborg 15 A12VF Intel Core i7-12650H 1.7GHz
NVIDIA GeForce RTX 4060 Laptop GPU
min:
216 fps, P1:
133 fps, max:
298 fps
304 [X] Dell G15 5530 959964
Intel Core i7-13650HX 1.9GHz
NVIDIA GeForce RTX 4060 Laptop GPU
min:
241 fps, P1:
194 fps, max:
326 fps
0 100 200 Tooltip Katana 17 B13VFK: Ø223 (144.492-274.71)
...
NVIDIA GeForce RTX 4060 Laptop GPU
max:
0 100 200 300 Tooltip Katana 17 B13VFK: Ø212 (166.099-371.2)
...
NVIDIA GeForce RTX 4060 Laptop GPU
max:
0 100 200 300 400 Tooltip Katana 17 B13VFK: Ø197.1 (165.36-461)
...
NVIDIA GeForce RTX 4060 Laptop GPU
max:
» In Detailstufe max. mit allen getesteten Notebooks spielbar
0 100 200 Tooltip Cyborg 15 A12VF: Ø117.9 (89.02-213.3)
...
NVIDIA GeForce RTX 4060 Laptop GPU
max:
0 100 Tooltip Cyborg 15 A12VF: Ø118.2 (94.623-167.1)
...
NVIDIA GeForce RTX 4060 Laptop GPU
...
max:
0 100 200 300 Tooltip Katana 17 B13VFK: Ø80.2 (64.252-387)
Cyborg 15 A12VF: Ø118.3 (93.245-242.3)
...
NVIDIA GeForce RTX 4060 Laptop GPU
...
max:
0 100 200 300 400 500 600 700 800 Tooltip Katana 17 B13VFK: Ø69.9 (63.321-141.5)
Cyborg 15 A12VF: Ø131.4 (88.481-883)
...
NVIDIA GeForce RTX 4060 Laptop GPU
...
max:
0 100 Tooltip Katana 17 B13VFK: Ø40.6 (33.046-131)
NVIDIA GeForce RTX 4060 Laptop GPU
...
max:
0 100 200 300 Tooltip Katana 17 B13VFK: Ø41 (6.881-358)
NVIDIA GeForce RTX 4060 Laptop GPU
...
max:
» In Detailstufe max. mit allen getesteten Notebooks spielbar
Additional Benchmarks
Lowest Settings 1280x720
183.3 [X] MSI Cyborg 15 A12VF Intel Core i7-12650H 1.7GHz
NVIDIA GeForce RTX 4060 Laptop GPU
min:
34.2 fps, P0.1:
57.2 fps, P1:
129 fps, max:
294 fps
Highest Settings + Maximum Ray Tracing 1920x1080
25.7 [X] MSI Katana 17 B13VFK Intel Core i7-13620H 1.8GHz
NVIDIA GeForce RTX 4060 Laptop GPU
min:
12.7 fps, P0.1:
12.8 fps, P1:
13.2 fps, max:
129 fps
46 [X] MSI Cyborg 15 A12VF Intel Core i7-12650H 1.7GHz
NVIDIA GeForce RTX 4060 Laptop GPU
min:
18.7 fps, P0.1:
18.9 fps, P1:
26.2 fps, max:
123.5 fps
...
NVIDIA GeForce RTX 4060 Laptop GPU
max:
...
NVIDIA GeForce RTX 4060 Laptop GPU
max:
...
NVIDIA GeForce RTX 4060 Laptop GPU
...
max:
...
NVIDIA GeForce RTX 4060 Laptop GPU
...
max:
...
NVIDIA GeForce RTX 4060 Laptop GPU
...
max:
NVIDIA GeForce RTX 4060 Laptop GPU
...
max:
» In Detailstufe max. mit allen getesteten Notebooks spielbar
...
NVIDIA GeForce RTX 4060 Laptop GPU
...
max:
...
NVIDIA GeForce RTX 4060 Laptop GPU
...
max:
...
NVIDIA GeForce RTX 4060 Laptop GPU
...
max:
...
NVIDIA GeForce RTX 4060 Laptop GPU
...
max:
...
NVIDIA GeForce RTX 4060 Laptop GPU
...
max:
...
NVIDIA GeForce RTX 4060 Laptop GPU
...
max:
» In Detailstufe max. mit allen getesteten Notebooks spielbar
Additional Benchmarks
Low Preset 1280x720
117.3 [X] Gigabyte G5 KF Intel Core i5-12500H 1.8GHz
NVIDIA GeForce RTX 4060 Laptop GPU
min:
37.3 fps, max:
161.5 fps
138 [X] Dell G15 5530 959964
Intel Core i7-13650HX 1.9GHz
NVIDIA GeForce RTX 4060 Laptop GPU
min:
73.8 fps, max:
174.2 fps
Ray Tracing Ultra Preset (DLSS off) 1920x1080
34.3 [X] Dell G15 5530 959964
Intel Core i7-13650HX 1.9GHz
NVIDIA GeForce RTX 4060 Laptop GPU
min:
27.4 fps, max:
43.4 fps
Ray Tracing Ultra Preset (DLSS off) 3840x2160
0 100 Tooltip Katana 17 B13VFK: Ø119.6 (114.112-145.5)
...
NVIDIA GeForce RTX 4060 Laptop GPU
0 100 Tooltip Katana 17 B13VFK: Ø122.7 (113.061-197.3)
...
NVIDIA GeForce RTX 4060 Laptop GPU
0 100 Tooltip Katana 17 B13VFK: Ø115.9 (103.431-136.1)
...
NVIDIA GeForce RTX 4060 Laptop GPU
0 100 Tooltip Katana 17 B13VFK: Ø101.7 (81.359-169.4)
...
NVIDIA GeForce RTX 4060 Laptop GPU
» In Detailstufe max. mit allen getesteten Notebooks spielbar
Additional Benchmarks
Low / Off 1280x720
117.4 [X] MSI Katana 17 B13VFK Intel Core i7-13620H 1.8GHz
NVIDIA GeForce RTX 4060 Laptop GPU
min:
38.4 fps, P0.1:
46.1 fps, P1:
85.5 fps, max:
202 fps
...
NVIDIA GeForce RTX 4060 Laptop GPU
...
max:
...
NVIDIA GeForce RTX 4060 Laptop GPU
...
max:
...
NVIDIA GeForce RTX 4060 Laptop GPU
...
max:
0 100 200 300 400 500 600 700 800 900 Tooltip Katana 17 B13VFK: Ø137 (102.615-979)
...
NVIDIA GeForce RTX 4060 Laptop GPU
...
max:
0 100 200 300 400 Tooltip Katana 17 B13VFK: Ø112.4 (85.023-481)
...
NVIDIA GeForce RTX 4060 Laptop GPU
max:
0 100 200 300 400 500 Tooltip Katana 17 B13VFK: Ø71.3 (55.427-571)
...
NVIDIA GeForce RTX 4060 Laptop GPU
max:
» In Detailstufe max. mit allen getesteten Notebooks spielbar
Additional Benchmarks
Low Preset 1280x720
0 100 Tooltip Katana 17 B13VFK: Ø65.1 (58.061-133.7)
...
NVIDIA GeForce RTX 4060 Laptop GPU
max:
» In Detailstufe max. mit allen getesteten Notebooks spielbar
...
NVIDIA GeForce RTX 4060 Laptop GPU
max:
...
NVIDIA GeForce RTX 4060 Laptop GPU
...
max:
0 Tooltip Katana 17 B13VFK: Ø67.4 (61.211-79.6)
...
NVIDIA GeForce RTX 4060 Laptop GPU
...
max:
0 Tooltip Katana 17 B13VFK: Ø46.5 (41.013-60.1)
NVIDIA GeForce RTX 4060 Laptop GPU
...
max:
0 Tooltip Katana 17 B13VFK: Ø25.1 (22.142-32)
NVIDIA GeForce RTX 4060 Laptop GPU
...
max:
» In Detailstufe hoch mit allen getesteten Notebooks spielbar
Additional Benchmarks
Low Quality 1280x720
High Quality Raytracing 1920x1080
30.8 [X] MSI Katana 17 B13VFK Intel Core i7-13620H 1.8GHz
NVIDIA GeForce RTX 4060 Laptop GPU
min:
17.5 fps, P0.1:
18.8 fps, P1:
23.7 fps, max:
68.4 fps
...
NVIDIA GeForce RTX 4060 Laptop GPU
max:
...
NVIDIA GeForce RTX 4060 Laptop GPU
...
max:
...
NVIDIA GeForce RTX 4060 Laptop GPU
...
max:
0 100 200 300 400 500 600 700 800 900 1000 1100 1200 1300 1400 1500 1600 1700 1800 1900 2000 2100 2200 2300 2400 2500 2600 2700 2800 2900 3000 3100 3200 3300 3400 3500 3600 3700 3800 3900 4000 Tooltip Katana 17 B13VFK: Ø179.4 (-0.02178-4083)
...
NVIDIA GeForce RTX 4060 Laptop GPU
max:
0 100 200 300 400 500 600 700 Tooltip Katana 17 B13VFK: Ø106.4 (28.09-799.27)
...
NVIDIA GeForce RTX 4060 Laptop GPU
max:
0 100 200 Tooltip Katana 17 B13VFK: Ø57.5 (-0.08728-243.056)
...
NVIDIA GeForce RTX 4060 Laptop GPU
max:
» In Detailstufe max. mit allen getesteten Notebooks spielbar
Additional Benchmarks
Ultra Low Preset (with Fixed Resolution Quality) 1280x720
0 100 200 Tooltip Predator Helios 16 PH16-71-731Q: Ø139.2 (127.67-218)
...
NVIDIA GeForce RTX 4060 Laptop GPU
max:
0 100 200 300 400 500 600 700 Tooltip Cyborg 15 A12VF: Ø85.8 (30.035-761)
Predator Helios 16 PH16-71-731Q: Ø115.3 (104.884-135)
...
NVIDIA GeForce RTX 4060 Laptop GPU
...
max:
0 100 Tooltip Cyborg 15 A12VF: Ø56.1 (48.065-76.2)
Predator Helios 16 PH16-71-731Q: Ø91.7 (82.376-124)
...
NVIDIA GeForce RTX 4060 Laptop GPU
...
max:
0 100 Tooltip Cyborg 15 A12VF: Ø47.8 (36.225-136.4)
Predator Helios 16 PH16-71-731Q: Ø67.4 (57.219-96.8)
Katana 17 B13VFK: Ø73.2 (60.63-102.9)
...
NVIDIA GeForce RTX 4060 Laptop GPU
...
max:
0 100 200 Tooltip Predator Helios 16 PH16-71-731Q: Ø59 (48.08-103.5)
Katana 17 B13VFK: Ø65 (49.055-204.7)
...
NVIDIA GeForce RTX 4060 Laptop GPU
max:
0 100 200 Tooltip Katana 17 B13VFK: Ø44.7 (32.037-203.6)
...
NVIDIA GeForce RTX 4060 Laptop GPU
max:
» In Detailstufe max. mit allen getesteten Notebooks spielbar
Additional Benchmarks
Low Preset 1280x720
59.3 [X] MSI Cyborg 15 A12VF Intel Core i7-12650H 1.7GHz
NVIDIA GeForce RTX 4060 Laptop GPU
min:
10.2 fps, P0.1:
13.6 fps, P1:
18.8 fps, max:
472 fps
69 [X] MSI Cyborg 15 A12VF Intel Core i7-12650H 1.7GHz
NVIDIA GeForce RTX 4060 Laptop GPU
min:
12.1 fps, P0.1:
14.3 fps, P1:
21.6 fps, max:
449 fps
0 100 200 Tooltip Katana 17 B13VFK: Ø150.6 (130.711-208.1)
...
NVIDIA GeForce RTX 4060 Laptop GPU
0 100 Tooltip Katana 17 B13VFK: Ø126.3 (111.005-138.62)
...
NVIDIA GeForce RTX 4060 Laptop GPU
0 100 Tooltip Katana 17 B13VFK: Ø118.5 (108.72-150.7)
...
NVIDIA GeForce RTX 4060 Laptop GPU
» In Detailstufe max. mit allen getesteten Notebooks spielbar
Additional Benchmarks
Low Preset 1920x1080
168.6 [X] MSI Katana 17 B13VFK Intel Core i7-13620H 1.8GHz
NVIDIA GeForce RTX 4060 Laptop GPU
min:
46.3 fps, P0.1:
54.7 fps, P1:
131 fps, max:
276 fps
0 100 Tooltip Katana 17 B13VFK: Ø149 (132.552-181.5)
...
NVIDIA GeForce RTX 4060 Laptop GPU
max:
0 100 200 300 Tooltip Katana 17 B13VFK: Ø136.6 (103.225-393)
...
NVIDIA GeForce RTX 4060 Laptop GPU
max:
0 100 Tooltip Katana 17 B13VFK: Ø113 (78.075-161.4)
...
NVIDIA GeForce RTX 4060 Laptop GPU
» In Detailstufe max. mit allen getesteten Notebooks spielbar
Additional Benchmarks
Ultra Preset + Ray Tracing 1920x1080
85.7 [X] MSI Katana 17 B13VFK Intel Core i7-13620H 1.8GHz
NVIDIA GeForce RTX 4060 Laptop GPU
min:
3.93 fps, P0.1:
17.5 fps, P1:
49.6 fps, max:
263 fps
...
NVIDIA GeForce RTX 4060 Laptop GPU
max:
...
NVIDIA GeForce RTX 4060 Laptop GPU
max:
...
NVIDIA GeForce RTX 4060 Laptop GPU
max:
» In Detailstufe max. mit allen getesteten Notebooks spielbar
...
NVIDIA GeForce RTX 4060 Laptop GPU
max:
...
NVIDIA GeForce RTX 4060 Laptop GPU
max:
...
NVIDIA GeForce RTX 4060 Laptop GPU
max:
...
NVIDIA GeForce RTX 4060 Laptop GPU
max:
» In Detailstufe max. mit allen getesteten Notebooks spielbar
Additional Benchmarks
Low Preset 1920x1080
...
NVIDIA GeForce RTX 4060 Laptop GPU
max:
...
NVIDIA GeForce RTX 4060 Laptop GPU
max:
...
NVIDIA GeForce RTX 4060 Laptop GPU
max:
» In Detailstufe max. mit allen getesteten Notebooks spielbar
Additional Benchmarks
Ultra Preset + Ultra Ray-Tracing 1920x1080
0 100 200 300 Tooltip Katana 17 B13VFK: Ø252 (199.003-337.3)
...
NVIDIA GeForce RTX 4060 Laptop GPU
0 100 200 300 Tooltip Katana 17 B13VFK: Ø203 (161.54-304.9)
...
NVIDIA GeForce RTX 4060 Laptop GPU
0 100 200 Tooltip Katana 17 B13VFK: Ø194.8 (142.839-287.4)
...
NVIDIA GeForce RTX 4060 Laptop GPU
» In Detailstufe max. mit allen getesteten Notebooks spielbar
Additional Benchmarks
Low Preset (DX12) 1920x1080
303 [X] MSI Katana 17 B13VFK Intel Core i7-13620H 1.8GHz
NVIDIA GeForce RTX 4060 Laptop GPU
min:
32.4 fps, P0.1:
66.9 fps, P1:
203 fps, max:
546 fps
...
NVIDIA GeForce RTX 4060 Laptop GPU
...
max:
0 100 Tooltip Katana 17 B13VFK: Ø100.7 (47.26-135.8)
...
NVIDIA GeForce RTX 4060 Laptop GPU
...
max:
0 Tooltip Katana 17 B13VFK: Ø34.9 (9.066-92.43)
...
NVIDIA GeForce RTX 4060 Laptop GPU
...
max:
0 100 200 Tooltip Katana 17 B13VFK: Ø12.8 (2.114-234)
...
NVIDIA GeForce RTX 4060 Laptop GPU
...
max:
» In Detailstufe max. mit allen getesteten Notebooks spielbar
Additional Benchmarks
Ultra Graphics Quality + HD Textures + DXR TAA 1920x1080
71.9 [X] MSI Katana 17 B13VFK Intel Core i7-13620H 1.8GHz
NVIDIA GeForce RTX 4060 Laptop GPU
min:
3.52 fps, P0.1:
11.3 fps, P1:
35.1 fps, max:
126.1 fps
0 100 200 Tooltip Katana 17 B13VFK: Ø152.8 (124.69-201.11)
...
NVIDIA GeForce RTX 4060 Laptop GPU
0 100 Tooltip Katana 17 B13VFK: Ø148.4 (122.585-184.4)
...
NVIDIA GeForce RTX 4060 Laptop GPU
max:
» In Detailstufe hoch mit allen getesteten Notebooks spielbar
Additional Benchmarks
Low Preset 1920x1080
182 [X] MSI Katana 17 B13VFK Intel Core i7-13620H 1.8GHz
NVIDIA GeForce RTX 4060 Laptop GPU
min:
21.1 fps, P0.1:
47.4 fps, P1:
120 fps, max:
346 fps
...
NVIDIA GeForce RTX 4060 Laptop GPU
max:
...
NVIDIA GeForce RTX 4060 Laptop GPU
max:
...
NVIDIA GeForce RTX 4060 Laptop GPU
...
max:
...
NVIDIA GeForce RTX 4060 Laptop GPU
max:
...
NVIDIA GeForce RTX 4060 Laptop GPU
max:
...
NVIDIA GeForce RTX 4060 Laptop GPU
max:
» In Detailstufe max. mit allen getesteten Notebooks spielbar
0 100 Tooltip Katana 17 B13VFK: Ø151.7 (136.583-178.6)
...
NVIDIA GeForce RTX 4060 Laptop GPU
0 100 200 Tooltip Katana 17 B13VFK: Ø136.2 (108.616-220.6)
...
NVIDIA GeForce RTX 4060 Laptop GPU
0 100 Tooltip Katana 17 B13VFK: Ø104.3 (92.409-134.5)
...
NVIDIA GeForce RTX 4060 Laptop GPU
max:
» In Detailstufe max. mit allen getesteten Notebooks spielbar
Additional Benchmarks
Low Preset 1920x1080
167.3 [X] MSI Katana 17 B13VFK Intel Core i7-13620H 1.8GHz
NVIDIA GeForce RTX 4060 Laptop GPU
min:
23.7 fps, P0.1:
42.6 fps, P1:
78.6 fps, max:
374 fps
...
NVIDIA GeForce RTX 4060 Laptop GPU
max:
...
NVIDIA GeForce RTX 4060 Laptop GPU
max:
...
NVIDIA GeForce RTX 4060 Laptop GPU
max:
...
NVIDIA GeForce RTX 4060 Laptop GPU
max:
» In Detailstufe max. mit allen getesteten Notebooks spielbar
Additional Benchmarks
Minimum Settings 1920x1080
0 100 200 Tooltip Katana 17 B13VFK: Ø139.2 (99.787-216.1)
...
NVIDIA GeForce RTX 4060 Laptop GPU
0 100 200 300 400 Tooltip Katana 17 B13VFK: Ø139 (111.092-462)
...
NVIDIA GeForce RTX 4060 Laptop GPU
0 100 Tooltip Katana 17 B13VFK: Ø120.2 (107.327-148.3)
...
NVIDIA GeForce RTX 4060 Laptop GPU
0 100 200 Tooltip Katana 17 B13VFK: Ø120.9 (90.271-259.7)
...
NVIDIA GeForce RTX 4060 Laptop GPU
» In Detailstufe max. mit allen getesteten Notebooks spielbar
...
NVIDIA GeForce RTX 4060 Laptop GPU
max:
...
NVIDIA GeForce RTX 4060 Laptop GPU
max:
...
NVIDIA GeForce RTX 4060 Laptop GPU
max:
...
NVIDIA GeForce RTX 4060 Laptop GPU
max:
» In Detailstufe max. mit allen getesteten Notebooks spielbar
...
NVIDIA GeForce RTX 4060 Laptop GPU
max:
...
NVIDIA GeForce RTX 4060 Laptop GPU
max:
...
NVIDIA GeForce RTX 4060 Laptop GPU
max:
...
NVIDIA GeForce RTX 4060 Laptop GPU
...
max:
» In Detailstufe max. mit allen getesteten Notebooks spielbar
...
NVIDIA GeForce RTX 4060 Laptop GPU
...
max:
...
NVIDIA GeForce RTX 4060 Laptop GPU
...
max:
...
NVIDIA GeForce RTX 4060 Laptop GPU
...
max:
» In Detailstufe max. mit allen getesteten Notebooks spielbar
Additional Benchmarks
Ultra Preset + Ultra Ray Tracing (DX12) 1920x1080
0 100 200 300 Tooltip Katana 17 B13VFK: Ø319 (235.13-379.62)
...
NVIDIA GeForce RTX 4060 Laptop GPU
max:
0 100 200 Tooltip Katana 17 B13VFK: Ø229 (204.96-296.8)
...
NVIDIA GeForce RTX 4060 Laptop GPU
max:
0 100 Tooltip Katana 17 B13VFK: Ø89 (77.274-107.8)
...
NVIDIA GeForce RTX 4060 Laptop GPU
max:
0 Tooltip Katana 17 B13VFK: Ø77.2 (66.76-96.5)
...
NVIDIA GeForce RTX 4060 Laptop GPU
max:
» In Detailstufe max. mit allen getesteten Notebooks spielbar
0 100 200 300 400 Tooltip Katana 17 B13VFK: Ø104.4 (76.587-458)
...
NVIDIA GeForce RTX 4060 Laptop GPU
0 100 Tooltip Katana 17 B13VFK: Ø73.1 (53.01-116)
...
NVIDIA GeForce RTX 4060 Laptop GPU
0 Tooltip Katana 17 B13VFK: Ø54.6 (46.085-68.2)
...
NVIDIA GeForce RTX 4060 Laptop GPU
» In Detailstufe max. mit allen getesteten Notebooks spielbar
0 100 200 300 400 500 600 700 Tooltip Katana 17 B13VFK: Ø116.2 (90.093-767)
...
NVIDIA GeForce RTX 4060 Laptop GPU
max:
0 100 200 300 400 500 600 700 800 900 1000 1100 1200 1300 1400 1500 1600 1700 1800 1900 2000 2100 2200 2300 2400 2500 2600 Tooltip Katana 17 B13VFK: Ø106.8 (71.543-2606)
...
NVIDIA GeForce RTX 4060 Laptop GPU
max:
0 100 200 300 400 500 600 700 800 900 1000 1100 1200 1300 1400 1500 1600 1700 1800 1900 2000 2100 2200 2300 2400 2500 2600 2700 2800 2900 3000 3100 3200 3300 Tooltip Katana 17 B13VFK: Ø108.7 (72.462-3372)
...
NVIDIA GeForce RTX 4060 Laptop GPU
max:
» In Detailstufe max. mit allen getesteten Notebooks spielbar
0 100 200 Tooltip Katana 17 B13VFK: Ø202 (181.993-220.1)
...
NVIDIA GeForce RTX 4060 Laptop GPU
max:
0 100 Tooltip Katana 17 B13VFK: Ø160.4 (148.13-178.45)
...
NVIDIA GeForce RTX 4060 Laptop GPU
max:
0 100 Tooltip Katana 17 B13VFK: Ø152.6 (141.07-176.1)
...
NVIDIA GeForce RTX 4060 Laptop GPU
max:
0 100 Tooltip Katana 17 B13VFK: Ø149.3 (135.568-173.1)
...
NVIDIA GeForce RTX 4060 Laptop GPU
max:
» In Detailstufe max. mit allen getesteten Notebooks spielbar
...
NVIDIA GeForce RTX 4060 Laptop GPU
max:
...
NVIDIA GeForce RTX 4060 Laptop GPU
max:
...
NVIDIA GeForce RTX 4060 Laptop GPU
max:
...
NVIDIA GeForce RTX 4060 Laptop GPU
max:
...
NVIDIA GeForce RTX 4060 Laptop GPU
max:
» In Detailstufe max. mit allen getesteten Notebooks spielbar
...
NVIDIA GeForce RTX 4060 Laptop GPU
...
max:
...
NVIDIA GeForce RTX 4060 Laptop GPU
...
max:
...
NVIDIA GeForce RTX 4060 Laptop GPU
max:
...
NVIDIA GeForce RTX 4060 Laptop GPU
max:
» In Detailstufe max. mit allen getesteten Notebooks spielbar
Additional Benchmarks
Very Low Overall Quality (DX11) 1920x1080
0 100 200 300 Tooltip Katana 17 B13VFK: Ø246 (233.44-372.1)
...
NVIDIA GeForce RTX 4060 Laptop GPU
max:
0 100 Tooltip Katana 17 B13VFK: Ø123.1 (104.266-196.9)
...
NVIDIA GeForce RTX 4060 Laptop GPU
max:
0 100 200 Tooltip Katana 17 B13VFK: Ø100.4 (80.081-232.8)
...
NVIDIA GeForce RTX 4060 Laptop GPU
max:
» In Detailstufe hoch mit allen getesteten Notebooks spielbar
Additional Benchmarks
High Quality Preset & High Ray Tracing Preset (DX12) 1920x1080
55.5 [X] MSI Katana 17 B13VFK Intel Core i7-13620H 1.8GHz
NVIDIA GeForce RTX 4060 Laptop GPU
min:
8.77 fps, P0.1:
13.4 fps, P1:
41.4 fps, max:
119.4 fps
...
NVIDIA GeForce RTX 4060 Laptop GPU
...
max:
...
NVIDIA GeForce RTX 4060 Laptop GPU
...
max:
...
NVIDIA GeForce RTX 4060 Laptop GPU
max:
» In Detailstufe max. mit allen getesteten Notebooks spielbar
Additional Benchmarks
Ultra Quality DXR 16xAF 1920x1080
...
NVIDIA GeForce RTX 4060 Laptop GPU
...
max:
0 100 200 300 400 Tooltip Katana 17 B13VFK: Ø161.4 (116.652-405)
...
NVIDIA GeForce RTX 4060 Laptop GPU
max:
0 100 200 300 Tooltip Katana 17 B13VFK: Ø124.5 (95.561-317.3)
...
NVIDIA GeForce RTX 4060 Laptop GPU
...
max:
0 100 200 300 400 500 600 700 800 900 Tooltip Katana 17 B13VFK: Ø77.5 (5.05-910)
...
NVIDIA GeForce RTX 4060 Laptop GPU
...
max:
» In Detailstufe max. mit allen getesteten Notebooks spielbar
353 367 [X] HP Omen Transcend 14-fb0014 1.47.22.14 D3D12
Intel Core Ultra 7 155H 3.8GHz
NVIDIA GeForce RTX 4060 Laptop GPU
min:
131.4 fps, P1:
252 fps, max:
546 fps
372 375 377 [X] SCHENKER XMG Pro 15 (E23) 1.47.22.14 D3D12
Intel Core i9-13900HX 1.6GHz
NVIDIA GeForce RTX 4060 Laptop GPU
min:
94.2 fps, P1:
296 fps, max:
494 fps
378 [X] Dell Inspiron 16 Plus 7630 1.47.22.14 D3D12
Intel Core i7-13700H 1.8GHz
NVIDIA GeForce RTX 4060 Laptop GPU
min:
190.3 fps, P1:
277 fps, max:
519 fps
379 [X] Gigabyte G5 KF 1.47.22.14 D3D12
Intel Core i5-12500H 1.8GHz
NVIDIA GeForce RTX 4060 Laptop GPU
min:
143.6 fps, P1:
256 fps, max:
601 fps
385 [X] Asus ROG Flow Z13 GZ301V 1.47.22.14 D3D12
Intel Core i9-13900H 1.9GHz
NVIDIA GeForce RTX 4060 Laptop GPU
min:
58.3 fps, P1:
292 fps, max:
613 fps
395 [X] MSI Cyborg 15 A12VF 1.47.22.14 D3D12
Intel Core i7-12650H 1.7GHz
NVIDIA GeForce RTX 4060 Laptop GPU
min:
58.1 fps, P1:
294 fps, max:
623 fps
399 407 [X] Asus ROG Flow X13 GV302XV 1.47.22.14 D3D12
AMD Ryzen 9 7940HS 4GHz
NVIDIA GeForce RTX 4060 Laptop GPU
min:
149.2 fps, P1:
290 fps, max:
682 fps
419 [X] Asus ROG Flow X16 GV601V 1.47.22.14 D3D12
Intel Core i9-13900H 1.9GHz
NVIDIA GeForce RTX 4060 Laptop GPU
min:
81.7 fps, P1:
303 fps, max:
608 fps
420 434 467 [X] Dell G15 5530 1.47.22.14 D3D12
Intel Core i7-13650HX 1.9GHz
NVIDIA GeForce RTX 4060 Laptop GPU
min:
184.6 fps, P1:
348 fps, max:
680 fps
470 473 [X] Medion Erazer Defender P40 1.47.22.14 D3D12
Intel Core i7-13700HX 1.5GHz
NVIDIA GeForce RTX 4060 Laptop GPU
min:
86.4 fps, P1:
335 fps, max:
658 fps
473 [X] Gigabyte G6X 9KG (2024) 1.47.22.14 D3D12
Intel Core i7-13650HX 1.9GHz
NVIDIA GeForce RTX 4060 Laptop GPU
min:
125.1 fps, P1:
283 fps, max:
674 fps
478 478.7 [X] SCHENKER XMG Fusion 15 Engineering Sample Intel Core i9-14900HX 1.6GHz
NVIDIA GeForce RTX 4060 Laptop GPU
480 [X] Colorful EVOL X15 AT 23 1.47.22.14 D3D12
Intel Core i7-13700HX 1.5GHz
NVIDIA GeForce RTX 4060 Laptop GPU
min:
73 fps, P1:
355 fps, max:
666 fps
487 [X] MSI Raider GE68HX 13VF 1.47.22.14 D3D12
Intel Core i9-13950HX 1.6GHz
NVIDIA GeForce RTX 4060 Laptop GPU
min:
21.9 fps, P1:
374 fps, max:
669 fps
508 [X] MSI Katana 17 B13VFK 1.47.22.14 D3D12
Intel Core i7-13620H 1.8GHz
NVIDIA GeForce RTX 4060 Laptop GPU
min:
76.8 fps, P1:
369 fps, max:
741 fps
511 [X] Lenovo LOQ 16IRH8 1.47.22.14 D3D12
Intel Core i7-13620H 1.8GHz
NVIDIA GeForce RTX 4060 Laptop GPU
min:
248 fps, P1:
396 fps, max:
726 fps
580 [X] Alienware m16 R1 Intel 1.47.22.14 D3D12
Intel Core i7-13700HX 1.5GHz
NVIDIA GeForce RTX 4060 Laptop GPU
min:
198.5 fps, P1:
408 fps, max:
857 fps
~ 435 fps
+ Vergleich
- Vergleich einklappen
...
NVIDIA GeForce RTX 4060 Laptop GPU
max:
195.4 196.2 [X] Asus ROG Flow Z13 GZ301V 1.47.22.14 D3D12
Intel Core i9-13900H 1.9GHz
NVIDIA GeForce RTX 4060 Laptop GPU
min:
70.6 fps, P1:
150.8 fps, max:
304 fps
206 [X] MSI Cyborg 15 A12VF 1.47.22.14 D3D12
Intel Core i7-12650H 1.7GHz
NVIDIA GeForce RTX 4060 Laptop GPU
min:
44.9 fps, P1:
160.8 fps, max:
379 fps
220 [X] HP Omen Transcend 14-fb0014 1.47.22.14 D3D12
Intel Core Ultra 7 155H 3.8GHz
NVIDIA GeForce RTX 4060 Laptop GPU
min:
55.7 fps, P1:
174.1 fps, max:
426 fps
226 230 [X] Asus ROG Flow X13 GV302XV 1.47.22.14 D3D12
AMD Ryzen 9 7940HS 4GHz
NVIDIA GeForce RTX 4060 Laptop GPU
min:
116.9 fps, P1:
186.1 fps, max:
352 fps
234 [X] Dell Inspiron 16 Plus 7630 1.47.22.14 D3D12
Intel Core i7-13700H 1.8GHz
NVIDIA GeForce RTX 4060 Laptop GPU
min:
137.3 fps, P1:
187.4 fps, max:
360 fps
242 [X] Lenovo Legion Slim 5 16APH8 1.47.22.14 D3D12
AMD Ryzen 7 7840HS 3.8GHz
NVIDIA GeForce RTX 4060 Laptop GPU
min:
63.3 fps, P1:
197.2 fps, max:
379 fps
253 [X] Gigabyte G5 KF 1.47.22.14 D3D12
Intel Core i5-12500H 1.8GHz
NVIDIA GeForce RTX 4060 Laptop GPU
min:
22.6 fps, P1:
191.5 fps, max:
436 fps
258 263 [X] Gigabyte G6X 9KG (2024) 1.47.22.14 D3D12
Intel Core i7-13650HX 1.9GHz
NVIDIA GeForce RTX 4060 Laptop GPU
min:
84.9 fps, P1:
199.8 fps, max:
493 fps
265 [X] Lenovo Yoga Pro 9 16-IRP G8 1.47.22.14 D3D12
Intel Core i7-13705H 1.8GHz
NVIDIA GeForce RTX 4060 Laptop GPU
min:
47.4 fps, P1:
209 fps, max:
403 fps
266 [X] Asus ROG Flow X16 GV601V 1.47.22.14 D3D12
Intel Core i9-13900H 1.9GHz
NVIDIA GeForce RTX 4060 Laptop GPU
min:
53 fps, P1:
212 fps, max:
410 fps
267 [X] SCHENKER XMG Pro 15 (E23) 1.47.22.14 D3D12
Intel Core i9-13900HX 1.6GHz
NVIDIA GeForce RTX 4060 Laptop GPU
min:
147.3 fps, P1:
220 fps, max:
405 fps
270 [X] MSI Katana 17 B13VFK 1.47.22.14 D3D12
Intel Core i7-13620H 1.8GHz
NVIDIA GeForce RTX 4060 Laptop GPU
min:
12.8 fps, P1:
209 fps, max:
442 fps
272 274 [X] Lenovo LOQ 16IRH8 1.47.22.14 D3D12
Intel Core i7-13620H 1.8GHz
NVIDIA GeForce RTX 4060 Laptop GPU
min:
35 fps, P1:
223 fps, max:
429 fps
276 279 [X] Medion Erazer Defender P40 1.47.22.14 D3D12
Intel Core i7-13700HX 1.5GHz
NVIDIA GeForce RTX 4060 Laptop GPU
min:
111.4 fps, P1:
227 fps, max:
484 fps
279 281 [X] Dell G15 5530 1.47.22.14 D3D12
Intel Core i7-13650HX 1.9GHz
NVIDIA GeForce RTX 4060 Laptop GPU
min:
42.9 fps, P1:
228 fps, max:
473 fps
282 283 [X] Alienware m16 R1 Intel 1.47.22.14 D3D12
Intel Core i7-13700HX 1.5GHz
NVIDIA GeForce RTX 4060 Laptop GPU
min:
15.8 fps, P1:
236 fps, max:
437 fps
288 [X] Colorful EVOL X15 AT 23 1.47.22.14 D3D12
Intel Core i7-13700HX 1.5GHz
NVIDIA GeForce RTX 4060 Laptop GPU
min:
72 fps, P1:
237 fps, max:
424 fps
291 [X] MSI Raider GE68HX 13VF 1.47.22.14 D3D12
Intel Core i9-13950HX 1.6GHz
NVIDIA GeForce RTX 4060 Laptop GPU
min:
22.1 fps, P1:
245 fps, max:
530 fps
291 293.5 [X] SCHENKER XMG Fusion 15 Engineering Sample Intel Core i9-14900HX 1.6GHz
NVIDIA GeForce RTX 4060 Laptop GPU
~ 259 fps
+ Vergleich
- Vergleich einklappen
...
NVIDIA GeForce RTX 4060 Laptop GPU
max:
156.1 [X] Asus ROG Flow Z13 GZ301V 1.47.22.14 D3D12
Intel Core i9-13900H 1.9GHz
NVIDIA GeForce RTX 4060 Laptop GPU
min:
37.6 fps, P1:
111.2 fps, max:
275 fps
160.5 [X] MSI Cyborg 15 A12VF 1.47.22.14 D3D12
Intel Core i7-12650H 1.7GHz
NVIDIA GeForce RTX 4060 Laptop GPU
min:
35 fps, P1:
109.4 fps, max:
333 fps
173.2 [X] HP Omen Transcend 14-fb0014 1.47.22.14 D3D12
Intel Core Ultra 7 155H 3.8GHz
NVIDIA GeForce RTX 4060 Laptop GPU
min:
19.6 fps, P1:
123.9 fps, max:
356 fps
181.8 182 [X] Asus ROG Flow X13 GV302XV 1.47.22.14 D3D12
AMD Ryzen 9 7940HS 4GHz
NVIDIA GeForce RTX 4060 Laptop GPU
min:
59.7 fps, P1:
132.6 fps, max:
300 fps
185.9 [X] Dell Inspiron 16 Plus 7630 1.47.22.14 D3D12
Intel Core i7-13700H 1.8GHz
NVIDIA GeForce RTX 4060 Laptop GPU
min:
60.8 fps, P1:
136.8 fps, max:
325 fps
191 193 [X] Lenovo Legion Slim 5 16APH8 1.47.22.14 D3D12
AMD Ryzen 7 7840HS 3.8GHz
NVIDIA GeForce RTX 4060 Laptop GPU
min:
40.8 fps, P1:
141.8 fps, max:
390 fps
197.9 [X] Gigabyte G5 KF 1.47.22.14 D3D12
Intel Core i5-12500H 1.8GHz
NVIDIA GeForce RTX 4060 Laptop GPU
min:
78.4 fps, P1:
140.8 fps, max:
380 fps
199.3 199.4 208 [X] Lenovo Legion Slim 7 16APH8 1.47.22.14 D3D12
AMD Ryzen 7 7840HS 3.8GHz
NVIDIA GeForce RTX 4060 Laptop GPU
min:
43.1 fps, P1:
149.7 fps, max:
378 fps
209 [X] Gigabyte G6X 9KG (2024) 1.47.22.14 D3D12
Intel Core i7-13650HX 1.9GHz
NVIDIA GeForce RTX 4060 Laptop GPU
min:
97 fps, P1:
150 fps, max:
488 fps
213 [X] SCHENKER XMG Pro 15 (E23) 1.47.22.14 D3D12
Intel Core i9-13900HX 1.6GHz
NVIDIA GeForce RTX 4060 Laptop GPU
min:
91.2 fps, P1:
154.9 fps, max:
378 fps
214 [X] Lenovo Yoga Pro 9 16-IRP G8 1.47.22.14 D3D12
Intel Core i7-13705H 1.8GHz
NVIDIA GeForce RTX 4060 Laptop GPU
min:
72.7 fps, P1:
150.4 fps, max:
391 fps
215 216 [X] MSI Katana 17 B13VFK 1.47.22.14 D3D12
Intel Core i7-13620H 1.8GHz
NVIDIA GeForce RTX 4060 Laptop GPU
min:
32.4 fps, P1:
156.3 fps, max:
432 fps
218 [X] Lenovo LOQ 16IRH8 1.47.22.14 D3D12
Intel Core i7-13620H 1.8GHz
NVIDIA GeForce RTX 4060 Laptop GPU
min:
36.7 fps, P1:
157.2 fps, max:
403 fps
219 221 [X] Medion Erazer Defender P40 1.47.22.14 D3D12
Intel Core i7-13700HX 1.5GHz
NVIDIA GeForce RTX 4060 Laptop GPU
min:
63.2 fps, P1:
158.7 fps, max:
456 fps
221 222 [X] Dell G15 5530 1.47.22.14 D3D12
Intel Core i7-13650HX 1.9GHz
NVIDIA GeForce RTX 4060 Laptop GPU
min:
85 fps, P1:
160.4 fps, max:
404 fps
223 [X] Alienware m16 R1 Intel 1.47.22.14 D3D12
Intel Core i7-13700HX 1.5GHz
NVIDIA GeForce RTX 4060 Laptop GPU
min:
142 fps, P1:
161.5 fps, max:
369 fps
225 [X] Asus ROG Flow X16 GV601V 1.47.22.14 D3D12
Intel Core i9-13900H 1.9GHz
NVIDIA GeForce RTX 4060 Laptop GPU
min:
15.4 fps, P1:
159.8 fps, max:
408 fps
225 [X] Colorful EVOL X15 AT 23 1.47.22.14 D3D12
Intel Core i7-13700HX 1.5GHz
NVIDIA GeForce RTX 4060 Laptop GPU
min:
128.8 fps, P1:
161.7 fps, max:
415 fps
225.2 [X] SCHENKER XMG Fusion 15 Engineering Sample Intel Core i9-14900HX 1.6GHz
NVIDIA GeForce RTX 4060 Laptop GPU
227 [X] Acer Nitro 17 AN17-51-71ER 1.47.22.14 D3D12
Intel Core i7-13700H 1.8GHz
NVIDIA GeForce RTX 4060 Laptop GPU
min:
60.8 fps, P1:
157.5 fps, max:
475 fps
228 230 [X] Lenovo Legion Slim 5 14APH8 1.47.22.14 D3D12
AMD Ryzen 7 7840HS 3.8GHz
NVIDIA GeForce RTX 4060 Laptop GPU
min:
130.3 fps, P1:
166.4 fps, max:
395 fps
232 [X] MSI Raider GE68HX 13VF 1.47.22.14 D3D12
Intel Core i9-13950HX 1.6GHz
NVIDIA GeForce RTX 4060 Laptop GPU
min:
36.3 fps, P1:
165.2 fps, max:
517 fps
243 ~ 208 fps
+ Vergleich
- Vergleich einklappen
...
NVIDIA GeForce RTX 4060 Laptop GPU
...
max:
135.3 [X] Asus ROG Flow Z13 GZ301V 1.47.22.14 D3D12
Intel Core i9-13900H 1.9GHz
NVIDIA GeForce RTX 4060 Laptop GPU
min:
16 fps, P1:
97 fps, max:
251 fps
137.3 [X] MSI Cyborg 15 A12VF 1.47.22.14 D3D12
Intel Core i7-12650H 1.7GHz
NVIDIA GeForce RTX 4060 Laptop GPU
min:
59.3 fps, P1:
93 fps, max:
293 fps
151.1 [X] HP Omen Transcend 14-fb0014 1.47.22.14 D3D12
Intel Core Ultra 7 155H 3.8GHz
NVIDIA GeForce RTX 4060 Laptop GPU
min:
81.6 fps, P1:
109.2 fps, max:
315 fps
155.2 157.9 [X] Asus ROG Flow X13 GV302XV 1.47.22.14 D3D12
AMD Ryzen 9 7940HS 4GHz
NVIDIA GeForce RTX 4060 Laptop GPU
min:
38.7 fps, P1:
116 fps, max:
280 fps
161 [X] Dell Inspiron 16 Plus 7630 1.47.22.14 D3D12
Intel Core i7-13700H 1.8GHz
NVIDIA GeForce RTX 4060 Laptop GPU
min:
79.8 fps, P1:
120.7 fps, max:
281 fps
165 165.4 168.2 [X] Lenovo Legion Slim 5 16APH8 1.47.22.14 D3D12
AMD Ryzen 7 7840HS 3.8GHz
NVIDIA GeForce RTX 4060 Laptop GPU
min:
38.3 fps, P1:
126.4 fps, max:
287 fps
169.3 172.1 [X] Gigabyte G5 KF 1.47.22.14 D3D12
Intel Core i5-12500H 1.8GHz
NVIDIA GeForce RTX 4060 Laptop GPU
min:
71.6 fps, P1:
126.4 fps, max:
390 fps
180.8 182.2 [X] Gigabyte G6X 9KG (2024) 1.47.22.14 D3D12
Intel Core i7-13650HX 1.9GHz
NVIDIA GeForce RTX 4060 Laptop GPU
min:
56.5 fps, P1:
132.3 fps, max:
381 fps
183.3 [X] SCHENKER XMG Pro 15 (E23) 1.47.22.14 D3D12
Intel Core i9-13900HX 1.6GHz
NVIDIA GeForce RTX 4060 Laptop GPU
min:
43.8 fps, P1:
135 fps, max:
381 fps
184.1 185.1 [X] MSI Katana 17 B13VFK 1.47.22.14 D3D12
Intel Core i7-13620H 1.8GHz
NVIDIA GeForce RTX 4060 Laptop GPU
min:
15.5 fps, P1:
136.7 fps, max:
435 fps
185.2 186.9 [X] Lenovo LOQ 16IRH8 1.47.22.14 D3D12
Intel Core i7-13620H 1.8GHz
NVIDIA GeForce RTX 4060 Laptop GPU
min:
46.3 fps, P1:
136.1 fps, max:
335 fps
187.9 188.3 [X] Medion Erazer Defender P40 1.47.22.14 D3D12
Intel Core i7-13700HX 1.5GHz
NVIDIA GeForce RTX 4060 Laptop GPU
min:
28 fps, P1:
137.1 fps, max:
408 fps
189.6 [X] Dell G15 5530 1.47.22.14 D3D12
Intel Core i7-13650HX 1.9GHz
NVIDIA GeForce RTX 4060 Laptop GPU
min:
28.6 fps, P1:
138.5 fps, max:
373 fps
190.1 190.3 [X] Alienware m16 R1 Intel 1.47.22.14 D3D12
Intel Core i7-13700HX 1.5GHz
NVIDIA GeForce RTX 4060 Laptop GPU
min:
52.8 fps, P1:
139.4 fps, max:
320 fps
192 [X] Colorful EVOL X15 AT 23 1.47.22.14 D3D12
Intel Core i7-13700HX 1.5GHz
NVIDIA GeForce RTX 4060 Laptop GPU
min:
69.9 fps, P1:
140.1 fps, max:
320 fps
192.5 [X] Asus ROG Flow X16 GV601V 1.47.22.14 D3D12
Intel Core i9-13900H 1.9GHz
NVIDIA GeForce RTX 4060 Laptop GPU
min:
23.6 fps, P1:
138.1 fps, max:
318 fps
194 [X] MSI Raider GE68HX 13VF 1.47.22.14 D3D12
Intel Core i9-13950HX 1.6GHz
NVIDIA GeForce RTX 4060 Laptop GPU
min:
36.6 fps, P1:
141.5 fps, max:
398 fps
194.9 194.9 [X] SCHENKER XMG Fusion 15 Engineering Sample Intel Core i9-14900HX 1.6GHz
NVIDIA GeForce RTX 4060 Laptop GPU
195.2 [X] Acer Nitro 17 AN17-51-71ER 1.47.22.14 D3D12
Intel Core i7-13700H 1.8GHz
NVIDIA GeForce RTX 4060 Laptop GPU
min:
34.4 fps, P1:
140.1 fps, max:
527 fps
197.9 [X] Lenovo Legion Slim 5 14APH8 1.47.22.14 D3D12
AMD Ryzen 7 7840HS 3.8GHz
NVIDIA GeForce RTX 4060 Laptop GPU
min:
60.8 fps, P1:
145.5 fps, max:
297 fps
210 ~ 179 fps
+ Vergleich
- Vergleich einklappen
...
NVIDIA GeForce RTX 4060 Laptop GPU
...
max:
102 [X] HP Omen Transcend 14-fb0014 1.47.22.14 D3D12
Intel Core Ultra 7 155H 3.8GHz
NVIDIA GeForce RTX 4060 Laptop GPU
min:
5 fps, P1:
81.5 fps, max:
311 fps
105.8 [X] Asus ROG Flow X13 GV302XV 1.47.22.14 D3D12
AMD Ryzen 9 7940HS 4GHz
NVIDIA GeForce RTX 4060 Laptop GPU
min:
82.2 fps, P1:
86.9 fps, max:
204 fps
110.9 [X] Dell Inspiron 16 Plus 7630 1.47.22.14 D3D12
Intel Core i7-13700H 1.8GHz
NVIDIA GeForce RTX 4060 Laptop GPU
min:
68.7 fps, P1:
89.9 fps, max:
244 fps
112 115.1 120.5 123.5 123.7 [X] Lenovo Yoga Pro 9 16-IRP G8 1.47.22.14 D3D12
Intel Core i7-13705H 1.8GHz
NVIDIA GeForce RTX 4060 Laptop GPU
min:
60 fps, P1:
100.6 fps, max:
292 fps
126.4 [X] MSI Katana 17 B13VFK 1.47.22.14 D3D12
Intel Core i7-13620H 1.8GHz
NVIDIA GeForce RTX 4060 Laptop GPU
min:
31.6 fps, P1:
98.8 fps, max:
343 fps
126.4 [X] Medion Erazer Defender P40 1.47.22.14 D3D12
Intel Core i7-13700HX 1.5GHz
NVIDIA GeForce RTX 4060 Laptop GPU
min:
16.6 fps, P1:
100.6 fps, max:
395 fps
126.9 127.4 [X] Colorful EVOL X15 AT 23 1.47.22.14 D3D12
Intel Core i7-13700HX 1.5GHz
NVIDIA GeForce RTX 4060 Laptop GPU
min:
43.7 fps, P1:
104.4 fps, max:
484 fps
127.5 [X] SCHENKER XMG Pro 15 (E23) 1.47.22.14 D3D12
Intel Core i9-13900HX 1.6GHz
NVIDIA GeForce RTX 4060 Laptop GPU
min:
8.6 fps, P1:
104.8 fps, max:
277 fps
128.5 [X] Alienware m16 R1 Intel 1.47.22.14 D3D12
Intel Core i7-13700HX 1.5GHz
NVIDIA GeForce RTX 4060 Laptop GPU
min:
88.2 fps, P1:
103.1 fps, max:
270 fps
129 129.2 129.3 [X] Acer Nitro 17 AN17-51-71ER 1.47.22.14 D3D12
Intel Core i7-13700H 1.8GHz
NVIDIA GeForce RTX 4060 Laptop GPU
min:
59.9 fps, P1:
102.7 fps, max:
282 fps
129.6 [X] SCHENKER XMG Fusion 15 Engineering Sample Intel Core i9-14900HX 1.6GHz
NVIDIA GeForce RTX 4060 Laptop GPU
130 131.7 ~ 123 fps
+ Vergleich
- Vergleich einklappen
...
NVIDIA GeForce RTX 4060 Laptop GPU
...
max:
...
NVIDIA GeForce RTX 4060 Laptop GPU
...
max:
» In Detailstufe max. mit allen getesteten Notebooks spielbar
0 100 200 Tooltip Inspiron 16 Plus 7630: Ø132.6 (102-162)
ROG Flow X13 GV302XV: Ø134.9 (92-176)
Omen Transcend 14-fb0014: Ø144.6 (111-183)
Omen Transcend 14-fb0014: Ø144.6 (111-183)
G5 KF: Ø150.5 (101-186)
EVOL X15 AT 23: Ø162 (110-203)
XMG Apex 17 (Late 23): Ø163.4 (116-211)
Erazer Defender P40: Ø166.6 (124-206)
Cyborg 15 A12VF: Ø168.4 (100-205)
G15 5530: Ø167.8 (132-214)
Raider GE68HX 13VF: Ø191.1 (140-243)
m16 R1 Intel: Ø198.8 (128-268)
...
NVIDIA GeForce RTX 4060 Laptop GPU
max:
0 100 Tooltip ROG Flow X13 GV302XV: Ø115.3 (88-146)
Cyborg 15 A12VF: Ø115.7 (100-136)
Inspiron 16 Plus 7630: Ø120.3 (89-152)
Omen Transcend 14-fb0014: Ø120.9 (98-144)
Omen Transcend 14-fb0014: Ø120.9 (98-144)
G5 KF: Ø124.5 (94-158)
Erazer Defender P40: Ø142 (108-180)
XMG Apex 17 (Late 23): Ø145.2 (116-189)
EVOL X15 AT 23: Ø146.1 (103-191)
G15 5530: Ø151.7 (92-193)
Raider GE68HX 13VF: Ø158.1 (123-197)
m16 R1 Intel: Ø163.2 (127-198)
...
NVIDIA GeForce RTX 4060 Laptop GPU
max:
0 100 Tooltip Cyborg 15 A12VF: Ø109.1 (98-128)
ROG Flow X13 GV302XV: Ø109.4 (92-138)
Omen Transcend 14-fb0014: Ø114 (96-137)
Omen Transcend 14-fb0014: Ø114 (96-137)
Inspiron 16 Plus 7630: Ø114.7 (74-142)
G5 KF: Ø118.7 (96-155)
Vivobook Pro 16X K6604JV-MX016W: Ø129.2 (92-152)
Erazer Defender P40: Ø136.3 (109-177)
XMG Apex 17 (Late 23): Ø139.2 (111-180)
EVOL X15 AT 23: Ø140.9 (97-180)
G15 5530: Ø146 (122-180)
Raider GE68HX 13VF: Ø147.2 (113-181)
Nitro 17 AN17-51-71ER: Ø151.1 (127-179)
m16 R1 Intel: Ø155.2 (122-190)
...
NVIDIA GeForce RTX 4060 Laptop GPU
max:
0 100 Tooltip Cyborg 15 A12VF: Ø101.7 (82-122)
Inspiron 16 Plus 7630: Ø102.9 (74-134)
ROG Flow X13 GV302XV: Ø102.6 (79-130)
Omen Transcend 14-fb0014: Ø106.5 (86-130)
Omen Transcend 14-fb0014: Ø106.5 (86-130)
G5 KF: Ø109.6 (86-143)
Vivobook Pro 16X K6604JV-MX016W: Ø122.6 (85-147)
Erazer Defender P40: Ø128.1 (100-167)
XMG Apex 17 (Late 23): Ø129.8 (100-169)
Katana 17 B13VFK: Ø133.6 (109-164)
EVOL X15 AT 23: Ø135 (106-173)
Raider GE68HX 13VF: Ø138.4 (97-178)
G15 5530: Ø139.3 (90-172)
Nitro 17 AN17-51-71ER: Ø141.5 (115-169)
m16 R1 Intel: Ø145.5 (105-180)
...
NVIDIA GeForce RTX 4060 Laptop GPU
...
max:
0 100 Tooltip ROG Flow X13 GV302XV: Ø77.1 (60-94)
Omen Transcend 14-fb0014: Ø79.6 (70-97)
Omen Transcend 14-fb0014: Ø79.6 (70-97)
Inspiron 16 Plus 7630: Ø82.5 (74-95)
Vivobook Pro 16X K6604JV-MX016W: Ø93.5 (84-112)
Katana 17 B13VFK: Ø99 (84-116)
Nitro 17 AN17-51-71ER: Ø100.8 (91-117)
EVOL X15 AT 23: Ø101.4 (86-119)
Erazer Defender P40: Ø101.7 (92-119)
XMG Apex 17 (Late 23): Ø105.6 (96-122)
m16 R1 Intel: Ø107.2 (95-122)
...
NVIDIA GeForce RTX 4060 Laptop GPU
max:
0 Tooltip Omen Transcend 14-fb0014: Ø38.9 (34-50)
Omen Transcend 14-fb0014: Ø38.9 (34-50)
ROG Flow X13 GV302XV: Ø40.1 (36-45)
Katana 17 B13VFK: Ø51.4 (45-60)
...
NVIDIA GeForce RTX 4060 Laptop GPU
...
max:
» In Detailstufe max. mit allen getesteten Notebooks spielbar
Additional Benchmarks
Low Preset TAA 1920x1080
139 [X] Gigabyte G5 KF Intel Core i5-12500H 1.8GHz
NVIDIA GeForce RTX 4060 Laptop GPU
min:
109 fps, max:
170 fps
166 [X] Dell G15 5530 959964
Intel Core i7-13650HX 1.9GHz
NVIDIA GeForce RTX 4060 Laptop GPU
min:
129 fps, max:
208 fps
...
NVIDIA GeForce RTX 4060 Laptop GPU
...
max:
...
NVIDIA GeForce RTX 4060 Laptop GPU
...
max:
...
NVIDIA GeForce RTX 4060 Laptop GPU
...
max:
...
NVIDIA GeForce RTX 4060 Laptop GPU
...
max:
» In Detailstufe hoch mit allen getesteten Notebooks spielbar
...
NVIDIA GeForce RTX 4060 Laptop GPU
...
max:
...
NVIDIA GeForce RTX 4060 Laptop GPU
...
max:
...
NVIDIA GeForce RTX 4060 Laptop GPU
...
max:
...
NVIDIA GeForce RTX 4060 Laptop GPU
...
max:
...
NVIDIA GeForce RTX 4060 Laptop GPU
...
max:
» In Detailstufe max. mit allen getesteten Notebooks spielbar
0 100 200 300 400 500 Tooltip ROG Flow X13 GV302XV: Ø354 (325-404)
G15 5530: Ø407 (356-491)
EVOL X15 AT 23: Ø450 (417-519)
Predator Helios 16 PH16-71-731Q: Ø466 (415-520)
...
NVIDIA GeForce RTX 4060 Laptop GPU
max:
0 100 200 300 Tooltip ROG Flow X13 GV302XV: Ø257 (221-285)
Predator Helios 16 PH16-71-731Q: Ø331 (286-387)
EVOL X15 AT 23: Ø333 (288-375)
G15 5530: Ø335 (280-371)
...
NVIDIA GeForce RTX 4060 Laptop GPU
max:
0 100 200 Tooltip ROG Flow X13 GV302XV: Ø155.3 (136-171)
Predator Helios 16 PH16-71-731Q: Ø181.3 (146-203)
G15 5530: Ø205 (176-223)
EVOL X15 AT 23: Ø205 (182-227)
...
NVIDIA GeForce RTX 4060 Laptop GPU
...
max:
0 100 Tooltip ROG Flow Z13 GZ301V: Ø76.3 (72-82)
Cyborg 15 A12VF: Ø75.3 (71-79)
Omen Transcend 14-fb0014: Ø73.9 (68-80)
Surface Laptop Studio 2 RTX 4060: Ø81.4 (77-92)
MagicBook Pro 16 2024: Ø81.5 (78-86)
ROG Flow Z13 GZ301V: Ø82.9 (81-86)
ROG Flow X13 GV302XV: Ø83.6 (78-86)
Yoga Pro 9 16-IRP G8: Ø90.8 (87-96)
Inspiron 16 Plus 7630: Ø81.8 (78-87)
G5 KF: Ø85.1 (72-91)
Legion Slim 5 16APH8: Ø82.9 (78-89)
Nitro 17 AN17-51-71ER Leise: Ø89 (84-107)
Legion 5 16IRX G9: Ø97.2 (93-102)
Vivobook Pro 16X K6604JV-MX016W: Ø95.5 (89-103)
Legion Slim 7 16APH8: Ø98.2 (93-101)
G6X 9KG (2024): Ø93.3 (88-99)
Advanced Gaming I74-121: Ø99.3 (95-104)
Legion Slim 5 14APH8: Ø93.4 (86-99)
Predator Helios 16 PH16-71-731Q: Ø100.1 (95-106)
Erazer Defender P40: Ø100.7 (96-104)
Nitro 17 AN17-51-71ER Ausgeglichen: Ø101.9 (95-110)
XMG Apex 17 (Late 23): Ø100.1 (92-103)
EVOL X15 AT 23: Ø102.2 (97-105)
Raider GE68HX 13VF: Ø94.7 (89-102)
LOQ 16IRH8: Ø94.8 (89-101)
G15 5530: Ø104.2 (101-107)
Katana 17 B13VFK: Ø92.2 (89-98)
Nitro 17 AN17-51-71ER: Ø103.9 (98-107)
ROG Flow X16 GV601V: Ø94.4 (90-99)
m16 R1 Intel: Ø103.9 (100-107)
Legion Pro 5 16IRX8: Ø96.9 (93-103)
G16, i7-13650HX, RTX 4060: Ø105.6 (100-109)
...
NVIDIA GeForce RTX 4060 Laptop GPU
...
max:
0 Tooltip ROG Flow X13 GV302XV: Ø62.7 (56-67)
EVOL X15 AT 23: Ø75.7 (70-82)
NVIDIA GeForce RTX 4060 Laptop GPU
max:
0 Tooltip ROG Flow X13 GV302XV: Ø52 (48-56)
...
NVIDIA GeForce RTX 4060 Laptop GPU
...
max:
» In Detailstufe max. mit allen getesteten Notebooks spielbar
Additional Benchmarks
Ultra Graphics & Postprocessing (HBAO+) 3840x2160
Medium Graphics & Postprocessing 1920x1080
284 [X] Dell G15 5530 959964
Intel Core i7-13650HX 1.9GHz
NVIDIA GeForce RTX 4060 Laptop GPU
min:
249 fps, P1:
249.57 fps, max:
314 fps
170.2 178.9 179.3 180 180.1 182.6 [X] Dell G15 5530 Intel Core i7-13650HX 1.9GHz
NVIDIA GeForce RTX 4060 Laptop GPU
min:
2.06 fps, P1:
125 fps, max:
343 fps
182.8 183.4 183.5 183.5 [X] Gigabyte G5 KF Intel Core i5-12500H 1.8GHz
NVIDIA GeForce RTX 4060 Laptop GPU
min:
2.54 fps, P1:
125 fps, max:
374 fps
183.6 [X] Gigabyte G6X 9KG (2024) Intel Core i7-13650HX 1.9GHz
NVIDIA GeForce RTX 4060 Laptop GPU
min:
2.02 fps, P1:
90.9 fps, max:
475 fps
184.4 184.5 185.6 [X] Colorful EVOL X15 AT 23 Intel Core i7-13700HX 1.5GHz
NVIDIA GeForce RTX 4060 Laptop GPU
min:
1.645 fps, P1:
125 fps, max:
419 fps
185.8 [X] MSI Cyborg 15 A12VF Intel Core i7-12650H 1.7GHz
NVIDIA GeForce RTX 4060 Laptop GPU
min:
2.61 fps, P1:
142.9 fps, max:
404 fps
185.8 186.1 [X] MSI Katana 17 B13VFK Intel Core i7-13620H 1.8GHz
NVIDIA GeForce RTX 4060 Laptop GPU
min:
1.899 fps, P1:
100 fps, max:
495 fps
186.3 186.5 186.7 186.8 [X] SCHENKER XMG Fusion 15 Engineering Sample Intel Core i9-14900HX 1.6GHz
NVIDIA GeForce RTX 4060 Laptop GPU
min:
1.494 fps, P1:
166.7 fps, max:
533 fps
~ 183 fps
+ Vergleich
- Vergleich einklappen
...
NVIDIA GeForce RTX 4060 Laptop GPU
...
max:
165.2 171.6 172.2 172.8 172.9 173.1 175.3 [X] Dell G15 5530 Intel Core i7-13650HX 1.9GHz
NVIDIA GeForce RTX 4060 Laptop GPU
min:
3.25 fps, P1:
111.1 fps, max:
393 fps
175.4 175.9 178.3 [X] Gigabyte G5 KF Intel Core i5-12500H 1.8GHz
NVIDIA GeForce RTX 4060 Laptop GPU
min:
3.33 fps, P1:
125 fps, max:
386 fps
178.9 179.2 179.8 180.4 [X] Gigabyte G6X 9KG (2024) Intel Core i7-13650HX 1.9GHz
NVIDIA GeForce RTX 4060 Laptop GPU
min:
2.32 fps, P1:
83.3 fps, max:
449 fps
181.3 181.5 [X] MSI Cyborg 15 A12VF Intel Core i7-12650H 1.7GHz
NVIDIA GeForce RTX 4060 Laptop GPU
min:
2.45 fps, P1:
125 fps, max:
376 fps
182.3 [X] Colorful EVOL X15 AT 23 Intel Core i7-13700HX 1.5GHz
NVIDIA GeForce RTX 4060 Laptop GPU
min:
1.886 fps, P1:
125 fps, max:
430 fps
182.4 183.1 183.2 184 184 [X] Lenovo LOQ 16IRH8 Intel Core i7-13620H 1.8GHz
NVIDIA GeForce RTX 4060 Laptop GPU
min:
2.37 fps, P1:
142.9 fps, max:
442 fps
184.3 [X] Lenovo LOQ 16IRH8 Intel Core i7-13620H 1.8GHz
NVIDIA GeForce RTX 4060 Laptop GPU
min:
2.27 fps, P1:
125 fps, max:
389 fps
184.7 [X] MSI Katana 17 B13VFK Intel Core i7-13620H 1.8GHz
NVIDIA GeForce RTX 4060 Laptop GPU
min:
1.738 fps, P1:
100 fps, max:
475 fps
186 186.1 [X] SCHENKER XMG Fusion 15 Engineering Sample Intel Core i9-14900HX 1.6GHz
NVIDIA GeForce RTX 4060 Laptop GPU
min:
1.838 fps, P1:
125 fps, max:
500 fps
~ 179 fps
+ Vergleich
- Vergleich einklappen
...
NVIDIA GeForce RTX 4060 Laptop GPU
max:
144 153.7 155.2 160 160.4 162.3 164.2 164.9 [X] MSI Cyborg 15 A12VF Intel Core i7-12650H 1.7GHz
NVIDIA GeForce RTX 4060 Laptop GPU
min:
2.75 fps, P1:
111.1 fps, max:
345 fps
166 168.3 169.4 170.6 171.5 [X] Gigabyte G5 KF Intel Core i5-12500H 1.8GHz
NVIDIA GeForce RTX 4060 Laptop GPU
min:
3.23 fps, P1:
111.1 fps, max:
324 fps
172.5 172.8 [X] Dell G15 5530 Intel Core i7-13650HX 1.9GHz
NVIDIA GeForce RTX 4060 Laptop GPU
min:
3.35 fps, P1:
111.1 fps, max:
406 fps
172.9 173.9 174.6 176 176.2 177.2 177.3 [X] Colorful EVOL X15 AT 23 Intel Core i7-13700HX 1.5GHz
NVIDIA GeForce RTX 4060 Laptop GPU
min:
3.47 fps, P1:
125 fps, max:
325 fps
177.8 178.9 179.6 [X] Lenovo LOQ 16IRH8 Intel Core i7-13620H 1.8GHz
NVIDIA GeForce RTX 4060 Laptop GPU
min:
2.79 fps, P1:
125 fps, max:
409 fps
180.2 [X] MSI Katana 17 B13VFK Intel Core i7-13620H 1.8GHz
NVIDIA GeForce RTX 4060 Laptop GPU
min:
2.58 fps, P1:
111.1 fps, max:
424 fps
181.7 [X] SCHENKER XMG Fusion 15 Engineering Sample Intel Core i9-14900HX 1.6GHz
NVIDIA GeForce RTX 4060 Laptop GPU
min:
2.47 fps, P1:
125 fps, max:
446 fps
182.8 ~ 170 fps
+ Vergleich
- Vergleich einklappen
...
NVIDIA GeForce RTX 4060 Laptop GPU
...
max:
76.9 86.5 89.3 [X] MSI Cyborg 15 A12VF Intel Core i7-12650H 1.7GHz
NVIDIA GeForce RTX 4060 Laptop GPU
min:
20.5 fps, P1:
55.6 fps, max:
163.1 fps
89.5 94.6 96.7 100.4 101 102.1 103.2 105.4 107.2 107.4 107.6 [X] Gigabyte G5 KF Intel Core i5-12500H 1.8GHz
NVIDIA GeForce RTX 4060 Laptop GPU
min:
4.17 fps, P1:
66.7 fps, max:
202 fps
110.3 111.8 [X] Dell G15 5530 Intel Core i7-13650HX 1.9GHz
NVIDIA GeForce RTX 4060 Laptop GPU
min:
4.01 fps, P1:
76.9 fps, max:
215 fps
112.1 [X] MSI Katana 17 B13VFK Intel Core i7-13620H 1.8GHz
NVIDIA GeForce RTX 4060 Laptop GPU
min:
8 fps, P1:
62.5 fps, max:
277 fps
112.8 113.9 114.1 114.5 [X] Lenovo LOQ 16IRH8 Intel Core i7-13620H 1.8GHz
NVIDIA GeForce RTX 4060 Laptop GPU
min:
8.64 fps, P1:
76.9 fps, max:
214 fps
114.6 [X] Colorful EVOL X15 AT 23 Intel Core i7-13700HX 1.5GHz
NVIDIA GeForce RTX 4060 Laptop GPU
min:
4.03 fps, P1:
76.9 fps, max:
206 fps
115.2 [X] Gigabyte G6X 9KG (2024) Intel Core i7-13650HX 1.9GHz
NVIDIA GeForce RTX 4060 Laptop GPU
min:
4.02 fps, P1:
76.9 fps, max:
211 fps
117 117.4 119.6 120.2 124.5 [X] SCHENKER XMG Fusion 15 Engineering Sample Intel Core i9-14900HX 1.6GHz
NVIDIA GeForce RTX 4060 Laptop GPU
min:
3.83 fps, P1:
83.3 fps, max:
243 fps
~ 107 fps
+ Vergleich
- Vergleich einklappen
...
NVIDIA GeForce RTX 4060 Laptop GPU
...
max:
...
NVIDIA GeForce RTX 4060 Laptop GPU
...
max:
...
NVIDIA GeForce RTX 4060 Laptop GPU
...
max:
» In Detailstufe max. mit allen getesteten Notebooks spielbar
Additional Benchmarks
Highest Settings possible 16xAF 4xMSAA + FXAA 3840x2160
Normal/Off 4xAF 1920x1080
177.4 [X] Gigabyte G5 KF Intel Core i5-12500H 1.8GHz
NVIDIA GeForce RTX 4060 Laptop GPU
min:
4.6 fps, P1:
125 fps, max:
382 fps
176.8 [X] Dell G15 5530 959964
Intel Core i7-13650HX 1.9GHz
NVIDIA GeForce RTX 4060 Laptop GPU
min:
3.84 fps, P1:
125 fps, max:
337 fps
185.1 [X] Lenovo LOQ 16IRH8 Intel Core i7-13620H 1.8GHz
NVIDIA GeForce RTX 4060 Laptop GPU
min:
2.09 fps, P1:
142.9 fps, max:
433 fps
185.9 [X] SCHENKER XMG Fusion 15 Engineering Sample Intel Core i9-14900HX 1.6GHz
NVIDIA GeForce RTX 4060 Laptop GPU
min:
1.622 fps, P1:
142.9 fps, max:
489 fps
Lowest Settings possible 1920x1080
187 [X] MSI Katana 17 B13VFK Intel Core i7-13620H 1.8GHz
NVIDIA GeForce RTX 4060 Laptop GPU
min:
2.12 fps, P1:
125 fps, max:
513 fps
184.2 [X] Gigabyte G5 KF Intel Core i5-12500H 1.8GHz
NVIDIA GeForce RTX 4060 Laptop GPU
min:
3.15 fps, P1:
125 fps, max:
426 fps
183.2 [X] Dell G15 5530 959964
Intel Core i7-13650HX 1.9GHz
NVIDIA GeForce RTX 4060 Laptop GPU
min:
2.13 fps, P1:
125 fps, max:
374 fps
187 [X] Lenovo LOQ 16IRH8 Intel Core i7-13620H 1.8GHz
NVIDIA GeForce RTX 4060 Laptop GPU
min:
1.545 fps, P1:
166.7 fps, max:
469 fps
186.5 [X] SCHENKER XMG Fusion 15 Engineering Sample Intel Core i9-14900HX 1.6GHz
NVIDIA GeForce RTX 4060 Laptop GPU
min:
1.462 fps, P1:
142.9 fps, max:
578 fps
v1.26
log 01. 10:51:32
#0 no ids found in url (should be separated by "_") +0s ... 0s
#1 not redirecting to Ajax server +0s ... 0s
#2 did not recreate cache, as it is less than 5 days old! Created at Wed, 01 May 2024 05:36:19 +0200 +0.001s ... 0.001s
#3 composed specs +0.041s ... 0.042s
#4 did output specs +0s ... 0.042s
#5 start showIntegratedCPUs +0s ... 0.042s
#6 getting avg benchmarks for device 11455 +0.027s ... 0.069s
#7 got single benchmarks 11455 +0.198s ... 0.266s
#8 got avg benchmarks for devices +0s ... 0.266s
#9 No cached benchmark found, getting uncached values +0.891s ... 1.157s
#10 No cached benchmark found, getting uncached values +0.011s ... 1.169s
#11 min, max, avg, median took s +0.274s ... 1.443s
#12 before gaming benchmark output +0.001s ... 1.444s
#13 Got 1967 rows for game benchmarks. +0.628s ... 2.072s
#14 composed SQL query for gamebenchmarks +0s ... 2.072s
#15 got data and put it in $dataArray +0.072s ... 2.144s
#16 benchmarks composed for output. +4.061s ... 6.205s
#17 return log +0.053s ... 6.258s
Notebooktests mit NVIDIA GeForce RTX 4060 Laptop GPU Grafikkarte
Gigabyte G6X 9KG (2024) im Test: Preiswertes Gaming-Notebook mit RTX 4060 Gigabytes Gaming-Notebook bietet viel Leistung (Core i7-13650HX, GeForce RTX 4060), ein gutes Ausstattungsniveau (16 GB RAM, 1-TB-SSD, 16:10-Panel mit 165 Hz) ...
Intel Core i7-13650HX | NVIDIA GeForce RTX 4060 Laptop GPU | 16.00" | 2.6 kg
HP Omen Transcend 14 Laptop im Test: Razer Blade-Alternative die eine Überlegung wert ist Die Liste der 14-Zoll-Gaming-Notebooks wächst nun mit dem HP Omen Transcend 14. Es ist vielleicht nicht so bekannt wie das beliebte Razer Blade 14 oder das Asus...
Intel Core Ultra 7 155H | NVIDIA GeForce RTX 4060 Laptop GPU | 14.00" | 1.6 kg
Honor MagicBook Pro 16 2024 - Multimedia-Laptop mit 165-Hz IPS-Panel und RTX 4060 Das MagicBook Pro 16 war bisher als günstiger Multimedia-Rechner bekannt, doch mit der neuen 2024er-Version bringt Honor einen leistungsstarken Multimedia/Gamin...
Intel Core Ultra 7 155H | NVIDIA GeForce RTX 4060 Laptop GPU | 16.00" | 1.9 kg
Dell G16 im Laptop-Test: Preiswerte Alienware-Alternative vom gleichen Hersteller? Gegenüber Dells Alienware-Reihe deckt das Dell G16 eher die Mittelklasse an Gaming-Laptops ab. Das Modell setzt weder auf Intels neue Gen14- noch deren Ultra-CP...
Intel Core i7-13650HX | NVIDIA GeForce RTX 4060 Laptop GPU | 16.00" | 2.8 kg
Lenovo Legion 5i 16 G9 - Schneller Gaming-Laptop mit Raptor Lake-HX und AI-Engine Lenovo hat auf der CES das neue Legion 5i 16 G9 präsentiert und wir konnten das neue Mittelklasse Gaming-Notebook bereits testen. Mit an Bord ist der neue Core ...
Intel Core i7-14650HX | NVIDIA GeForce RTX 4060 Laptop GPU | 16.00" | 2.4 kg
Colorful EVOL X15 AT 23 : Intel Core i7-13700HX, 15.60", 2.3 kgTest » Colorful EVOL X15 AT 23 im Test: Beeindruckender QHD-Gamer mit Raptor Lake-HX und ein paar unübersehbaren Macken
Lenovo Legion Slim 7 16APH8 : AMD Ryzen 7 7840HS, 16.00", 2.1 kgTest » Test Lenovo Legion Slim 7 16 Gaming-Laptop: Überzeugt auch mit AMD Ryzen
Gigabyte G5 KF : Intel Core i5-12500H, 15.60", 1.9 kgTest » Gigabyte G5 KF im Test: Gaming-Laptop mit RTX 4060 für 969 Euro
Asus ROG Flow X13 GV302XV : AMD Ryzen 9 7940HS, 13.40", 1.3 kgTest » Asus ROG Flow X13 GV302XV 2023 im Test: Schlankes Gaming-Convertible mit AMD Zen 4 und 60 W Nvidia RTX 4060
MSI Raider GE68HX 13VF : Intel Core i9-13950HX, 16.00", 2.7 kgTest » MSI Raider GE68 HX 13VF Laptop im Test: Umfassendes Designupdate
SCHENKER XMG Apex 17 (Late 23) : AMD Ryzen 7 7840HS, 17.30", 2.5 kgTest » XMG Apex 17 (Late 23) im Test: QHD-Gaming-Notebook mit RTX 4060
Microsoft Surface Laptop Studio 2 RTX 4060 : Intel Core i7-13700H, 14.40", 2 kgTest » Microsoft Surface Laptop Studio 2 im Test - Multimedia-Convertible mit deutlich mehr Leistung
Lenovo LOQ 16IRH8 : Intel Core i7-13620H, 16.00", 2.7 kgTest » Lenovo LOQ 16 Gaming-Laptop-Test: Wo ist der Haken gegenüber dem teureren Legion?
Lenovo Legion Slim 5 14APH8 : AMD Ryzen 7 7840HS, 14.50", 1.7 kgTest » Lenovo Legion Slim 5 14APH8 Laptop im Test: OLED-Perfektion in 120 Hz und 2,8K
Captiva Advanced Gaming I74-121 : Intel Core i5-13500H, 15.60", 2.3 kgTest » Captiva Advanced Gaming I74-121 (Clevo V150RND) im Laptop-Test: Günstiger Gamer mit starker RTX 4060
Alienware m16 R1 Intel : Intel Core i7-13700HX, 16.00", 3 kgTest » Alienware m16 R1 im Test: QHD-Gaming-Bolide mit RTX 4060 und Thunderbolt 4
Dell Inspiron 16 Plus 7630 : Intel Core i7-13700H, 16.00", 2.2 kgTest » Dell Inspiron 16 Plus 7630 Laptop-Test: Die 60-W-GeForce-RTX-4060 ist gar nicht so schlecht
Lenovo Legion Slim 5 16APH8 : AMD Ryzen 7 7840HS, 16.00", 2.4 kgTest » Lenovo Legion Slim 5 16APH8 Notebook Test: Unterschätztes Design mit unterdurchschnittlicher GPU
Lenovo Yoga Pro 9 16-IRP G8 : Intel Core i7-13705H, 16.00", 2.2 kgTest » Lenovo Yoga Pro 9i 16 Laptop im Test - Tolles Mini-LED-Panel, aber unnötige Sparmaßnahmen
Asus Vivobook Pro 16X K6604JV-MX016W : Intel Core i9-13980HX, 16.00", 2.1 kgTest » Asus Vivobook Pro 16X im Test: Creator-Notebook mit überragendem Prozessor
Acer Predator Helios 16 PH16-71-731Q : Intel Core i7-13700HX, 16.00", 2.6 kgTest » Acer Predator Helios 16 Laptop-Test: Leiser Gamer mit vielen Stärken
SCHENKER XMG Pro 15 (E23) : Intel Core i9-13900HX, 15.60", 2.4 kgTest » Schenker XMG Pro 15 E23 (PD50SND-G) Gaming-Laptop im Test: Ein Hoch auf die Work-Play-Balance
Dell G15 5530 : Intel Core i7-13650HX, 15.60", 3 kgTest » Dell G15 5530 im Test: Brauchbare Alienware-Alternative mit Raptor Lake-HX
Acer Nitro 17 AN17-51-71ER : Intel Core i7-13700H, 17.30", 3 kgTest » Leises Acer Nitro 17 im Laptop-Test: RTX 4060 perfekt eingestellt
Asus ROG Flow X16 GV601V : Intel Core i9-13900H, 16.00", 2.1 kgTest » Flaches Asus ROG Flow X16 im Laptop-Test: Starkes 16-Zoll-Gaming-Workstation-Convertible mit Touch-Display
Asus ZenBook Pro 14 Duo UX8402VV-P1021W : Intel Core i9-13900H, 14.50", 1.8 kgTest » Asus ZenBook Pro 14 Duo Kreativ-Laptop mit Zweitbildschirm im Test: Gesteigerte Produktivität
Medion Erazer Defender P40 : Intel Core i7-13700HX, 17.30", 2.9 kgTest » Medion Erazer Defender P40 im Test: Preiswertes QHD-Gaming-Notebook mit RTX 4060
Lenovo Legion Pro 5 16IRX8 : Intel Core i7-13700HX, 16.00", 2.5 kgTest » Lenovo Legion Pro 5 16IRX8 Laptop-Test: Satte 1.600 US-Dollar für die GeForce RTX 4060
Asus ROG Flow Z13 GZ301V : Intel Core i9-13900H, 13.40", 1.6 kgTest » Asus ROG Flow Z13 im Test: Wahnsinn - RTX 4060 in einem beeindruckenden Gaming-Tablet
MSI Cyborg 15 A12VF : Intel Core i7-12650H, 15.60", 2 kgTest » MSI Cyborg 15 A12VF im Test: Gaming-Notebook mit Low-Power-RTX-4060
MSI Katana 17 B13VFK : Intel Core i7-13620H, 17.30", 2.8 kgTest » Test MSI Katana 17 B13V Laptop: Nvidia GeForce RTX 4060 gibt ihren Einstand
MSI Sword 16 HX B14VFKG : Intel Core Ultra 9 185H, 16.00", 2.3 kgExterner Test » MSI Sword 16 HX B14VFKG
Asus TUF Gaming A15 FA507UI : AMD Ryzen 9 8945HS, 15.60", 2.2 kgExterner Test » Asus TUF Gaming A15 FA507UI
HP Omen Transcend 16-u1000ng : Intel Core i7-14700HX, 16.00", 2.2 kgExterner Test » HP Omen Transcend 16-u1000ng
HP Omen 16-wf1000 : Intel Core i7-14700HX, 16.10", 2.4 kgExterner Test » HP Omen 16-wf1000
MSI Raider GE68 HX 14VFG : Intel Core i7-14700HX, 16.00", 2.8 kgExterner Test » MSI Raider GE68 HX 14VFG
Dell XPS 16 9640, RTX 4060 : Intel Core Ultra 7 155H, 16.30", 2.1 kgExterner Test » Dell XPS 16 9640, RTX 4060
Aorus 15 BKG : Intel Core Ultra 7 155H, 15.60", 2.4 kgExterner Test » Aorus 15 BKG
Asus TUF Gaming A16 FA607PV : AMD Ryzen 9 7845HX, 16.00", 2.3 kgExterner Test » Asus TUF Gaming A16 FA607PV
Asus ROG Zephyrus G14 OLED GA403UV : AMD Ryzen 9 8945HS, 14.00", 1.5 kgExterner Test » Asus ROG Zephyrus G14 OLED GA403UV
Lenovo Legion 5 16IRX9 : Intel Core i5-13450HX, 16.00", 2.3 kgExterner Test » Lenovo Legion 5 16IRX9
Lenovo LOQ 15IRX9 : Intel Core i7-14700HX, 16.00", 2.3 kgExterner Test » Lenovo LOQ 15IRX9
Xiaomi Redmi G Pro 2024 : Intel Core i9-14900HX, 16.00", 2.7 kgExterner Test » Xiaomi Redmi G Pro 2024
Acer Nitro 16 AN16-41, R7 7735HS RTX 4060 : AMD Ryzen 7 7735HS, 16.00", 2.7 kgExterner Test » Acer Nitro 16 AN16-41, R7 7735HS RTX 4060
Honor MagicBook Pro 16 2024 : Intel Core Ultra 7 155H, 16.00", 1.9 kgExterner Test » Honor MagicBook Pro 16 2024
MSI Cyborg 14 A13VE : Intel Core i7-13620H, 14.00", 1.6 kgExterner Test » MSI Cyborg 14 A13VE
Asus Vivobook Pro 15 OLED N6506 : Intel Core Ultra 9 185H, 15.60", 1.8 kgExterner Test » Asus Vivobook Pro 15 OLED N6506
Gigabyte G6X 9KG (2024) : Intel Core i7-13650HX, 16.00", 2.6 kgExterner Test » Gigabyte G6X 9KG (2024)
Lenovo Legion 5 16IRX G9 : Intel Core i7-14650HX, 16.00", 2.4 kgExterner Test » Lenovo Legion 5 16IRX G9
HP Omen Transcend 14-fb0014 : Intel Core Ultra 7 155H, 14.00", 1.6 kgExterner Test » HP Omen Transcend 14-fb0014
Acer Nitro 5 AN517-55-96S6 : Intel Core i9-12900H, 17.30", 3 kgExterner Test » Acer Nitro 5 AN517-55-96S6
Aorus 15X BKF : Intel Core i7-13700H, 15.60", 2.3 kgExterner Test » Aorus 15X BKF
MSI Creator Z16 HX Studio B13VFT : Intel Core i7-13700H, 16.00", 2.4 kgExterner Test » MSI Creator Z16 HX Studio B13VFT
Lenovo LOQ 16APH8 : AMD Ryzen 5 7640HS, 16.00", 2.6 kgExterner Test » Lenovo LOQ 16APH8
Acer Nitro 17 AN17-72 : Intel Core i7-14700HX, 17.30", 3.2 kgExterner Test » Acer Nitro 17 AN17-72
Asus VivoBook Pro 15 M6500XV : AMD Ryzen 9 7940HS, 15.60", 1.8 kgExterner Test » Asus VivoBook Pro 15 M6500XV
Asus Zenbook Pro 14 OLED UX6404VV, i5-13500H : Intel Core i5-13500H, 14.50", 1.6 kgExterner Test » Asus Zenbook Pro 14 OLED UX6404VV, i5-13500H
HP Victus 16-s0475ng : AMD Ryzen 7 7840HS, 16.10", 2.3 kgExterner Test » HP Victus 16-s0475ng
Lenovo Legion Slim 5 16IRH8, i7-13700H RTX 4060 : Intel Core i7-13700H, 16.00", 2.4 kgExterner Test » Lenovo Legion Slim 5 16IRH8, i7-13700H RTX 4060
Asus ZenBook Pro 14 Duo UX8402VV : Intel Core i7-13700H, 14.50", 1.8 kgExterner Test » Asus ZenBook Pro 14 Duo UX8402VV
HP Omen 16-wf0000ng : Intel Core i5-13500HX, 16.10", 2.4 kgExterner Test » HP Omen 16-wf0000ng
MSI Stealth 16 Studio A13VG, i7-13620H : Intel Core i7-13620H, 17.30", 2.8 kgExterner Test » MSI Stealth 16 Studio A13VG, i7-13620H
Acer Nitro 17 AN17-41-R182 : AMD Ryzen 7 7840HS, 17.30", 3 kgExterner Test » Acer Nitro 17 AN17-41-R182
Acer Nitro 17 AN17-51-71ER : Intel Core i7-13700H, 17.30", 3 kgExterner Test » Acer Nitro 17 AN17-51-71ER
HP Omen Transcend 16-u0000ng : Intel Core i7-13700HX, 16.00", 2.2 kgExterner Test » HP Omen Transcend 16-u0000ng
Lenovo LOQ 15IRH8, i5-13500H RTX 4060 : Intel Core i5-13500H, 15.60", 2.4 kgExterner Test » Lenovo LOQ 15IRH8, i5-13500H RTX 4060
HP Victus 16-s0000ax : AMD Ryzen 5 7640HS, 16.10", 2.3 kgExterner Test » HP Victus 16-s0000ax
MSI Bravo 15 C7VF : AMD Ryzen 7 7735HS, 15.60", 2.3 kgExterner Test » MSI Bravo 15 C7VF
Asus Zenbook Pro 14 OLED UX6404VV, i7-13700H : Intel Core i7-13700H, 14.50", 1.6 kgExterner Test » Asus Zenbook Pro 14 OLED UX6404VV, i7-13700H
Asus VivoBook Pro 16X K6604JV : Intel Core i9-13980HX, 16.00", 1.9 kgExterner Test » Asus VivoBook Pro 16X K6604JV
Asus TUF Gaming F17 FX707VV : Intel Core i9-13900H, 17.30", 2.6 kgExterner Test » Asus TUF Gaming F17 FX707VV
HP Omen 16-xf0000 : AMD Ryzen 7 7840HS, 16.10", 2.4 kgExterner Test » HP Omen 16-xf0000
Lenovo LOQ 15, R7 7840HS RTX 4060 : AMD Ryzen 7 7840HS, 15.60", 2.4 kgExterner Test » Lenovo LOQ 15, R7 7840HS RTX 4060
MSI Stealth 16 Studio A13VF, i9-13900H : Intel Core i9-13900H, 16.00", 2 kgExterner Test » MSI Stealth 16 Studio A13VF, i9-13900H
HP Victus 16-r0017ns : Intel Core i7-13700H, 16.10", 2.3 kgExterner Test » HP Victus 16-r0017ns
Lenovo ThinkBook 16p G4 : Intel Core i7-13700H, 16.00", 2.2 kgExterner Test » Lenovo ThinkBook 16p G4
Dell Inspiron 16 Plus 7630, i7-13700H : Intel Core i7-13700H, 16.00", 2.1 kgExterner Test » Dell Inspiron 16 Plus 7630, i7-13700H
Lenovo Legion Slim 5 14APH8 : AMD Ryzen 7 7840HS, 14.50", 1.7 kgExterner Test » Lenovo Legion Slim 5 14APH8
Microsoft Surface Laptop Studio 2 RTX 4060 : Intel Core i7-13700H, 14.40", 2 kgExterner Test » Microsoft Surface Laptop Studio 2 RTX 4060
Dell Inspiron 16 Plus 7630 : Intel Core i7-13700H, 16.00", 2.2 kgExterner Test » Dell Inspiron 16 Plus 7630
Asus VivoBook 16X OLED K3605VV : Intel Core i9-13900H, 16.00", 1.8 kgExterner Test » Asus VivoBook 16X OLED K3605VV
MSI Stealth 15 A13VF : Intel Core i7-13620H, 15.60", 2.1 kgExterner Test » MSI Stealth 15 A13VF
MSI Raider GE68 HX 13VF : Intel Core i9-13950HX, 16.00", 2.7 kgExterner Test » MSI Raider GE68 HX 13VF
Alienware x14 R2 2023, RTX 4060 : Intel Core i7-13620H, 14.00", 1.9 kgExterner Test » Alienware x14 R2 2023, RTX 4060
Lenovo ThinkPad P1 G6 : Intel Core i7-13700H, 16.00", 1.9 kgExterner Test » Lenovo ThinkPad P1 G6
Aorus 15 9KF : Intel Core i5-12500H, 15.60", 2.3 kgExterner Test » Aorus 15 9KF
Asus ROG Strix G17 G713PV : AMD Ryzen 9 7845HX, 17.30", 2.8 kgExterner Test » Asus ROG Strix G17 G713PV
Lenovo Legion Slim 5 16IRH8 : Intel Core i5-13500H, 16.00", 2.4 kgExterner Test » Lenovo Legion Slim 5 16IRH8
Razer Blade 15 2023 : Intel Core i7-13800H, 15.60", 2 kgExterner Test » Razer Blade 15 2023
Asus ZenBook Pro 14 Duo UX8402VV-P1021W : Intel Core i9-13900H, 14.50", 1.8 kgExterner Test » Asus ZenBook Pro 14 Duo UX8402VV-P1021W
Razer Blade 14 RTX 4060 : AMD Ryzen 9 7940HS, 14.00", 1.8 kgExterner Test » Razer Blade 14 RTX 4060
Lenovo LOQ 15IRH8, i7-13700H RTX 4060 : Intel Core i7-13700H, 15.60", 2.4 kgExterner Test » Lenovo LOQ 15IRH8, i7-13700H RTX 4060
Lenovo LOQ 16IRH8, i7-13700H RTX 4060 : Intel Core i7-13700H, 16.00", 2.6 kgExterner Test » Lenovo LOQ 16IRH8, i7-13700H RTX 4060
Asus ROG Zephyrus G14 GA402XV : AMD Ryzen 9 7940HS, 14.00", 1.7 kgExterner Test » Asus ROG Zephyrus G14 GA402XV
Acer Predator Helios Neo 16 PHN16-71, i5-13500HX RTX 4060 : Intel Core i5-13500HX, 16.00", 2.6 kgExterner Test » Acer Predator Helios Neo 16 PHN16-71, i5-13500HX RTX 4060
HP Envy 16-h1000 : Intel Core i9-13900H, 16.00", 2.7 kgExterner Test » HP Envy 16-h1000
Acer Predator Helios 16 PH16-71-74UU : Intel Core i7-13700HX, 16.00", 2.7 kgExterner Test » Acer Predator Helios 16 PH16-71-74UU
MSI Cyborg 15 A12VF, i5-12450H : Intel Core i5-12450H, 15.60", 2 kgExterner Test » MSI Cyborg 15 A12VF, i5-12450H
Asus TUF Gaming F15 FX507VV : Intel Core i7-13700H, 15.60", 2.2 kgExterner Test » Asus TUF Gaming F15 FX507VV
Lenovo Yoga Pro 9 14IRP G8, i9-13905H RTX 4060 : Intel Core i9-13905H, 14.50", 1.7 kgExterner Test » Lenovo Yoga Pro 9 14IRP G8, i9-13905H RTX 4060
MSI Cyborg 15 A12VF-248 : Intel Core i7-12700H, 15.60", 2 kgExterner Test » MSI Cyborg 15 A12VF-248
Lenovo Legion Slim 5 16APH8 : AMD Ryzen 7 7840HS, 16.00", 2.4 kgExterner Test » Lenovo Legion Slim 5 16APH8
Lenovo LOQ 16IRH8 : Intel Core i7-13620H, 16.00", 2.7 kgExterner Test » Lenovo LOQ 16IRH8
Acer Predator Helios 18 PH18-71-74ET : Intel Core i7-13700HX, 18.00", 3.3 kgExterner Test » Acer Predator Helios 18 PH18-71-74ET
Medion Erazer Defender P40 : Intel Core i7-13700HX, 17.30", 2.9 kgExterner Test » Medion Erazer Defender P40
MSI Prestige 16 Studio A13VF : Intel Core i7-13700H, 16.00", 2.1 kgExterner Test » MSI Prestige 16 Studio A13VF
MSI Cyborg 15 A13VF : Intel Core i7-13620H, 15.60", 2 kgExterner Test » MSI Cyborg 15 A13VF
Dell XPS 15 9530 RTX 4060 : Intel Core i7-13700H, 15.60", 1.9 kgExterner Test » Dell XPS 15 9530 RTX 4060
Medion Erazer Deputy P50 : Intel Core i7-13700HX, 15.60", 2.1 kgExterner Test » Medion Erazer Deputy P50
Asus TUF Gaming A15 FA507NV : AMD Ryzen 7 7735HS, 15.60", 2.2 kgExterner Test » Asus TUF Gaming A15 FA507NV
Dell G16 7630 : Intel Core i7-13650HX, 15.60", 2.9 kgExterner Test » Dell G16 7630
Asus TUF Gaming A15 FA507XV : AMD Ryzen 9 7940HS, 15.60", 2.2 kgExterner Test » Asus TUF Gaming A15 FA507XV
Acer Nitro 17 AN17-71 : Intel Core i7-13700HX, 17.30", 3.3 kgExterner Test » Acer Nitro 17 AN17-71
MSI Stealth 14 Studio A13VF : Intel Core i7-13700H, 14.00", 1.7 kgExterner Test » MSI Stealth 14 Studio A13VF
Asus VivoBook Pro 16 OLED K6602VV : Intel Core i9-13900H, 16.00", 1.9 kgExterner Test » Asus VivoBook Pro 16 OLED K6602VV
Asus Zenbook Pro 14 OLED UX6404VV : Intel Core i9-13900H, 14.50", 1.6 kgExterner Test » Asus Zenbook Pro 14 OLED UX6404VV
MSI Katana 17 B12VFK : Intel Core i7-12650H, 17.30", 2.6 kgExterner Test » MSI Katana 17 B12VFK
Asus ROG Strix G16 G614JV, i7-13650HX : Intel Core i7-13650HX, 16.00", 2.5 kgExterner Test » Asus ROG Strix G16 G614JV, i7-13650HX
Dell G15 5530 : Intel Core i7-13650HX, 15.60", 3 kgExterner Test » Dell G15 5530
MSI Summit E16 Flip A13 VFT : Intel Core i7-1360P, 16.00", 2.1 kgExterner Test » MSI Summit E16 Flip A13 VFT
MSI Vector GP77 13VF : Intel Core i7-13700H, 17.30", 2.8 kgExterner Test » MSI Vector GP77 13VF
MSI Stealth 16 Studio A13VF : Intel Core i7-13620H, 16.00", 2 kgExterner Test » MSI Stealth 16 Studio A13VF
Alienware m16 R1 Intel : Intel Core i7-13700HX, 16.00", 3 kgExterner Test » Alienware m16 R1, i7-13700HX RTX 4060
Acer Predator Helios 16 PH16-71-731Q : Intel Core i7-13700HX, 16.00", 2.6 kgExterner Test » Acer Predator Helios 16 PH16-71-731Q
Lenovo LOQ 15IRH8, i7-13620H : Intel Core i7-13620H, 15.60", 2.4 kgExterner Test » Lenovo LOQ 15IRH8, i7-13620H
Razer Blade 18 2023 RTX 4060 : Intel Core i9-13950HX, 18.00", 3.2 kgExterner Test » Razer Blade 18 2023 RTX 4060
Asus ROG Flow X13 GV302XV : AMD Ryzen 9 7940HS, 13.40", 1.3 kgExterner Test » Asus ROG Flow X13 GV302XV
MSI Pulse 15 B13VFK : Intel Core i9-13900H, 15.60", 2.3 kgExterner Test » MSI Pulse 15 B13VFK
MSI Pulse 17 B13VFK : Intel Core i7-13700H, 17.30", 2.7 kgExterner Test » MSI Pulse 17 B13VFK
MSI Cyborg 15 A12VF : Intel Core i7-12650H, 15.60", 2 kgExterner Test » MSI Cyborg 15 A12VF
MSI Katana 17 B13VFK : Intel Core i7-13620H, 17.30", 2.8 kgExterner Test » MSI Katana 17 B13VFK
Acer Predator Helios Neo 16 PHN16-71-702Z : Intel Core i7-13700HX, 16.00", 2.6 kgExterner Test » Acer Predator Helios Neo 16 PHN16-71-702Z
Asus ROG Strix G18 G814JV : Intel Core i7-13700HX, 18.00", 3 kgExterner Test » Asus ROG Strix G18 G814JV
Asus ROG Strix G16 G614JV : Intel Core i9-13980HX, 16.00", 2.5 kgExterner Test » Asus ROG Strix G16 G614JV
Asus ROG Flow X16 GV601V : Intel Core i9-13900H, 16.00", 2.1 kgExterner Test » Asus ROG Flow X16 GV601V
Lenovo Legion Pro 5 16IRX8, i5-13500HX RTX 4060 : Intel Core i5-13500HX, 16.00", 2.6 kgExterner Test » Lenovo Legion Pro 5 16IRX8, i5-13500HX RTX 4060
Lenovo Legion Slim 7 16IRH8 : Intel Core i7-13700H, 16.00", 2 kgExterner Test » Lenovo Legion Slim 7 16IRH8
MSI Katana 15 B13VFK : Intel Core i7-13620H, 15.60", 2.3 kgExterner Test » MSI Katana 15 B13VFK
Gigabyte G5 KF : Intel Core i5-12500H, 15.60", 1.9 kgExterner Test » Gigabyte G5 KF
Asus ROG Flow Z13 GZ301V : Intel Core i9-13900H, 13.40", 1.6 kgExterner Test » Asus ROG Flow Z13 GZ301V
Asus ROG Zephyrus G16 GU603VV : Intel Core i7-13620H, 16.00", 2 kgExterner Test » Asus ROG Zephyrus G16 GU603VV
Lenovo Legion Pro 5 16IRX8 : Intel Core i7-13700HX, 16.00", 2.5 kgExterner Test » Lenovo Legion Pro 5 16IRX8
Asus ROG Zephyrus G16 GU603VV-N4007W : Intel Core i9-13900H, 16.00", 2 kgExterner Test » Asus ROG Zephyrus G16 2023 GU603VV-N4007W
SCHENKER XMG Apex 17 (Late 23) : AMD Ryzen 7 7840HS, 17.30", 2.5 kgDeal: XMG Apex 17 Gaming-Laptop mit RTX 4060 und QHD-Display besonders günstig dank doppeltem Rabatt
Dell G16, i7-13650HX, RTX 4060 : Intel Core i7-13650HX, 16.00", 2.8 kgDeal: Dell G16 7630 QHD-Gaming-Laptop mit 240Hz, 100% DCI-P3, RTX 4060 und 32 GB RAM zum Bestpreis dank Multi-Rabatt
HP Omen 16-xf0000 : AMD Ryzen 7 7840HS, 16.10", 2.4 kgDeal: HP Omen 16 Gaming-Laptop mit RTX 4060 und Ryzen 7 dank 16% Rabatt zum Bestpreis
Lenovo Legion Slim 5 16APH8 : AMD Ryzen 7 7840HS, 16.00", 2.4 kgDeal: Lenovo Legion Slim 5 mit AMD Ryzen 7 7840HS und RTX 4070 um 23% rabattiert bei Amazon
Gigabyte G5 KF : Intel Core i5-12500H, 15.60", 1.9 kgDeal: Gigabyte G5 mit GeForce RTX 4060, Core i5-13500H und 144 Hz Display gibts kurze Zeit für nur 799 Euro
Gigabyte G6X 9KG (2024) : Intel Core i7-13650HX, 16.00", 2.6 kgGigabyte G6X 9KG (2024): RTX 4060 gepaart mit guten Laufzeiten
SCHENKER XMG Apex 17 (Late 23) : AMD Ryzen 7 7840HS, 17.30", 2.5 kgGaming-Laptop-Deals bei Schenker: XMG Neo 17 mit RTX 4080, Apex 17, Pro 16 Studio und mehr stark rabattiert
Asus ROG Strix G17 G713PV : AMD Ryzen 9 7845HX, 17.30", 2.8 kgDeal: Asus ROG Strix G17 Gaming-Notebook mit AMD Ryzen 9 und RTX 4060 heute günstiger denn je
Lenovo LOQ 16IRH8 : Intel Core i7-13620H, 16.00", 2.7 kgBestpreis: Lenovo LOQ 16 Gaming-Laptop mit RTX 4060 und 165Hz-QHD-Display im Deal für 999 Euro
Honor MagicBook Pro 16 2024 : Intel Core Ultra 7 155H, 16.00", 1.9 kgHonors neues MagicBook Pro 16 ist ein überraschend guter Multimedia/Gaming-Laptop mit Advanced Optimus
Lenovo Legion Slim 5 16IRH8, i7-13700H RTX 4060 : Intel Core i7-13700H, 16.00", 2.4 kgLenovo Legion Slim 5: QHD-Gaming-Laptop mit RTX 4060 und Core i7 für kurze Zeit mit 336 Euro Preisvorteil
Honor MagicBook Pro 16 2024 : Intel Core Ultra 7 155H, 16.00", 1.9 kgHonor Magic6 Pro vs. Xiaomi 14 Ultra: Hier gehts zu den Mega-Launchevent-Livestreams
Lenovo Legion Slim 5 16APH8 : AMD Ryzen 7 7840HS, 16.00", 2.4 kgDeal: Günstiger QHD-Gamer Lenovo Legion Slim 5 16 mit RTX 4060 zum Bestpreis in der Alternate Cyber-Week
Dell G15 5530 : Intel Core i7-13650HX, 15.60", 3 kgAmazon: Budget-Gaming-Notebook Dell G15 mit RTX 4060 (140W), Core i7 und 165Hz Overdrive-Display zum Bestpreis
Dell G16, i7-13650HX, RTX 4060 : Intel Core i7-13650HX, 16.00", 2.8 kgDas neue Dell G16 getestet: Preiswerter Gamer mit Riesennetzteil
Dell Inspiron 16 Plus 7630 : Intel Core i7-13700H, 16.00", 2.2 kgAmazon: Dell Inspiron 16 Plus Multimedia-Laptop mit 120Hz QHD-Display und GeForce RTX 4060 unschlagbar günstig
Lenovo LOQ 16IRH8 : Intel Core i7-13620H, 16.00", 2.7 kgAmazon: Günstiger Gaming-Laptop Lenovo LOQ 16 mit QHD-Display, RTX 4060 und AMD Ryzen 7 erneut zum Bestpreis
Lenovo Legion Pro 5 16IRX8 : Intel Core i7-13700HX, 16.00", 2.5 kgSchnellste RTX 4060 im Gaming-Laptop: Lenovo Legion Pro 5i 16 mit 500 Nits 240Hz QHD+ Display im Bestpreis-Deal
Asus ROG Flow X16 GV601V : Intel Core i9-13900H, 16.00", 2.1 kgAmazon: Asus ROG Flow X16 Gaming-Convertible mit Intel Core i9-13900H und GeForce RTX 4060 zum neuen Bestpreis
Gigabyte G5 KF : Intel Core i5-12500H, 15.60", 1.9 kgUnschlagbar günstig: Gigabyte G5 Gaming-Laptop mit RTX-4050-Grafik für nur 587 Euro bei Saturn
»
Deal: Gigabyte G5 Gaming-Laptop mit GeForce RTX 4060 und 144 Hz Display kostet aktuell nur 756 Euro
Lenovo Legion 5 16IRX G9 : Intel Core i7-14650HX, 16.00", 2.4 kgLenovos Legion 5i 16 G9 bietet ein tolles 240-Hz-Display und Advanced Optimus, aber nutzlose AI-Engine+
Dell Inspiron 16 Plus 7630 : Intel Core i7-13700H, 16.00", 2.2 kgDeal: Dell Inspiron 16 Plus Multimedia-Notebook mit RTX 4060 zum Sparpreis dank 24% Rabatt
Asus ROG Flow X16 GV601V : Intel Core i9-13900H, 16.00", 2.1 kgAmazon Bestpreis-Deal: Asus ROG Flow X16 Gaming-Convertible mit Intel Core i9 und GeForce RTX 4060
Lenovo LOQ 16IRH8 : Intel Core i7-13620H, 16.00", 2.7 kgAmazon: Günstiger Gaming-Laptop Lenovo LOQ 16 mit QHD-Display, RTX 4060 und AMD Ryzen 7 zum neuen Bestpreis
HP Envy 16-h1000 : Intel Core i9-13900H, 16.00", 2.7 kgDeal: Hübsches HP Envy 16 Notebook mit RTX 4060 und 120Hz QHD-Display um 400 Euro rabattiert
Lenovo Legion Slim 5 14APH8 : AMD Ryzen 7 7840HS, 14.50", 1.7 kgKompakter 14 Zoll Gaming-Laptop Lenovo Legion Slim 5 AMD mit 3K-OLED, 32 GB RAM und RTX 4060 günstig im Flash Sale
Lenovo Legion Pro 5 16IRX8 : Intel Core i7-13700HX, 16.00", 2.5 kgFlash Sale: Lenovo Legion Pro 5i 16 Gaming-Laptop mit 500 Nits 240 Hz QHD-Display, RTX 4060 und Intel HX zum Bestpreis
SCHENKER XMG Apex 17 (Late 23) : AMD Ryzen 7 7840HS, 17.30", 2.5 kgDeal: XMG Apex 17 Gaming-Laptop mit 240 Hz QHD-Display und GeForce RTX 4060 gibts jetzt mit sattem Rabatt
Lenovo Legion Slim 5 16APH8 : AMD Ryzen 7 7840HS, 16.00", 2.4 kgDeal: Günstiger Gaming-Laptop Lenovo Legion Slim 5 16 mit RTX 4060, QHD-Display und kaum Schwächen zum Bestpreis bei Alternate
Dell Inspiron 16 Plus 7630 : Intel Core i7-13700H, 16.00", 2.2 kgLaptop-Deal: Dell Inspiron 16 Plus mit RTX 4060 und QHD-Display zum Bestpreis dank 300 Euro Rabatt
Lenovo Legion Slim 5 14APH8 : AMD Ryzen 7 7840HS, 14.50", 1.7 kgDeal: Lenovo Legion Slim 5 Gaming-Notebook mit OLED-Display, RTX 4060 und 32GB RAM um 350 Euro reduziert
Lenovo LOQ 16IRH8 : Intel Core i7-13620H, 16.00", 2.7 kgLenovo LOQ 16 Budget-Gaming-Laptop mit QHD-Display, RTX 4060 und AMD Ryzen zum Bestpreis im Amazon-Deal
SCHENKER XMG Apex 17 (Late 23) : AMD Ryzen 7 7840HS, 17.30", 2.5 kgDeal: Schenker XMG Apex 15 und 17 Gaming-Laptops mit RTX 4060, AMD Ryzen 7 7840HS und QHD-Display zum Wochenende rabattiert
MSI Cyborg 15 A12VF : Intel Core i7-12650H, 15.60", 2 kgGünstigste Gaming-Notebooks mit RTX 4060: MSI Cyborg 15 und Gigabyte G5 zu Bestpreisen im Weihnachts-Deal
Lenovo LOQ 16IRH8 : Intel Core i7-13620H, 16.00", 2.7 kgDeal: Eines der besten Budget-Gaming-Laptops Lenovo LOQ 16i mit QHD-Display und RTX 4060 zum Bestpreis direkt vom Hersteller
Dell Inspiron 16 Plus 7630 : Intel Core i7-13700H, 16.00", 2.2 kgDeal: Dell Inspiron 16 Plus QHD-Notebook mit RTX 4060, 32GB RAM und Core i7-13700H jetzt im Angebot
»
Laptop-Deal: Dell Inspiron 16 Plus mit QHD-Display, Core i7-13620H, 16GB RAM und 1TB-SSD zum Bestpreis
Dell G15 5530 : Intel Core i7-13650HX, 15.60", 3 kgDeal: Dell G15 Gaming-Notebook mit Core i7-13650HX und RTX 4060 aktuell um 21% reduziert
Lenovo Legion Slim 5 16IRH8 : Intel Core i5-13500H, 16.00", 2.4 kgDeal: Lenovo Legion Slim 5 Gaming-Notebook mit RTX 4070, 32GB RAM und hellem QHD-Display um fast 500 Euro reduziert
Dell G16 7630 : Intel Core i7-13650HX, 15.60", 2.9 kgDeal: Dell G16 QHD-Gaming-Notebook mit Core i9, RTX 4070 und 32GB RAM um 20% reduziert
»
Deal: Dell G16 Gaming-Laptop mit RTX 4070, Core i9 und 240Hz QHD-Panel zum Vorzugspreis mit 18% Rabatt
Lenovo Legion Slim 5 14APH8 : AMD Ryzen 7 7840HS, 14.50", 1.7 kgFlash-Sale: Lenovo Legion Slim 5 14 Gaming-Laptop mit 2,8K-OLED-Display und RTX 4060 zum Deal-Preis
Gigabyte G5 KF : Intel Core i5-12500H, 15.60", 1.9 kgGigabyte G5 (2023): FHD-Gaming-Notebook bereits ab 599 Euro erhältlich
Microsoft Surface Laptop Studio 2 RTX 4060 : Intel Core i7-13700H, 14.40", 2 kgMicrosoft verlangt hohe Preise, aber die neuen Surface-Laptops sind nicht gut genug
SCHENKER XMG Apex 17 (Late 23) : AMD Ryzen 7 7840HS, 17.30", 2.5 kgXMG Apex 17 (Late 23): Ein QHD-Gaming-Notebook für lärmempfindliche Ohren
Lenovo LOQ 16IRH8 : Intel Core i7-13620H, 16.00", 2.7 kgLenovo LOQ 16 getestet: Fähiger Gaming-Laptop zum günstigen Preis
Captiva Advanced Gaming I74-121 : Intel Core i5-13500H, 15.60", 2.3 kgCaptiva Gaming-Laptop getestet: Deutscher Vertrieb mit unnötigen Geheimnissen um die Herkunft
Gigabyte G5 KF : Intel Core i5-12500H, 15.60", 1.9 kgGaming-Notebook mit RTX 4060: Gigabyte G5 dank 19% Deal-Rabatt wieder günstig im Angebot
Alienware m16 R1 Intel : Intel Core i7-13700HX, 16.00", 3 kgDas Alienware m16 R1 (Intel) bietet eine hohe Systemleistung aber nur maue Laufzeiten
MSI Cyborg 15 A12VF : Intel Core i7-12650H, 15.60", 2 kgDeal | RTX-4060-Gaming-Laptops von MSI auf Bestpreis-Niveau ab 949 Euro bei Notebooksbilliger
Lenovo Legion Pro 5 16IRX8 : Intel Core i7-13700HX, 16.00", 2.5 kgDeal | Leiser Gaming-Laptop Lenovo Legion Pro 5 16 erstmals deutlich reduziert mit RTX 4060, Intel HX-CPU und 240 Hz QHD-Display
Lenovo Yoga Pro 9 16-IRP G8 : Intel Core i7-13705H, 16.00", 2.2 kgLenovos Yoga Pro 9i 16 hat zwar ein tolles Mini-LED-Panel, ist aber schlechter als das kleinere 14-Zoll-Modell
Asus Vivobook Pro 16X K6604JV-MX016W : Intel Core i9-13980HX, 16.00", 2.1 kgExtrem schneller Creator: Asus Vivobook Pro 16X getestet
Dell G15 5530 : Intel Core i7-13650HX, 15.60", 3 kgDeal: Dell G15 Gaming-Notebook mit Core i7-13650HX, RTX 4060 und 240Hz-QHD-Display jetzt mit 21% Rabatt
Asus Zenbook Pro 14 OLED UX6404VV : Intel Core i9-13900H, 14.50", 1.6 kgAsus: Drei neue Notebooks mit OLED-Display offiziell erhältlich, auch mit Core i9-Prozessor und GeForce RTX 4080
Acer Predator Helios 16 PH16-71-731Q : Intel Core i7-13700HX, 16.00", 2.6 kgAcer Predator Helios 16 Gaming-Laptop getestet: Leise trotz ausgereizter RTX 4060
SCHENKER XMG Pro 15 (E23) : Intel Core i9-13900HX, 15.60", 2.4 kgXMG Pro 15 und Focus 15 - Es sind oft nur die Kleinigkeiten
»
XMG Pro 15 getestet - Dezenter Gaming Laptop
Acer Nitro 17 AN17-51-71ER : Intel Core i7-13700H, 17.30", 3 kgAlles besser: Gaming-Notebook Acer Nitro 17 im Test tadellos
Asus ROG Flow X16 GV601V : Intel Core i9-13900H, 16.00"Getestet: Mehr Allroundfähigkeiten wie im Asus ROG Flow X16 bitte!
Asus ZenBook Pro 14 Duo UX8402VV-P1021W : Intel Core i9-13900H, 14.50", 1.8 kgAsus ZenBook Pro 14 Duo getestet: Mit dem Zweiten ist man produktiver
Medion Erazer Defender P40 : Intel Core i7-13700HX, 17.30", 2.9 kgMedion Erazer Defender P40: QHD-Gaming-Notebook mit guter Ausstattung
MSI Cyborg 15 A12VF : Intel Core i7-12650H, 15.60", 2 kgGünstiges Gaming-Notebook mit RTX 4060: MSI Cyborg 15 fällt erstmals unter die 1000-Euro-Marke
»
Deal: MSI Cyborg 15 Gaming-Notebook mit sparsamer RTX 4060 bekommt ersten nennenswerten Rabatt
Asus ROG Flow Z13 GZ301V : Intel Core i9-13900H, 13.40", 1.6 kgDieses AAA-Gaming-Tablet hat es uns angetan: Asus ROG Flow z13 mit RTX 4060 getestet
MSI Cyborg 15 A12VF : Intel Core i7-12650H, 15.60", 2 kgMSI Cyborg 15 A12VF: Gaming-Notebook mit geringem Energiebedarf und langen Laufzeiten
MSI Katana 17 B13VFK : Intel Core i7-13620H, 17.30", 2.8 kgNvidia GeForce RTX 4060: Mittelklasse von Ada Lovelace getestet
Teilen Sie diesen Artikel, um uns zu unterstützen. Jeder Link hilft!
Leistungsklasse 1
Leistungsklasse 2 Radeon PRO W6600M *
Leistungsklasse 3 UHD Graphics 750
Leistungsklasse 4
Leistungsklasse 5 * Geschätzte Position
Autor: Klaus Hinum (Update: 5.01.2023)
 Deutsch
 English
 Español
 Français
 Italiano
 Nederlands
 Polski
 Português
 Русский
 Türkçe
 Svenska
 Chinese
 Magyar